By Tim Taschler
The Swiss National Bank (SNB), Switzerland’s version of the Fed, has been a busy expanding its balance sheet and buying U.S. equities. The SNB now owns over $97 billion of stocks (Figure 1).

Figure 1: Swiss National Bank Holdings (Source: Bloomberg)
The $97 billion sum works out to over $11,000 for every citizen of Switzerland. It would appear that the SNB is as bullish on the U.S. equity market as the majority of Americans (Figure 2).
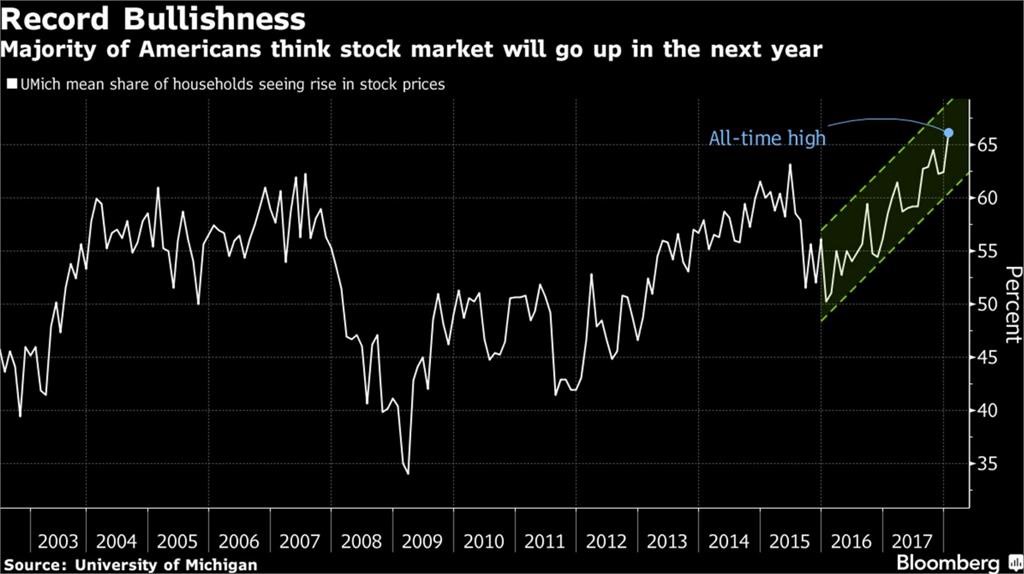
Figure 2: University of Michigan household survey
Another interesting piece of data, courtesy of Bespoke, is that since 1993, if you bought SPY (S&P 500 ETF) on the open every day, and sold it on the close, the return would be -5.2 percent. However, if you did the opposite and bought on close, then sold on open the next day, the return would be 568 percent. What does this mean?
All of SPY’s performance since 1993 came in after-hours, overnight trading.
The markets this past week saw the return of volatility with the volatility index (VIX) moving up 100 percent so far in 2018 (Figure 3).

Figure 3: Volatility Index (VIX) (Source: StockCharts.com as of February 3, 2018)
The yield on a 10-year Treasury bond (TNX) hit a 4-year high (Figure 4) while TLT, the iShares 20+ Year Treasury Bond ETF is now down almost 5.5 percent for the year (Figure 5).

Figure 4: CBOE 10-Year US Treasury Yield (Source: StockCharts.com as of February3, 2018)

Figure 5: iShares 20+ Year Treasury Bond ETF (Source: StockCharts.com as of February3, 2018)
The US Dollar Index (USD or DXY) is also back to levels not seen since late 2014 (Figure 6).
Figure 6: US Dollar Index (Source: StockCharts.com as of February3, 2018)

So what does this mean from an investment standpoint? The future is, of course, unknowable. Everyone has great insight when looking at the left side of the chart (hindsight) but looking at the far right (speculation) is more challenging. As much as a fool’s errand it is, I will make a couple of educated guesses as to what might happen.
It is a sign of the times when a two percent down day in the S&P 500 brings out comparisons to the 1987 crash. Historically, however, stocks don’t crash from all-time highs. An initial correction is generally followed by a rally (that falls short of the high) and then by a more serious correction (or bear market). 1987 played out precisely this way as Figure 7 shows.

Figure 7: SPX (Source: StockCharts.com as of February3, 2018)
Of importance, I think, is that the Fed sold $22 billion of the $4.4 trillion in assets it bought over the last nine years (Figure 8). This is the largest one-week sale since this experiment began with QE1 (TARP). It will be interesting to see if continued balance sheet reduction by the Fed has a similar impact on stocks.

Figure 8: Federal Reserve Total Assets (Source: St. Louis Fed, fred.stlouisfed.org as of February3, 2018)
If the stock market is topping out, which is a distinct possibility, it won’t be long before talk of Fed rate hikes turns into talk of Fed rate cuts and more QE. Is this what the dollar is anticipating with the slide that began in early 2017? If so, then it’s possible that the dollar continues its decline, putting a bid in inflation assets such as gold, miners and food commodities, much as we saw in January through June 2016 (Figure 9).

Figure 9: US Dollar vs. Commodities and Miners (Source: StockCharts.com as of February3, 2018)
The future is unknowable, but a quote attributed to Mark Twain often rings true when discussing markets—“History doesn’t repeat itself but it often rhymes.”
0 comments:
Publicar un comentario