Bonds Are Saying Something - We Should Be Listening
by: Eric Basmajian
Summary
- Despite the equity market rally, long-term interest rates continue to move lower.
- Long-term interest rates move lower when growth and inflation decline.
- The equity market was pessimistic in December and optimistic in January yet conditions have not changed.
- Bonds are speaking - we should listen to what they are saying.
- A comprehensive analysis of Treasury rates.
Bonds Are Saying Something - We Should Be Listening
The euphoria that carried the stock market to an 8% gain in January all but erased the pessimism that led to one of the worst December's on record, when the S&P 500 (SPY) fell nearly 9%. Net, over the past two months, there has been a lot of chop, volatility and constantly shifting narratives that resulted in an equity market that is virtually unchanged; down about 1.5% as of this writing to be exact. While the equity market suffers from the rapidly changing sentiment, narratives and emotion that is typical in stocks, the bond market is different. Short-term bonds can whip around with the stock market which changes expectations of monetary policy from the Federal Reserve. Long-term bonds, specifically 20-30 year Treasury bonds, which are most sensitive to growth and inflation conditions, do not respond to wild emotional swings as the stock market does, and typically do not overreact in either direction. The iShares 20-30 year Treasury ETF (TLT), is the most common proxy for the long bond, carrying an effective duration of 17. There are other ETFs that carry larger effective durations, such as the Vanguard Extended Duration ETF (EDV), an effective duration of 25, but for most of the analysis in this note, we will be looking at TLT in combination with the actual Treasury interest rates.
Long-term bonds have been saying something the past few months, something the equity market has been ignoring. Typically, the long-term bonds are correct and the equity market responds at a later date when sentiment and emotions calm or reverse.
We are going to do a comprehensive study of the moves in the Treasury market starting over the summer and conclude by looking at what the action in interest rates over the last several weeks is suggesting.
While we are only going to look at the recent action, for a long-term analysis of long-term Treasury bonds, I'd refer you back to a previous note I wrote which you can find by clicking here.
While we are only going to look at the recent action, for a long-term analysis of long-term Treasury bonds, I'd refer you back to a previous note I wrote which you can find by clicking here.
The primary factors behind the analysis of the long-term Treasury bonds, and thus ETFs like TLT, are growth expectations, inflation expectations, and credit risk. I have covered these factors at length in previous notes, and this can be empirically proven in the data. In this note, those factors will be used as assumptions.
Interest Rates Will Always Follow Nominal GDP Growth Trends:
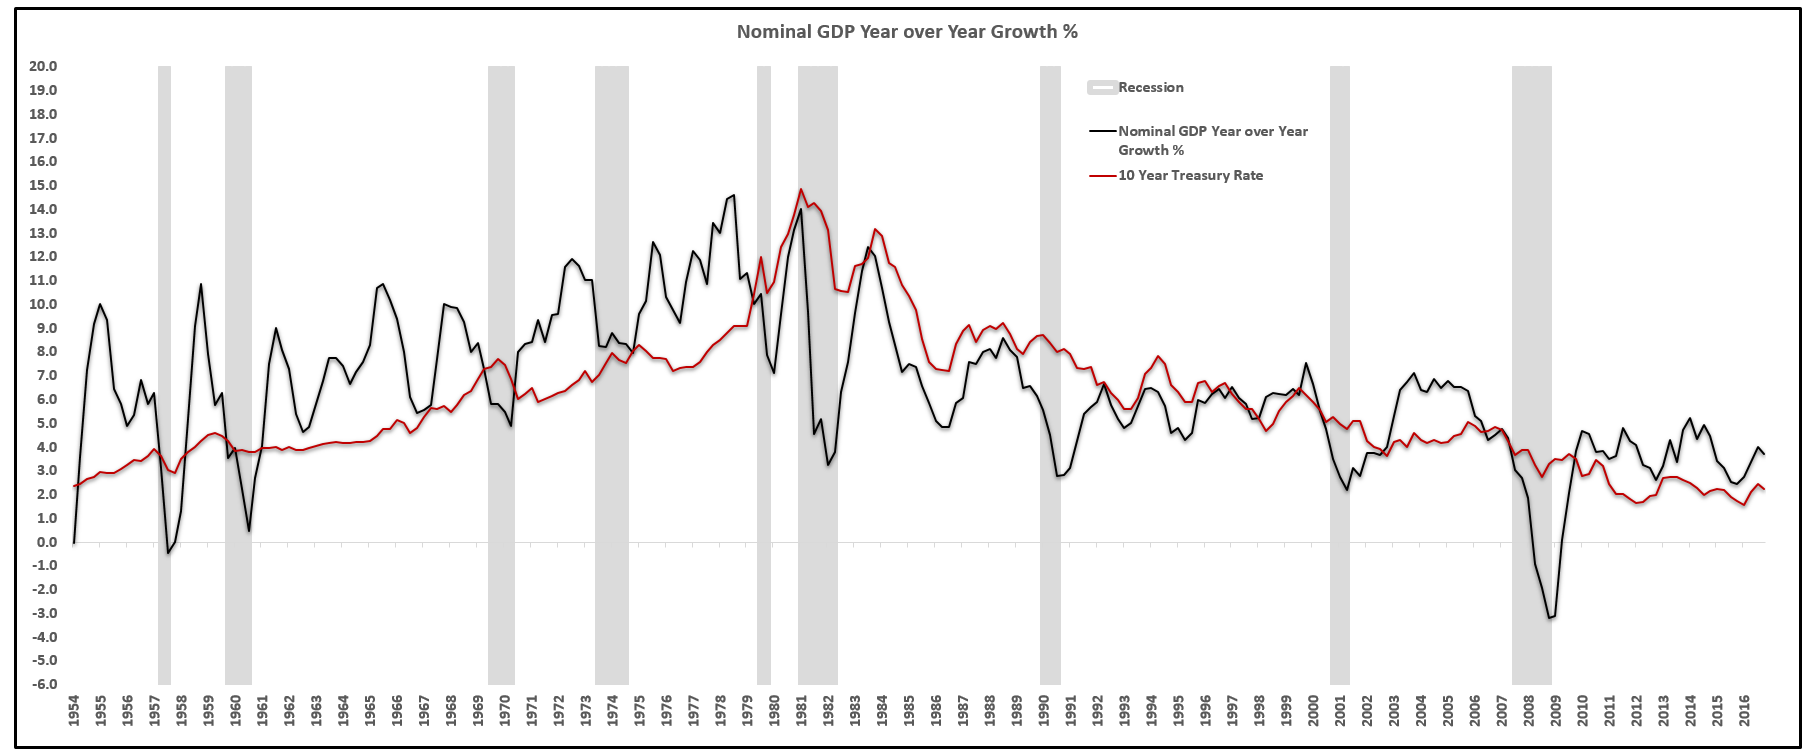 Source: BEA, FRED, BLS, EPB Macro Research
While the S&P 500 rallied in January, TLT was up 0.38% as well. In December, when the equity market fell 8%, TLT only gained 5.9%, insufficient for some that incorrectly view Treasury bonds as inverse equity funds. Even famous investors such as Jefferey Gundlach suggested that the lack of a rally in long-term bonds given the rapid declines in equities is suggestive of a bearish catalyst for long-term Treasuries. If that were true, why does the inverse not hold true? If the equity market increased 15% since Christmas Eve and TLT is also up 0.54%, is the lack of a decline in long-term bonds given such a severe equity rally a bullish catalyst for the long bond?
If the inverse of the analysis does not hold, the analysis is likely missing a few critical factors.
Let's take a look at the move in bonds over the past year and use the analysis to better understand what bonds are saying today.
TLT Over The Past One Year
Over the past year, TLT has increased by 2.08% in total return terms, suffering a 7.92% drawdown in that time period.
TLT Total Return:
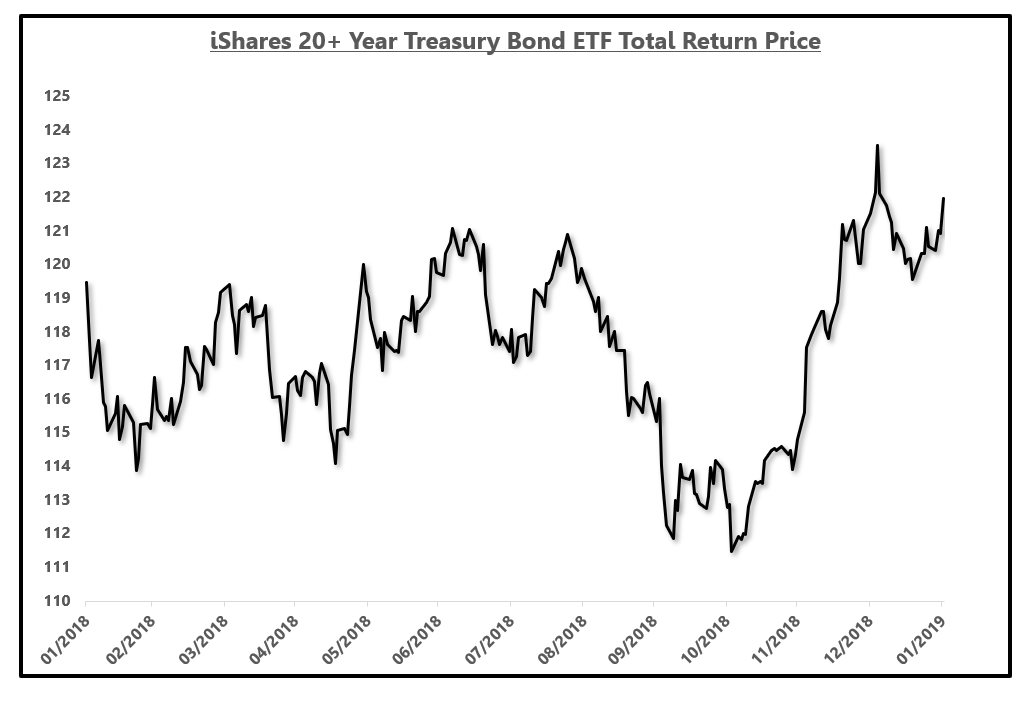
Source: YCharts, EPB Macro Research
TLT currently is 9.5% off the high level made in 2016 but that was a time period when inflation was 0.8% and the U.S. was escaping a near recession along with the rest of the world. Using the assumptions above, growth and inflation, a near global recession and sub 1% inflation sent the 30-year Treasury rate to a low of 2.2% and TLT to a high of $135. To get back to those levels, growth and inflation conditions would have to be similar which they currently are not.
I make that point just to preempt any rebuttals that claim TLT is off the all-time high. Growth and inflation conditions are not the same. If the U.S. experiences a near recession and sub 1% inflation as was the case in early 2016, then TLT will go back to all-time highs.
With that out of the way, let's focus on the last year.
When analyzing interest rates, you have to look at both the nominal rate of interest, currently 3.05% on the 30-year Treasury as well as the shape of the yield curve. The shape of the yield curve for this note will be proxied via the spread between the 30-year Treasury rate and the 2-year Treasury rate.
30-2 Treasury Spread:
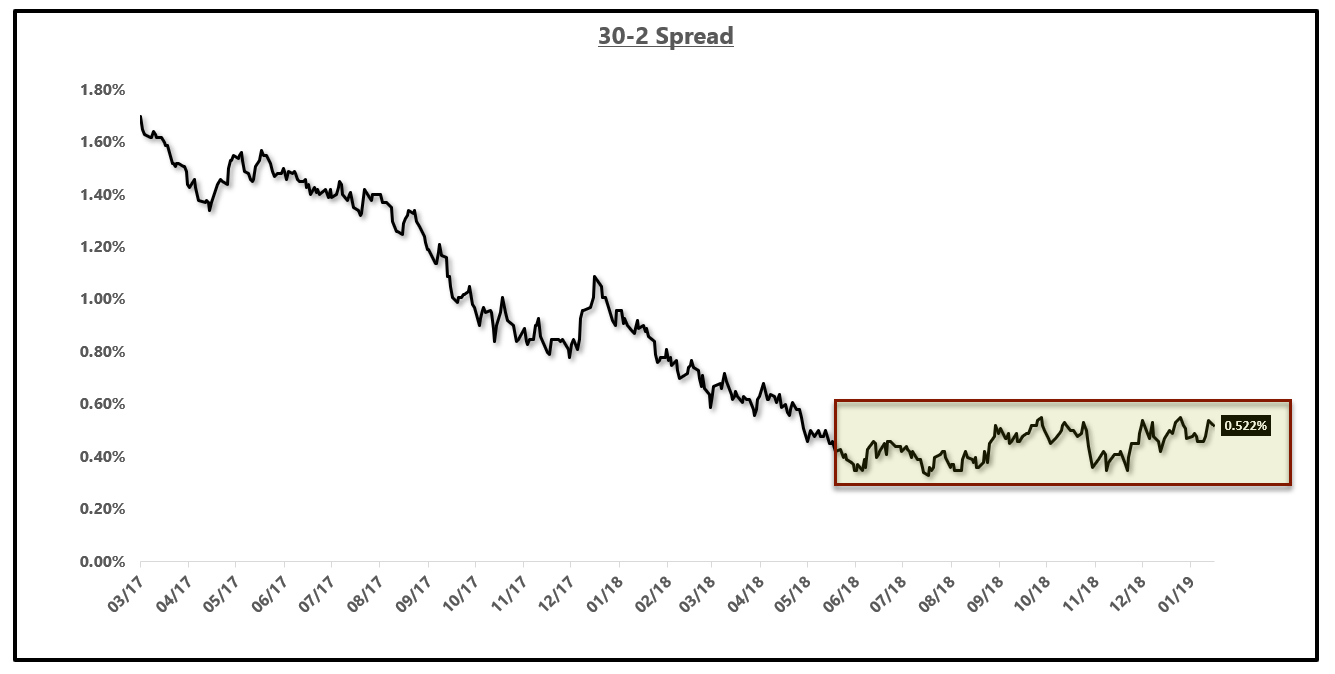
Source: YCharts, EPB Macro Research
The shape of the yield curve, among other factors, predominantly represents future growth/inflation expectations over the next several years. If the yield curve is steepening, growth expectations are rising. If the yield curve is flattening, growth expectations are falling.
If the yield curve remains constant, growth expectations are more or less unchanged.
This can explain why an inverted yield curve is a strong harbinger of recessionary conditions (future growth expectations are falling). The yield curve steepens into and during a recession because the Federal Reserve is cutting the short-end rate and also because if the recession is at the doorstep, the next several years are likely to bring increased rates of growth if the worst is coming in the next several months.
As I write to members of EPB Macro Research frequently, it is highly unlikely for the yield curve to invert without a recession occurring but a recession can occur without an inverted yield curve.
Long-Term History Of The Yield Curve:
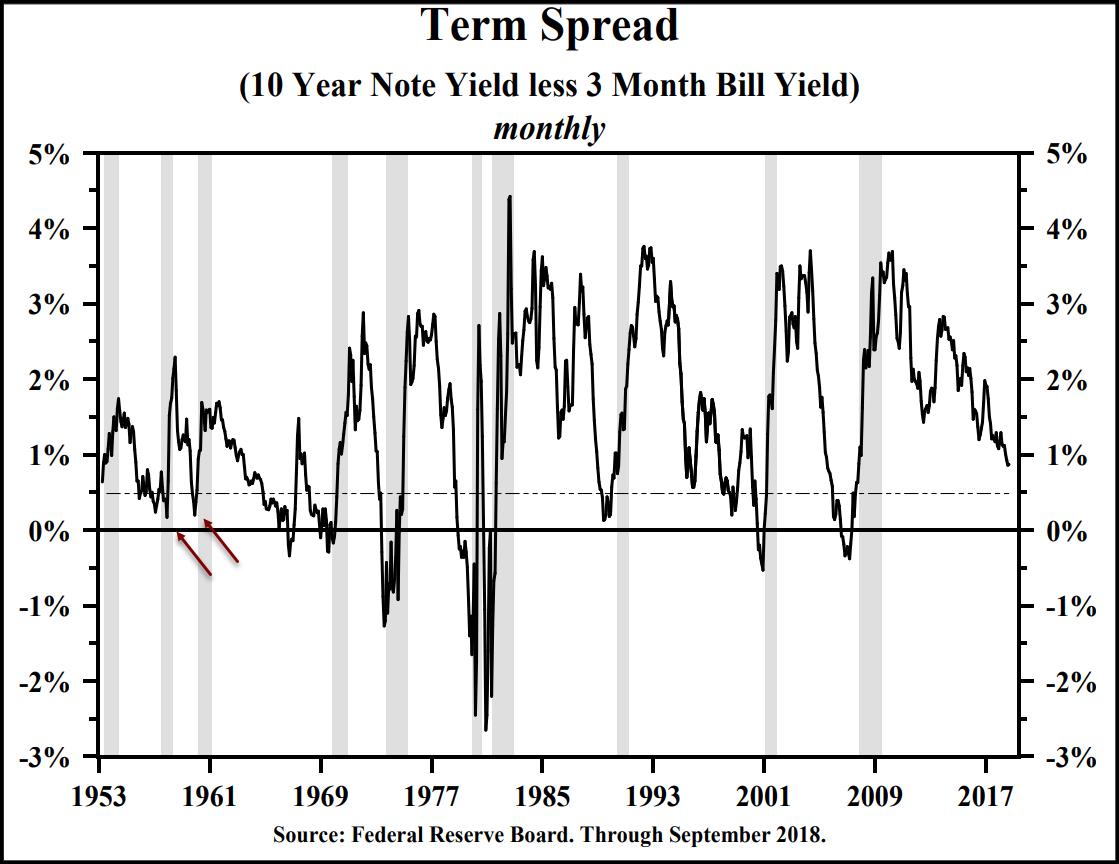
Source: Hoisington Management, Federal Reserve, Lacy Hunt
All recessions throughout history have been preceded by a material flattening of the yield curve but not necessarily a fully inverted yield curve. Thus, we must focus simply on the rate of change in the yield curve; steeper or flatter.
Let's now go back to the previous one year and study the drawdown in long-term rates that took place from July through November.
TLT Total Return:
Source: YCharts, EPB Macro Research
At the start of July, when TLT peaked at a price of $122.75, the 30-year yield was about 2.95% and the 2-year yield was 2.57%. The spread between the 30-year Treasury rate and the 2-year Treasury rate was roughly 0.35%. A spread of 35 basis points was where the market was comfortable considering growth expectations and future monetary tightening. At the start of July, based on the Fed Near Term Forward spread, or the difference between the Treasury rate maturing in six quarters and the Treasury rate maturing in three months, a proxy for monetary tightening over the next year, the market was expecting 75 basis points of tightening.
Fed Near Term Forward Spread:
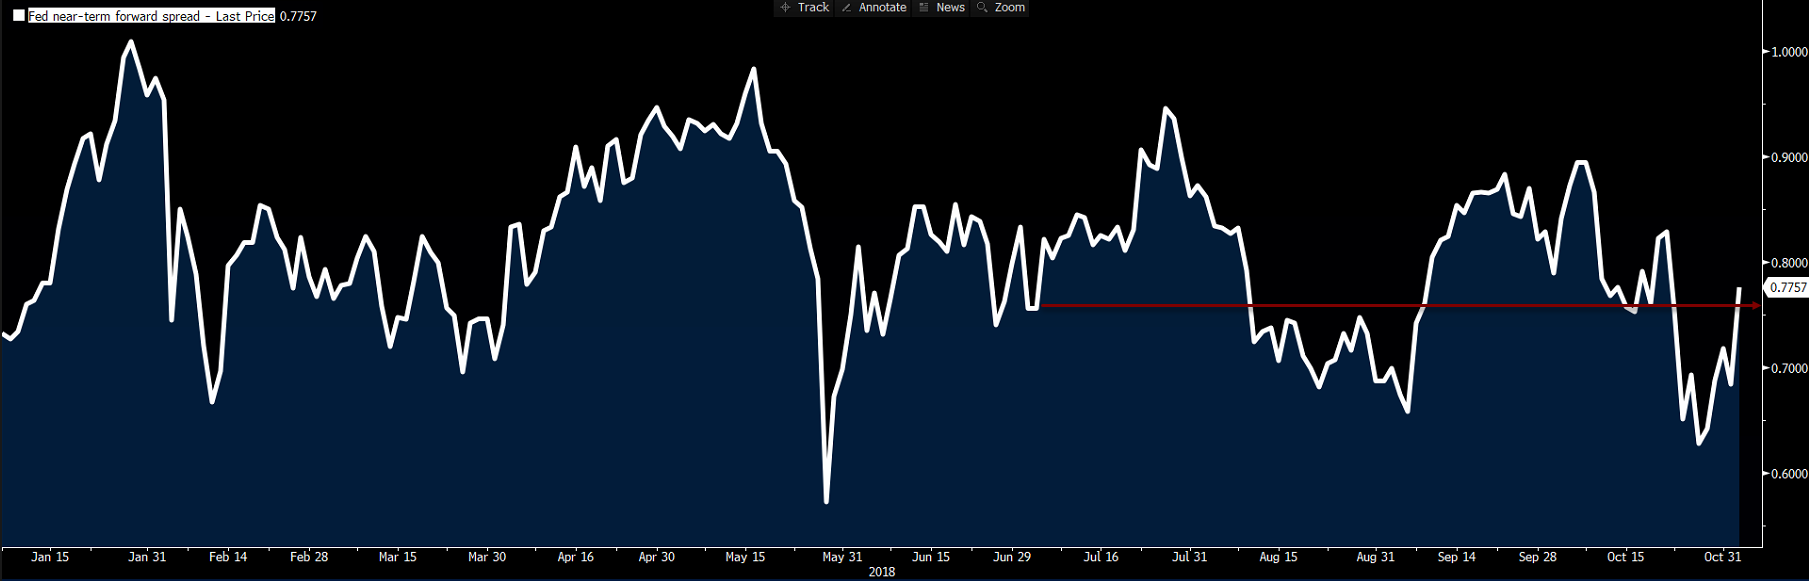
Source: Bloomberg
So, what led to the sharp drawdown in TLT (increase in interest rates) that ended in November?
From July to November, expectations of monetary tightening by the Federal Reserve drifted higher, moving to 90 basis points over the next year at the end of November. Again, all else equal, the market would keep the shape of the yield curve the same and shift the entire curve higher in a parallel fashion. Thus, equal growth expectations plus an increase of 15 basis points on rate hike expectations would have upward pressure of about 15 basis points on the 30-year yield.
Secondly, and equally as important, from July to November, there were a series of economic data points that smashed all estimates and raised growth expectations notably.
The most drastic example is the ISM Services number which jumped from a reading of 55.70 to 61.60 in one month.
ISM Services:

Source: YCharts, EPB Macro Research
Right after this report, the expectations of monetary tightening jumped as can be seen in the Fed Near Term Forward Spread.
Fed Near Term Forward Spread:
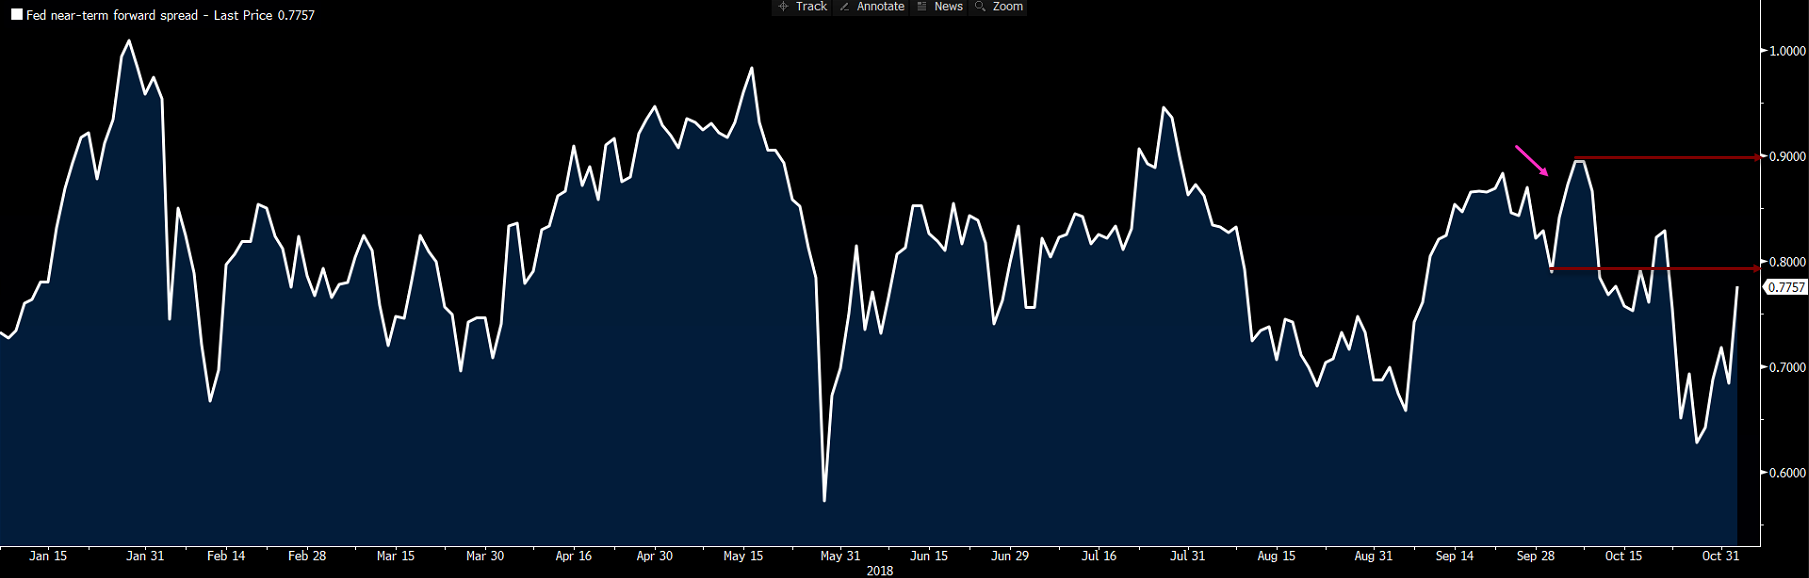
Source: Bloomberg
There were other data points that suggested growth would increase but the ISM report was the most impactful due to how large the report was relative to expectations.
As a result of the increased growth expectations from better economic data than what was priced in resulted not only in an increase of monetary tightening expectations of about 15 basis points but a steepening of the yield curve.
From July to November, on the better growth data, the 30-2 spread rose from 0.33% to a high level of 0.55%, a 0.22% increase.
To summarize, increased monetary tightening expectations put about 15 basis points of upward pressure on the entire Treasury curve and increased growth expectations steepened the yield curve by about 22 basis points, a 0.37% to increase to the long-end of the curve.
30-2 Treasury Spread:
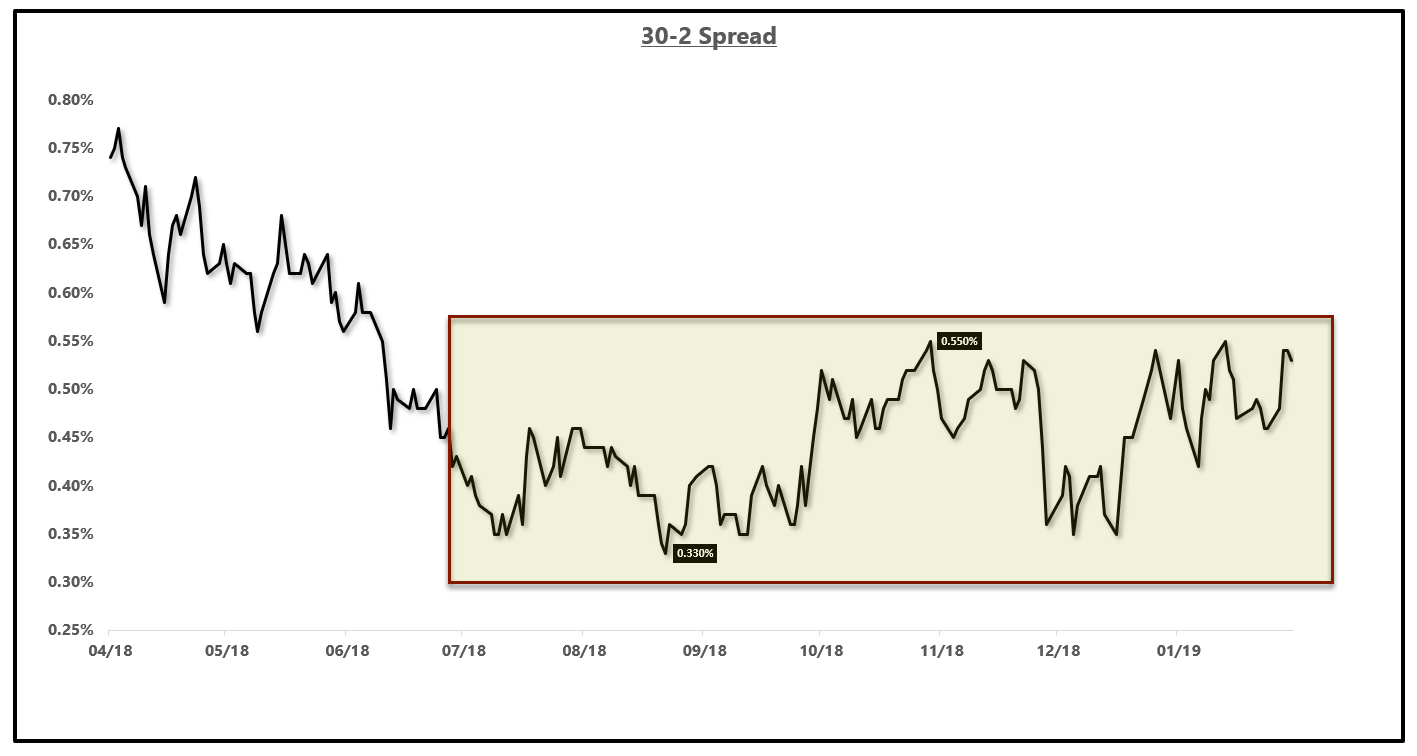 Source: YCharts, EPB Macro Research
This was a double whammy for the long bond and TLT; increased rate hike expectations and increased growth expectations.
As the chart above shows, the yield curve, or growth expectations, re-priced in the middle of 2018, as the Treasury market anticipated that the amount the Fed had already tightened would start to slow growth, and has been oscillating in a range of 0.35% to 0.55% for the past six months or so.
Today, the 30-2 spread is roughly the same. The yield curve compressed sharply into December as the equity market was falling as growth expectations were notably coming down. The curve did not invert or get close to inverting because there was no recession in the economic data. The stock market overreacted and priced in a recession before it was time while the bond market, less emotional and more reliant on data, simply lowered growth expectations.
As the equity market has rallied and all the fears of growth have seemingly disappeared, the yield curve has steepened again, back to the high level of the band over the past six months.
Why are interest rates lower on the long end? Monetary tightening expectations. As the Fed pivoted dovish and yanked all rate hikes out of the market, the 2-year yield has dropped sharply from about 3% to 2.50%, a 50 basis point drop. As noted, growth expectations are back to roughly the same level as before the equity market correction, especially after the jobs report, but the 2-year yield is 50 basis points lower, pulling the rest of the curve lower as to maintain the shape of the curve and thus, the 30-year yield is down 46 basis points from a high level of 3.46% to 3.0% today.
Short-Term Rates:
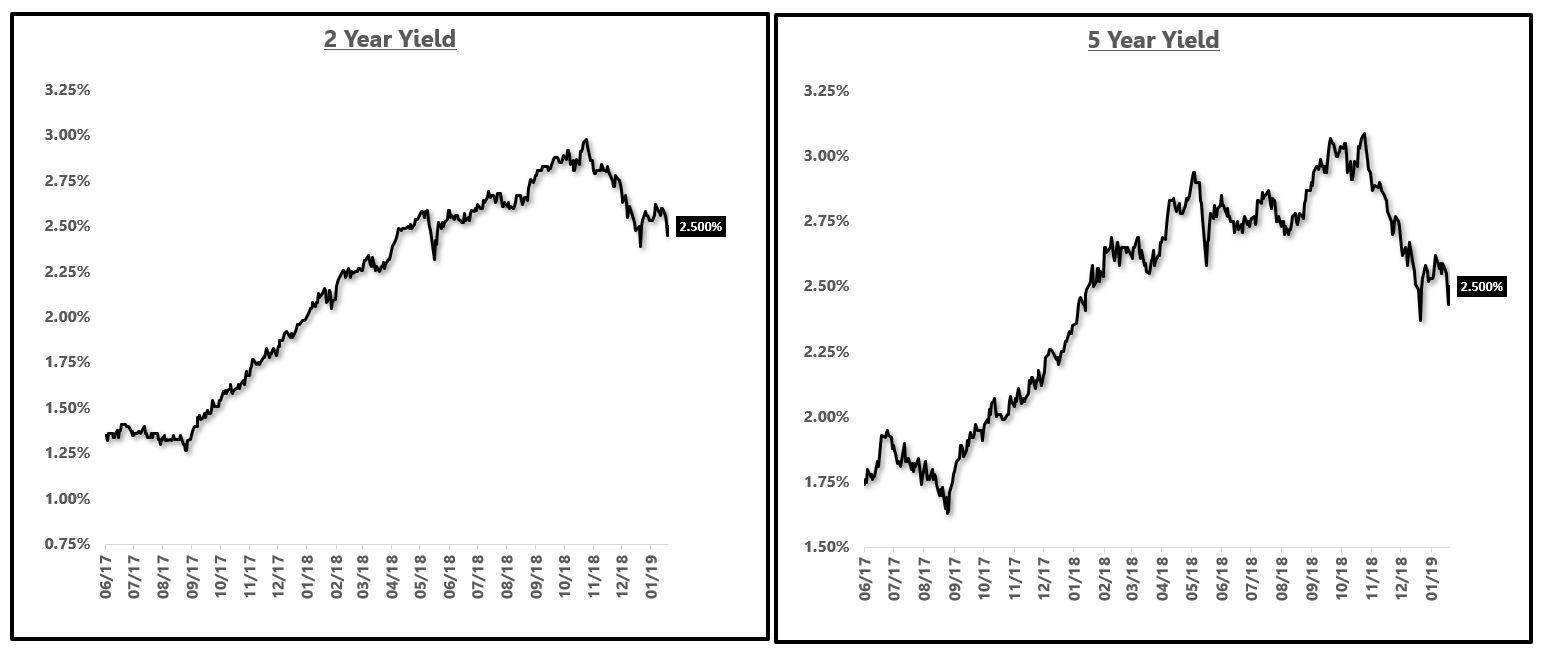
Source: YCharts, EPB Macro Research
So, what will happen with TLT and long-term interest rates going forward?
Future Direction Of Interest Rates
Now that we have explained the moves in TLT and long-term rates with data and true explanations rather than narratives about China selling Treasuries or fiscal deficits that cannot be quantified, we can have a reasonable idea of where rates are headed in the future or at least, what will drive rates in the future.
The key elements to consider are monetary tightening expectations for a parallel shift higher or lower for the whole yield curve and growth/inflation expectations for the shape of the yield curve.
Now that the Fed is essentially out of the market, with the market forecasting zero interest rates hikes, growth expectations play a larger role.
Let's spell it out.
Right now, the Fed is priced for zero action in 2019 so unless that changes, the 2-year yield should trade in a range until expectations change one way or the other, rate hikes back into the market or a rate cut coming. If rate hikes are back in the market, the 2-year yield will shift higher and growth expectations being equal, 30-year rates would raise an equal amount as to maintain the shape of the curve.
If the market starts to forecast rate cuts on the horizon, with growth expectations being equal, the 30-year yield will fall below 3.0% again as to maintain the shape of the yield curve.
The same goes for growth expectations. Right now, growth expectations are at the upper end of the range set over the last six months on a roaring equity market and a strong jobs report. If growth expectations continue to rise, the curve will steepen and the long-end will sell off.
Conversely, if monetary tightening expectations remain constant and growth expectations come down, the curve will flatten to the lower end of the band, about 15 basis points lower, putting the 30-year yield in the high 2.8% range, about where the 30-year yield bottomed in January when the Fed was priced for no rate hikes and growth expectations were diminished with the equity sell-off.
What About A Recession?
A recession is not in the economic data in the United States and that is why the yield curve has been simply flattening and steepening within a range based on the prevailing sentiment around growth conditions.
If this global growth scare passes, and the U.S. economy starts to accelerate again, the yield curve will break out of this range and start to steepen again, putting upward pressure on 30-year rates.
Should the economic data worsen, however, and look more like Germany, indicating recession probability is rising, the yield curve will move back towards the bottom of that range and actually move closer to the flat-line should recessionary conditions look probable.
Again, it is highly unlikely for the yield curve to invert without a recession occurring but a recession can occur without an inverted yield curve; it is the flattening or steepening to be aware of.
Final Thoughts
One last reason to bring up as to why the yield curve (growth expectations) has been trading in a range is due to the lack of economic data releases from the government shutdown. Even though the shutdown is over, most of the data has still been withheld.
The last update on personal consumption, 70% of the entire economy is for the November 2018 reporting period. We are now in February so the Treasury market, in a sense, has been flying blind as to the direction of the economic data and thus, meandering in a range until conclusive evidence is reported.
What you should do about TLT or long-term bonds is simply based on your thoughts about monetary tightening and growth/inflation expectations.
One of four scenarios can occur. At the risk of repeating myself, here are your options.
Interest Rate Scenario Analysis:
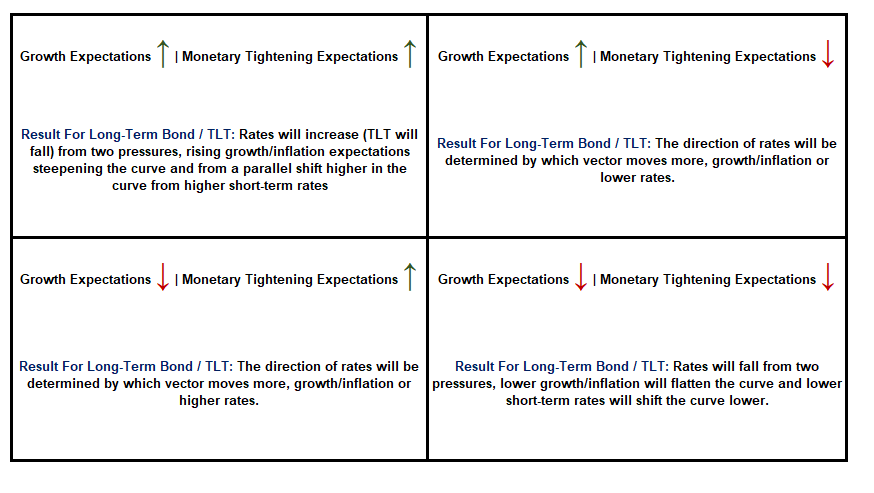
Source: EPB Macro Research
If you think that growth expectations are going to come down over the next several months, as I believe based on the leading indicators, and monetary tightening expectations will be moving anywhere but up, the pressure on the 30-year yield will be lower and in the short-term, we will see 2.9% again on the 30-year, indicating upside for TLT.
To clarify, this analysis is shorter term in nature than the secular call on interest rates which suggests growth and inflation will continue to trend lower and make a new secular low. For more on that analysis, click here.
There are dozens of factors that drive interest rates on a daily and weekly basis but over a long-term trending time period, these are the factors to be aware of.
0 comments:
Publicar un comentario