Is The Fed Losing The Thread? What May Lie Ahead
by: DoctoRx
- The Fed stood pat Thursday, but equity markets sold off.
- Official commentary from the Street could not explain the (mild) sell-off.
- I present a possible rationale: perhaps the Fed is already too tight and should, therefore, sit tight.
It's raining on one side of the street, but the Fed only sees the sunny side
- Official commentary from the Street could not explain the (mild) sell-off.
- I present a possible rationale: perhaps the Fed is already too tight and should, therefore, sit tight.
It's raining on one side of the street, but the Fed only sees the sunny side
Stock markets reacted badly Thursday to the Federal Open Market Committee's statement, even though Zero Hedge - a haven for short-sellers, gold bugs, and gloom-and-doom purveyors - reported as follows:
While there were virtually no surprises in today's FOMC statement - at least relative to expectations, with Goldman's redline statement laid out earlier a carbon copy of what the Fed eventually published - the oddly hawkish market reaction suggests that the Fed did in fact say something that was unexpected…
We'll see what the many Fed "whisperers" and independent analysts come up with, but here's what bothered me, in real time, about the FOMC's point of view. From the part of the statement describing the economy, the Fed sees:
...the labor market has continued to strengthen and that economic activity has been rising at a strong rate. Job gains have been strong, on average, in recent months, and the unemployment rate has declined. Household spending has continued to grow strongly, while growth of business fixed investment has moderated from its rapid pace earlier in the year.
The Fed, or FOMC, is seeing a Goldilocks scenario. Even the one parameter it mentioned as weakening, business fixed investment, did so from a previously "rapid" pace. So that's fine with the Fed.
I see something different. Yes, there's that sunny side of the street the Fed describes, much of which - employment and inflation, discussed later in the statement, are backward-looking indicators. Consumer spending is more of a coincident indicator and therefore, not very helpful in guiding policies that work with, say, a 6- to 12-month lag. Business investment, however, is more of a forward-looking indicator.
What else is a good forward-looking metric related to the Fed's long march to increase interest rates, which began in December 2015 and has thus lasted longer than any rate hike period in decades?
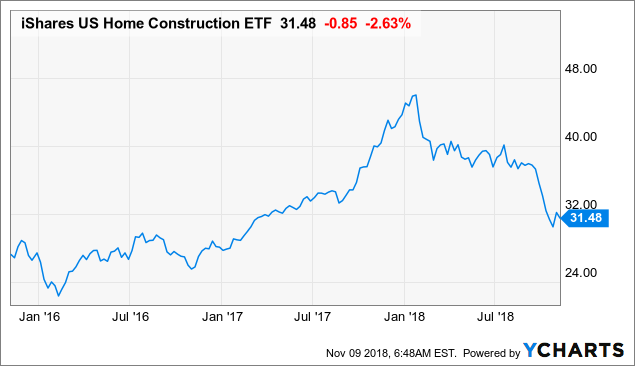
Here's one: the housing market. Housing stocks (ITB) have taken one look at the Fed's policies and the results on the ground, and given this pattern:
 ITB data by YCharts
That's about a one-third haircut in only about 10 months.
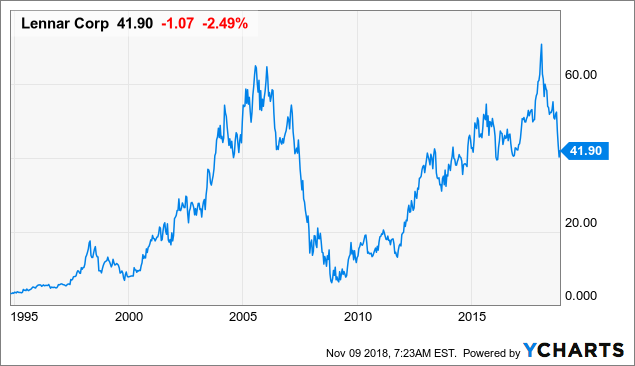
A further problem is, while ITB is weighted toward the homebuilder stocks, in aggregate, a notable part of the ETF's holdings includes more stable consumer discretionary stocks like Home Depot (HD), Lowe's (LOW), and Sherwin-Williams (SHW). ITB's largest holding is Lennar (LEN), which is down from a January high of $72.17 to close Thursday at $41.90. The second-largest holding, D.R. Horton (DHI), is down from $53 to $34.
ITB had not been formed yet when housing stocks peaked before the Great Recession. But a look back at LEN shows a typical homebuilder peak in and around mid-2005:
 LEN data by YCharts
When the builders peaked around July 2005, the Fed had raised rates 9 times for a total of 225 basis points, or 2.25% percentage points. Unbeknownst to anyone, that was already enough - or too much.
Moving to today, perhaps the Fed's 8 rate hikes, totaling 200 basis points, plus reversal of QE, have already been enough - or too much?
And what held true in 2005 for housing also held true for automakers. This pattern is also seen again now.
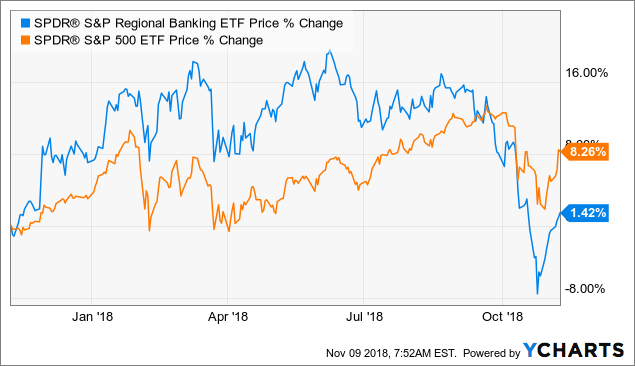
Moving on to larger stocks, the pattern that began occurring in 2006 is occurring now. That is, the banking stocks most closely dependent on local credit conditions - the regional banks - are performing badly. Here's a chart of a large regional bank ETF (KRE) versus the S&P 500 (SPY):
 KRE data by YCharts
Larger banks and asset managers also have been performing in weak fashion.
Something similar was seen during the Fed's last two tightening periods, mid-1999-2000 and 2004-2007.
All the above are the "rainy side of the street" that the Fed is either not seeing or, as in 2006-2007, not caring about. In that period, it was "too late." But in 2000, it was accepted, and the credit-sensitive housing sector became a source of strength during the dot-com recession of 2001.
I'm not predicting a recession.
What I'm saying is that there are major parts of the economy where the macro data has weakened and may have turned down, and where the judgment of the marketplace - which is a better-than-average indicator - says the Fed is making a mistake.
Strong dollars matter
Whether by the trade-weighted US dollar index (TWEXB - not a trading symbol, though) or the trading vehicle known as USDX (or DX) or other measures, the US dollar has neared or reached levels also reached as the boom of the '90s was peaking. A rise in the trading value of the US currency weakens exports and encourages imports, thus hurting US business. It also restrains inflation; and/or reflects waning US inflation pressures. (Note: You can track the daily value of TWEXB at a Fed webpage.)
A persistently rising, strong dollar has correlated with bearish-to-bullish reversals in the bond market and bullish-to-bearish reversals in the SPY. It also has correlated with weakness in commodity prices, notably gold (GLD) and crude oil. I've been publicly bearish on gold since August 2016 and on crude oil since earlier this year.
Some thoughts on cash and conflicting possibilities for stocks and bonds
This brief contribution is being written a little after 8 AM on Friday. The S&P 500 futures are at 2795, and bonds are down a couple of ticks in yield with the 10-year Treasury at 3.21%. The only wealthier, large country with a higher 10-year govie yield is Italy at 3.44%. France is at 0.80% and the UK is at 1.53%. Australia, typically a high-interest-rate country, is at 2.76%.
I have no particular bearish thoughts on the SPY for now. The November-January period is the strongest 3-month period of the year, and I saw a stat that midterm periods are typically much stronger than average for that period. So seasonality argues against the bears. The "tape" is, however, at best iffy for the bulls, so the dictum of not fighting either the Fed or the tape does not comport with a bullish posture.
Seasonally, interest rates should have declined the past 7-8 months, so they have acted badly, and they are soon entering their weakest multi-month period. So seasonality favors stocks and not bonds.
However, when the Fed gets "too" tight, at some point, interest rates drop.
Thus there are cross-currents for traders.
Some thoughts on getting to a personal investment plan follow to end this article.
As I've been saying since late January, for me the elephant in the room for the markets is not interest rate policy; it is the Fed's ongoing and now massive reversal of QE. The Fed is doing something unprecedented, and few are talking about it. It is shrinking the basic money supply, otherwise called its balance sheet, by $50 billion every month. It plans to do this probably into 2020 and possibly even 2021. Because the debt that matures is being replaced by new debt offerings from the Federal government and GSEs, effectively the Fed is withdrawing money from the banking system at a $600 billion annual rate. That's a lot of moolah. Bank loans and leases are $9.46 trillion. Thus, this metric may be diminishing by 6.3% ($0.6/9.46). This rate exceeds the current growth rate of loans and leases, which the linked FRED site shows as 4.4%.
Note, I'm not an economist or any sort of expert on these metrics, so I'm not saying these are the only ways to look at the system. But directionally, I'm comfortable presenting the above concepts and numbers for your consideration. Also important to note is that, of course, Fed policy is not everything in market action. It's a big world out there! So I look at this as one piece of the puzzle - but a major one that can be analyzed.
Given all the cross-currents and given that the Fed is shrinking the supply of cash, I look at cash as a once-hated asset that is returning toward acceptance as an asset that for now gives a positive yield - roughly zero after inflation - but that allows both traders and long-term investors to keep dry powder.
At some point, perhaps there will be clear trading opportunities or better bargains in some asset class.
Not long ago, Yogi Berra might have said that cash was the place no one wanted to go because the Fed had made it too crowded. That's changing with reverse QE.
All in all, and noting the contention in the body politic, my humble opinion is that these are not easy times to suss out what's really going on and what is coming around the corner. Serious Fed mistake or Fed policy reversal leading to markets soaring? Trade war worsening or remitting?
Risk on or risk off?
Summary
Traders may well be wondering if the Fed is too hawkish and is deciding on policy by looking too much at coincidental or backward-looking indicators, ignoring the worsening fundamentals and price action of credit-sensitive sectors of the economy and the markets. That's one risk to investors in equities. A related risk is that this sort of weakness spreads further through the economy.
A possibly bigger risk to asset values is the reversal of QE. Because the Fed did QE to help the economy via a wealth effect, isn't reversing it bearish for the real economy? And since the wealth effect involved driving up equity prices, isn't the major goal of reverse QE to drive P/Es down? If so, why is this not being discussed non-stop in the financial media?
I, therefore, see this as a challenging period in the markets and possibly in the US economy.
0 comments:
Publicar un comentario