A tale of two technical positions
Gold and silver have been consolidating in different fashions. In this article I discuss their relevant technical positions
ALASDAIR MACLEOD
It’s not just a question of silver’s volatility.
When gold is seeking its underlying direction, silver has a nasty habit of declining sharply.
This has been such a time.
But let’s stand back and look calmy at their relative technical positions.
First, gold.
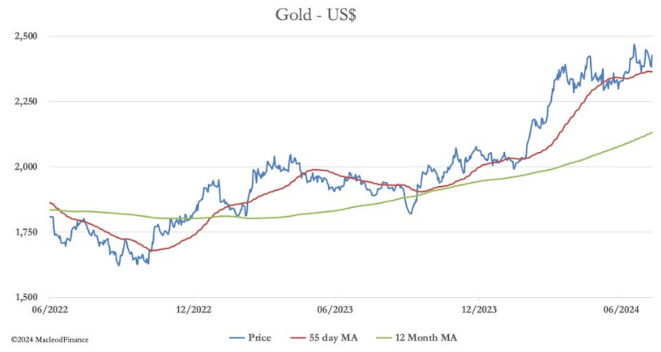
The chart shows gold consolidating at the 55-day moving average level.
This looks like a typical pause when prices have got a little ahead of themselves.
The underlying bullishness is evident in the sideways consolidation, rather than a deeper pullback which would reflect a greater degree of weak buyers being involved.
The 12-month moving average is still accelerating bullishly, putting a time limit on the consolidation.
One cannot rule out a dip back to test it, but a glance at fundamental factors appears to rule out this possibility.
In other words, something earth-shattering would have to happen for that to occur.
This event could be a bear market crash in equities.
But that would require central banks and Chinese housewives to withdraw their bids for physical bullion, at a time when an equity market crash would almost certainly lead the Fed in particular to cut interest rates and renew QE, both aggressively, to stabilise equities.
Such a move would be seen to be highly inflationary by foreign holders of dollars and dollar bonds, provoking a flight into gold, not out of it.
Therefore, whether an equity market crashes or not, the gold price appears firmly underwritten close to current levels.
The brunt of an equity market slide looks like being taken by silver, shown below.
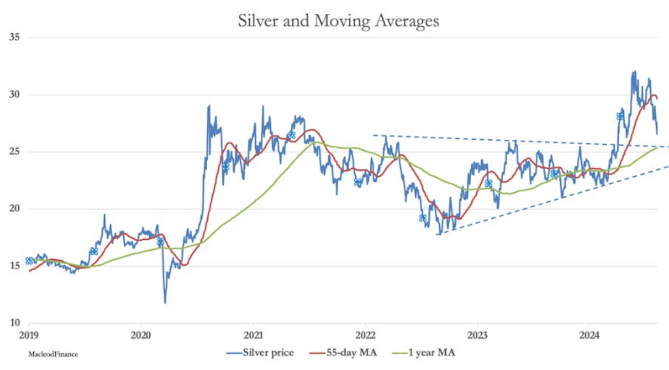
Silver looks set to test the 1-year moving average, which coincides with a normal pullback to the upper trendline of the previous consolidation at $25.40.
A fall to that level is consistent with the sort of selloff which kills all bullishness and causes weak holders to capitulate.
The underlying bullion position differs from that of gold.
With a gold/silver ratio of 88 times, it is priced entirely as an industrial metal.
Even though demand is exceeding supply for the fourth year in a row, a stock market crash is likely to impact industrial metals prices in futures markets negatively because investors associate a weak stockmarket with a slump in demand.
Bullion banks short of silver in derivative markets are therefore certain to shake out as many weak longs as they can.
We should put any such fallout in perspective.
Assuming silver finds support at the $25.40 level, then it has already had two-thirds of its fall.
Traders should be looking for a selloff to buy silver.
Even though it is priced as an industrial metal, silver’s rationale is all about gold.
When gold resumes or is about to resume its attack on new highs, silver moves about twice as fast on the upside.
Gold climbing over $2500 should see silver catching up and surpassing gold very rapidly.
In summary, the technical setup for gold is very bullish, even though in the very short-term there may some choppy waters to navigate if the equity markets decline sharply.
When gold does move ahead, silver has huge catching up to do.


0 comments:
Publicar un comentario