How Deglobalization is Changing the Dynamics of Securing Critical Minerals
BY PAUL WONG AND JACOB WHITE
Key Takeaways
- As deglobalization accelerates, unfettered access to critical minerals is not likely to last.
The world is moving from a system of free and fair access to commodities to one likely marked by interregional competition, and unstable availability and pricing of critical minerals.
- For almost two decades, China has moved aggressively to obtain resource commodities; it has a considerable head start in the evolving battle to secure critical minerals.
However, the West has near-unmatched capabilities in many areas, including capital markets, and is a formidable competitor.
- Commodity pricing dynamics are changing as this new world order emerges.
Critical minerals usage is in the early acceleration phase of a stereotypical S-curve,16 where commodity prices could experience significant volatility due to increasing demand and limited supply.
- Electric vehicle (EV) original equipment manufacturers (OEMs) are moving back to a more vertically integrated process to gain greater control and ownership of their supply chains, including essential minerals.
In many cases, EV OEMs are investing directly in miners to secure access.
During March, commodity prices (and mining stocks) first weakened in reaction to financial system stress and recession fears and then largely recovered toward the end of the month as the U.S. Federal Reserve (the Fed) took steps to reassure investors.
Critical Minerals March Performance
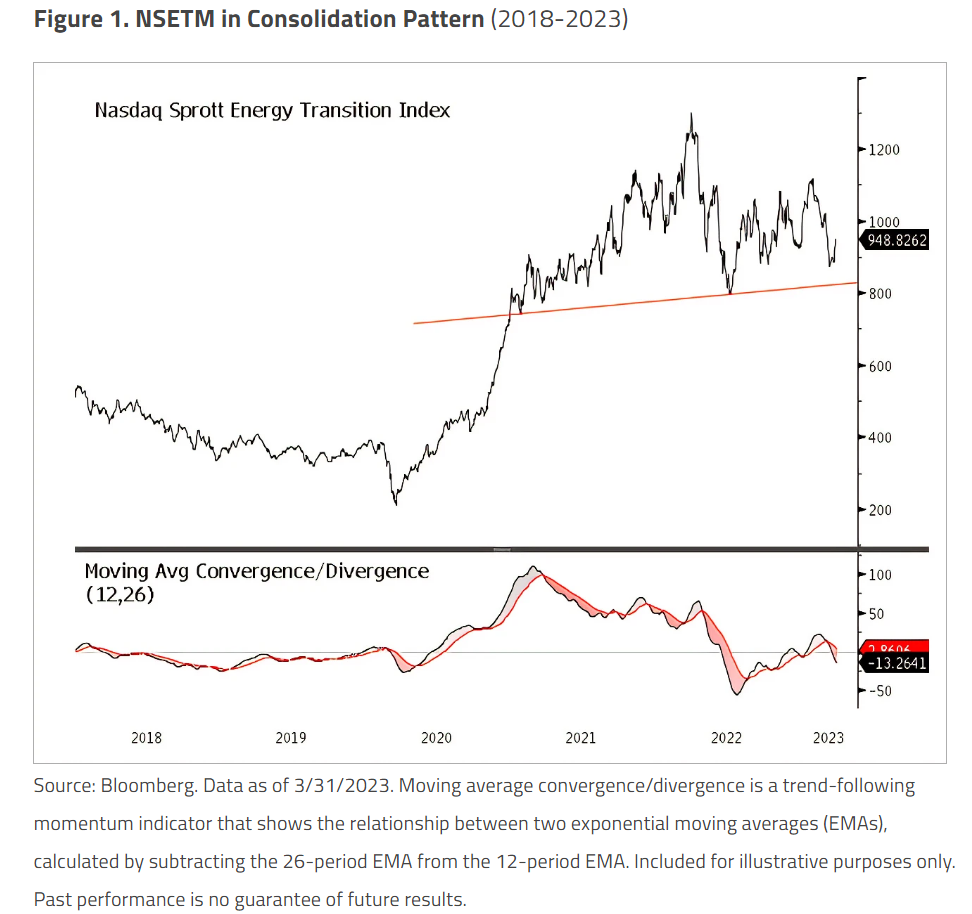
The Nasdaq Sprott Energy Transition Materials Index (NSETM) fell 4.47% in March, led by rare earth materials and lithium.
Amid the Fed's fight against inflation, the sudden collapse of Silicon Valley Bank and the emergency buyout of Credit Suisse surprised the market.
Bond yields fell as markets began to price in potential Fed rate cuts, given the possibility of a financial crisis or economic recession.
Only a month ago, the major concern was that the U.S. economy was too hot and the Fed would be forced to act hawkishly — perhaps with 50-basis-point (0.50%) rate hikes and a terminal Fed Funds rate of 5.7%. In less than a week, the banking crisis forced the bond market to price in the end of the Fed’s rate-hike cycle. The market is discounting significant rate cuts by year-end based on an expected economic slowdown and further financial system stress. Among other things, the resulting flight from bank deposits into money market funds will likely lead to lower credit availability and slower global growth.
Commodities and non-precious U.S. metal resource stocks fell due to fears of a global slowdown and recession.
Credit stress and tighter collateral requirements often lead to the sale of commodities for financial reasons because commodities are often pledged as collateral.
Market conditions improved by the end of March as the Fed announced a new facility — the bank term funding program (BTFP17) — and the reopening of USD swap lines with five other central banks to lower yields and, more importantly, the U.S. dollar, helping to offset growth fears.
By late March, commodities and most mining-related equities had started to recover.
The NSETM Index remains rangebound in a choppy consolidation pattern, holding on to its outsized gains from the recent lows (see Figure 1).
The Evolving Macro Landscape in Critical Minerals
For decades following World War II, virtually all significant metals and minerals were available in a generally free and fair global market system.
Globalization led to international orderliness and stability, helped foster economic growth and advancement, and enabled the use of critical minerals (which were previously challenging to obtain) in most products.
The main competition at the time came from market access or payment for resources, and capital-rich governments and corporations (i.e., the West) had the best access.
However, over the past decade, China has made considerable progress in locking up a significant amount of critical resources through its “hyper-finance model,” Belt and Road Initiative (BRI), and other strategic partnerships and alliances.
Capital alone is not likely to guarantee unfettered access to critical materials as deglobalization accelerates.
As the post-war global order unwinds and deglobalization accelerates, capital alone is not likely to guarantee unfettered access to critical minerals.
While the U.S. will likely retain full access to Western Hemisphere resources through its economic and military might, many countries may lose access.
Interregional competition will likely lead to unstable availability of commodity resources and economic/price volatility.
In addition, resource nationalism may increase as countries attempt to retain and secure their share of critical minerals.
China: Hyper-Finance and the Long Reach of Belt and Road
China's hyper-finance model refers to the country's economic development approach characterized by a high degree of state-driven, debt-fueled growth.
This model has existed since the early 2000s, enabling China to rapidly become the world's second-largest economy.
The downside risks of this model include its impact on the stability of China’s debt and financial system, as well as the resulting rise in geopolitical tensions.
Key features of China’s hyper-finance model include:
State-Led Investment: The Chinese government has played a central role in investing in strategic industries and infrastructure projects, leading to rapid growth in real estate, construction and heavy industry sectors.
High Debt Levels: China has relied heavily on debt to drive growth, with government, corporate and shadow banking systems taking on large amounts of debt.
China's debt-to-GDP ratio has risen significantly in recent years and reached over 300% as of December 2021, raising concerns about the sustainability of China's debt levels and the potential for a global financial crisis.
Overseas Investment: Through its Belt and Road Initiative (BRI), China has become a significant investor overseas in recent years, particularly in developing countries in Asia, the Middle East and Africa.
This activity has raised concerns about China's influence and economic leverage in foreign countries.
The BRI is a massive infrastructure development and investment project China launched in 2013.
It has been described as the largest infrastructure project in history, with an estimated cost of over $1 trillion.
The BRI aims to improve economic connectivity and promote trade and investment between China and more than 100 countries in Asia, Europe, Africa and the Middle East.
The "Belt" describes the development of infrastructure and trade corridors across Central Asia, the Middle East and Europe.
The "Road" refers to the construction of ports, railways and other infrastructure projects in South Asia, Southeast Asia and Africa.
EV Carmakers: Back to the Future
EV carmakers are seemingly moving back to a more vertically integrated process to gain greater control and ownership of their supply chains.
A century ago, some carmakers directly owned and operated downstream manufacturing and mining operations to ensure the consistent supply and quality of materials.
Vertical integration fell out of favor in the globalization era when manufacturing components were outsourced to countries based on the lowest production cost, not security of supply.
Today, EV carmakers are returning, at least partially, to vertical integration practices to hedge against supply bottlenecks (production risk) and price volatility (margin risk).
The carmakers have signaled the strategic need to lock up reliable long-term supplies of essential materials for EV battery production as they commit massive amounts of future capital.
Currently, EV carmakers view mining capacity as the main bottleneck for raw materials.
However, long-term fixed-price contracts for any metals (let alone strategic metals) are rare.
This is because miners generally wouldn’t be willing to lock in potentially below-market prices for any extended time period, but they will accept capital investments.
Therefore, carmakers have been investing directly in mines.
EV carmakers are returning to vertical integration practices to hedge against supply bottlenecks and price volatility.
Carmakers’ biggest competition when seeking vertical integration isn’t other carmakers, it is China.
Not only is China far ahead of any EV carmaker in its geographic reach, financial capacity and technical abilities, but it is also at least a decade ahead in securing critical metals.
Since becoming the dominant consumer of global commodity resources, China has aggressively locked in supplies of virtually every necessary commodity for its industrial security.
It has sought to ensure industrial outcomes by securing necessary inputs. We see this pattern repeating across the globe.
China achieved this goal with its hyper-finance model and its BRI, locking up many downstream commodities and building out midstream capacity (e.g., smelting, refining and processing).
Having secured these assets, China and its state-owned enterprises would likely never sell any part of its operations to a Western EV carmaker.
China’s overall aim is to further increase global dependencies on China's dominant critical mineral supply chains.
As a result of its aggressive procurement of critical minerals, China currently dominates the battery materials market.
Chinese companies CATL (Contemporary Amperex Technology Co. Limited) and BYD Co. Ltd. together control half of the global EV battery market.
EV carmakers are in a near-existential quest to secure battery materials.
Ensuring long-term, reliable, stable prices for supply chains is a necessary condition for triumphing in the global EV battle, and this battle has only just begun.
Don’t Bet Against the West
Although China has a considerable head start in the critical minerals race, its position is far from unassailable.
The West has several unmatched strengths to support its efforts to ensure critical mineral supply in an increasingly competitive global marketplace.
These include:
Capital Access: The West’s highly developed financial capital markets can provide access to significant amounts of capital to invest in resource projects.
Western companies and investors have a strong track record in managing and allocating capital, which can help to mitigate risk in resource investments.
Extraction Technology and Expertise: The West is particularly advantaged in using innovative technologies to extract, process and manage resources and provide environmental remediation.
Western countries also have a long history of expertise in resource exploration, extraction and management, particularly in the mining and energy sectors.
Management Experience: Western companies and governments have extensive experience negotiating with host governments, managing complex supply chains and addressing environmental and social concerns related to resource development.
We are still in the very early days of the West leveraging its strengths in the battle to secure critical minerals.
However, capital spending is increasing rapidly, especially with governments now supporting legislation — for example, the Inflation Reduction Act and Infrastructure Investment and Jobs Act in the United States and the Critical Raw Materials Act in Europe.
S-Curve Makes Commodity Prices More Volatile
The sigmoid curve or “S-curve” describes a typical growth trajectory over time: Growth begins slowly, picks up speed during a period of rapid growth, then tapers off as growth slows.
The S-curve can be helpful in framing the adoption rate of new commodities and technologies.
For example, the initial adoption rate of EVs was slow due to concerns over range, charging infrastructure and high costs (the early phase of the S-curve).
However, with advancements in battery technology, declining costs and subsidies, the adoption rate of EVs has been multiplying in recent years (the acceleration phase of the S-curve).
Critical minerals usage is in the early acceleration phase of the S-curve.
During this acceleration phase, commodity pricing patterns could experience significant volatility due to increasing demand, limited supply, higher prices, more competition for resources, technological innovation, government policies and more.
The last decade of globalization coincided with a period of commodity oversupply, which minimized physical flows and over-emphasized financial macroeconomic price relationships.
Along with the typical S-curve price effects, we anticipate that other important factors will affect critical minerals pricing over the next several years.
As deglobalization ramps up, global economies are expected to become more regionalized and fragmented.
The early effects of this trend — such as protectionism, onshoring, redirected trade flows, geopolitical security rearrangements and resource nationalism — are present today and will affect all commodities, especially critical minerals.
Critical minerals pricing is primarily settled by negotiation (versus exchange pricing) and is mainly influenced by regional dynamics within the Chinese market.
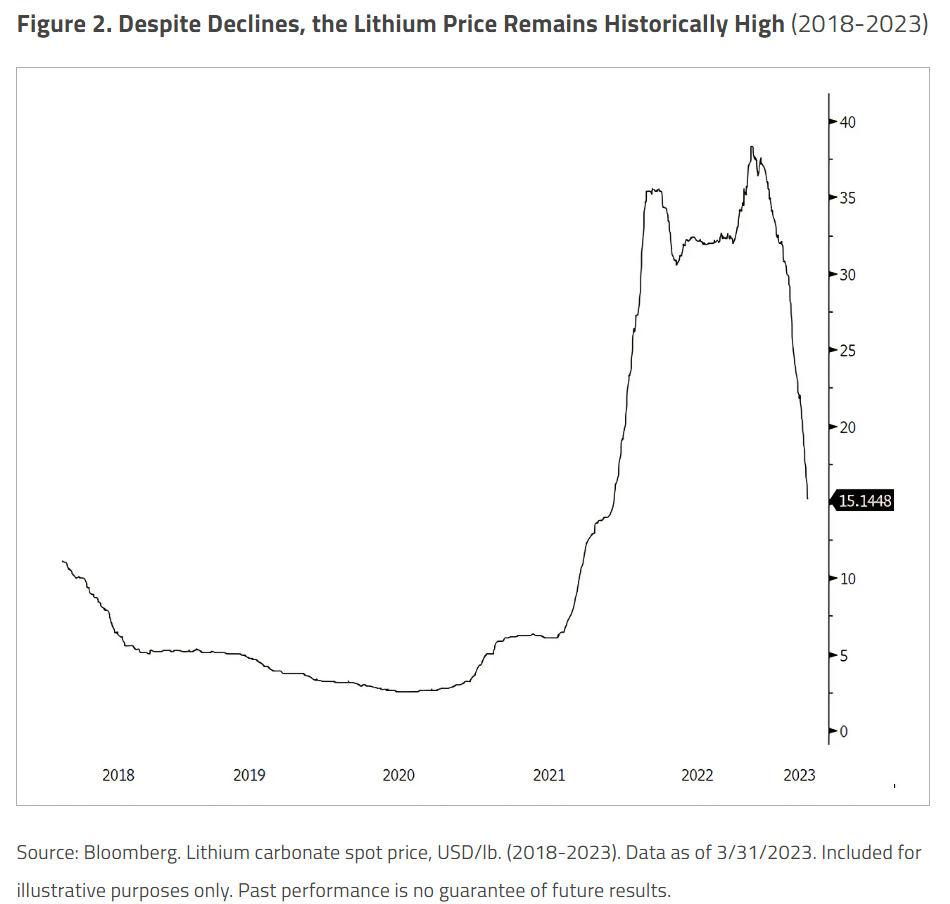
The lithium carbonate price chart (see Figure 2) is an excellent example.
As the use of critical minerals expands, pricing effects should become less regionalized, and exchange pricing will likely play a larger role.
Recently commodity markets have been heavily affected by physical flows, which are typically dominated by the East (China), compared to investment flows, where the West dominates.
The last decade of globalization also coincided with a period of commodity oversupply, which minimized supply disruptions (physical flows) and over-emphasized financial macroeconomic price relationships.
In the West, ESG (environmental, social and governance) concerns limited investment in carbon-intensive sectors, resulting in lower reinvestment ratios.
The net result is constrained growth in resource commodity production in the West, leaving the East and its physical flows to dominate prices.
Updates on Critical Materials
Lithium: Price Plummets Further
The lithium carbonate spot price continued to plummet from unsustainable highs, falling 37.46% in March.
However, the price of lithium is still extremely elevated over historical levels, having risen 408.88% (or more than five times) in the past three years (see Figure 2).
With the EV revolution growing exponentially in recent years, lithium supply has struggled to meet demand and, as a result, the price has skyrocketed.
As discussed in last month's commentary (“Has the Next Commodities Supercycle Begun?”), recent weakness in EV sales due to subsidy reductions and expectations of increases in 2023 lithium supply have caused prices to spiral downward.
To many, these price declines weren’t surprising.
Prices remain well above lithium miners' cost curves, and miner valuations have been factoring in a moderation of prices.
In March, Scotiabank estimated that lithium mining stocks have been trading at valuations that reflect even lower prices (approximately $6‒$10 per pound).
Lithium miner stocks fell 4.55% in March, in line with the 4.47% decline for energy transition materials miners overall.
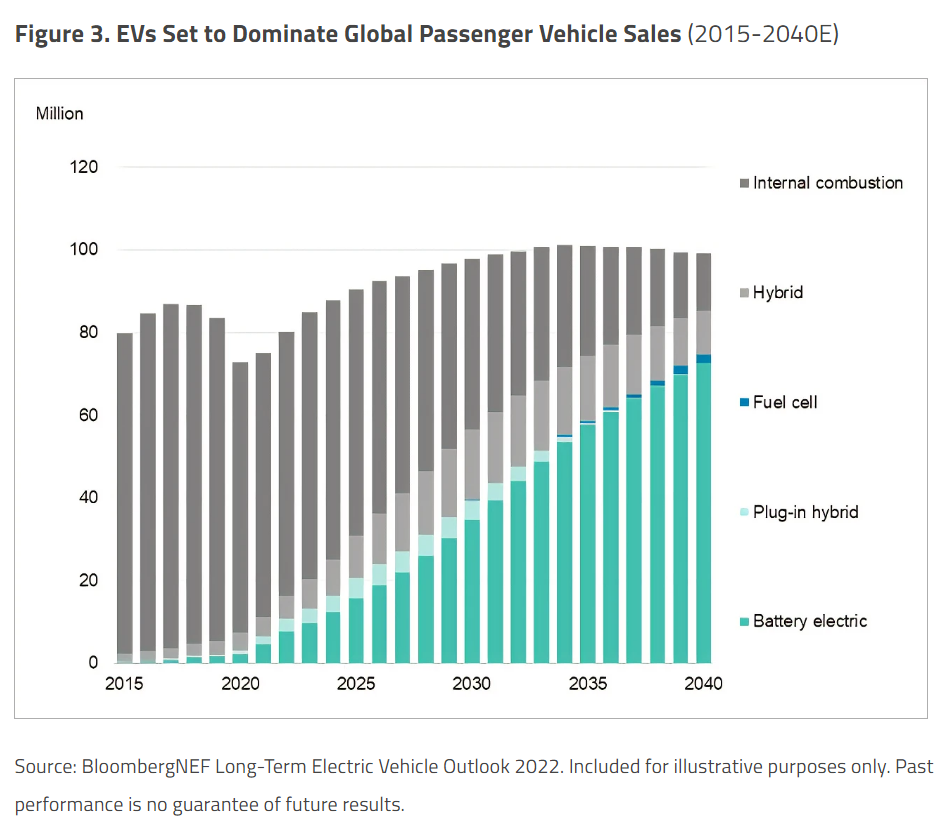
Longer term, the lithium outlook appears very positive and lithium demand — primarily spurred by EVs — will likely outpace supply again.
As shown in Figure 3, the future growth forecast for EV sales, and consequently lithium, is potentially enormous.
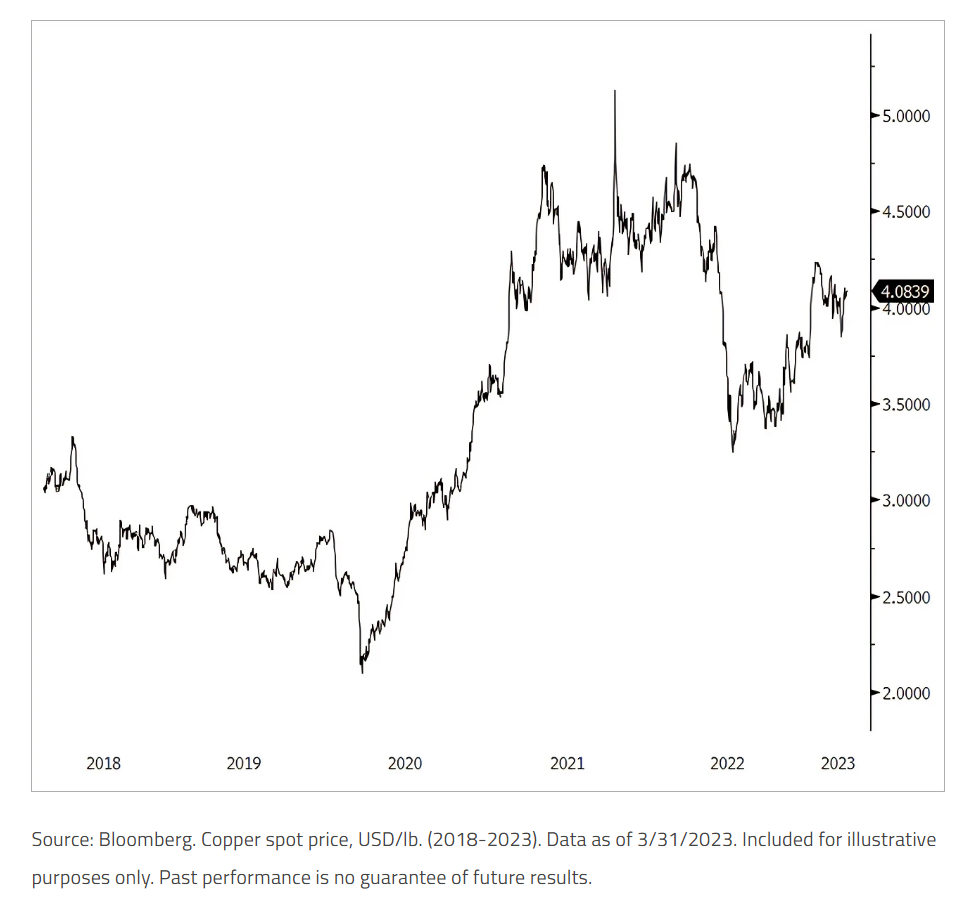
Copper: Macroeconomic Factors Pull on Prices
The copper spot price fell 5.25% in the first half of March, then rebounded to post a 0.59% gain for March overall.
Macroeconomic factors pulled on the price in varying ways.
The banking crisis stirred fears of economic recession, but this effect was countered as markets also repriced bond yields in expectation of the end of the rate-hike cycle.
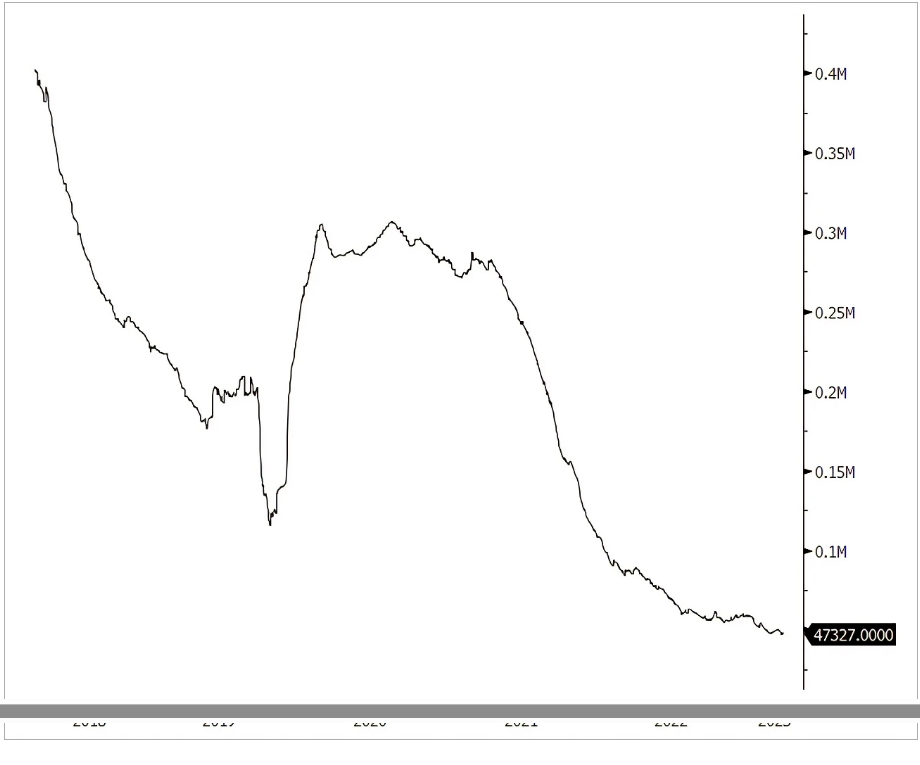
Global inventories of copper, such as those held in warehouses by exchanges and those held by industrial users, represent a meaningful measure of the global copper market.
The stock of copper held by exchanges is publicly available and is generally used to indicate the tightness of the copper market.
Globally, exchange copper inventories mainly reflect stocks held by the Shanghai Futures Exchange (SHFE), the London Metal Exchange (LME) and the Commodity Exchange (COMEX).
Figure 4 shows the total exchange copper inventories for the past five years.
Notably, these inventories fell 35% in March, due primarily to a drop in inventories at the SHFE, which signals an increase in copper demand from China, the largest consumer of copper worldwide.
This was part of a longer-term trend of declining inventories.
With copper inventories at historically low levels, a sudden surge in demand has the potential to cause copper prices to spike.
Figure 5. Copper Breaks Even in March (2018-2023)
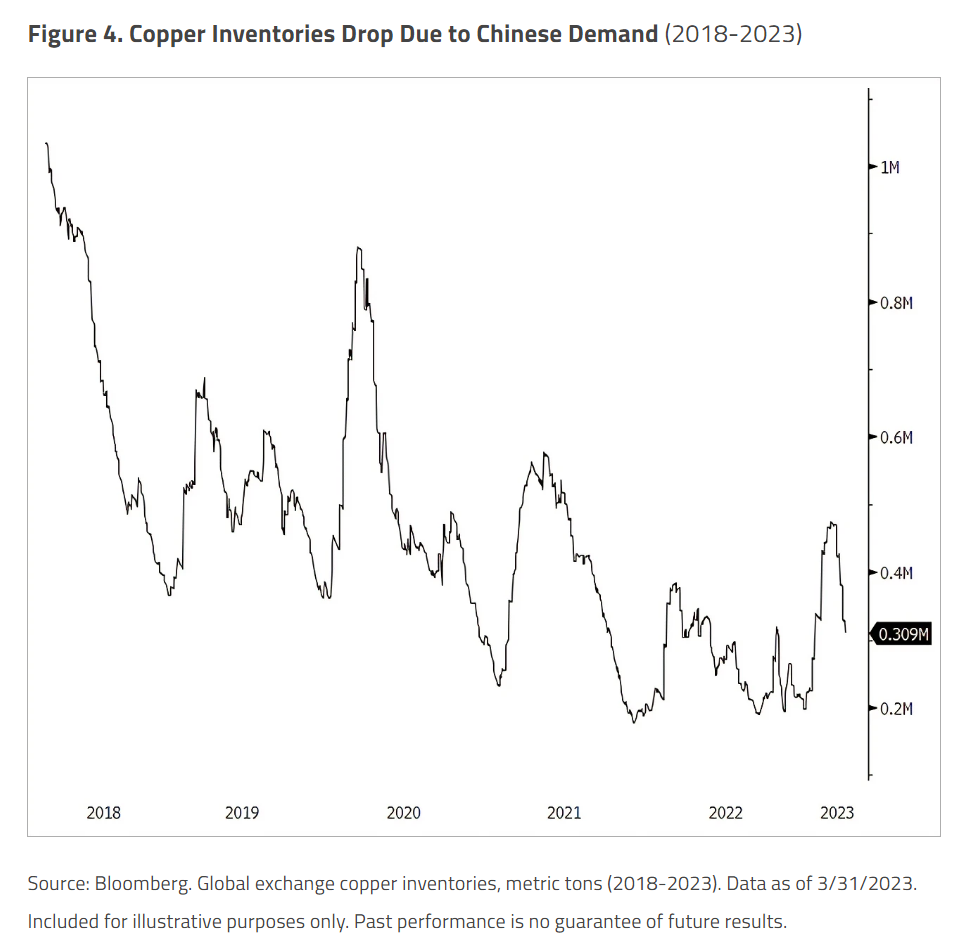
Figure 5. Copper Breaks Even in March
Nickel: Prices Fall, Then Rebound
The nickel spot price fell 3.82% in March, although it remained above historical levels (see Figure 6).
The demand for nickel from stainless steel producers lends cyclicality to the price of nickel.
Like copper, nickel first fell during March (based on elevated recession fears) and then rebounded (based on reduced expectations of future rate hikes).
Nickel also has been hurt by short-term weakness in EV sales.
However, as with lithium, demand from the EV sector is in the early innings and may outpace future supply.
In recent years, growing nickel demand, primarily from EVs, has reduced nickel exchange inventories.
Figure 7 charts nickel inventories at the SHFE and, to a greater extent, the LME.
The data indicate that both exchanges had very low inventories in March.
In the LME’s case, there were secondary reasons for the low stocks.
In February 2022, nickel prices rose as investors speculated that Russia’s invasion of Ukraine would remove Russian nickel supply from the market.
During this price rise, a Chinese stainless steel and nickel giant, Tsingshan Holding Group, tried to cover a short position in nickel.
This resulted in a short squeeze, which caused the nickel price to skyrocket, as shown in Figure 6.
The LME made a controversial decision to unwind trades made that day, and many arbitragers left the market.
The LME’s Asian nickel trading hours remained closed until March 27, 2023, resulting in lower volumes in the market.
Low liquidity dynamics suggest the nickel price may remain volatile.
In the long term, nickel demand is expected to grow significantly due to its use in NMC cathodes (nickel, manganese and cobalt oxides that are used in lithium-ion batteries).
Nickel-intensive cathodes are gaining traction because adding nickel to batteries provides greater energy density and increases EV vehicle driving range.
As global demand for EVs grows, nickel supply is unlikely to keep up with demand, even as additional supply comes online from Indonesia.
A major factor in this supply-demand imbalance is that Russia is a significant nickel producer, including the Class 1 nickel needed for lithium-ion batteries, and is likely to remain under economic sanctions for quite some time.
Figure 6. Nickel Declines on Short-Term EV Weakness (2018-2023)
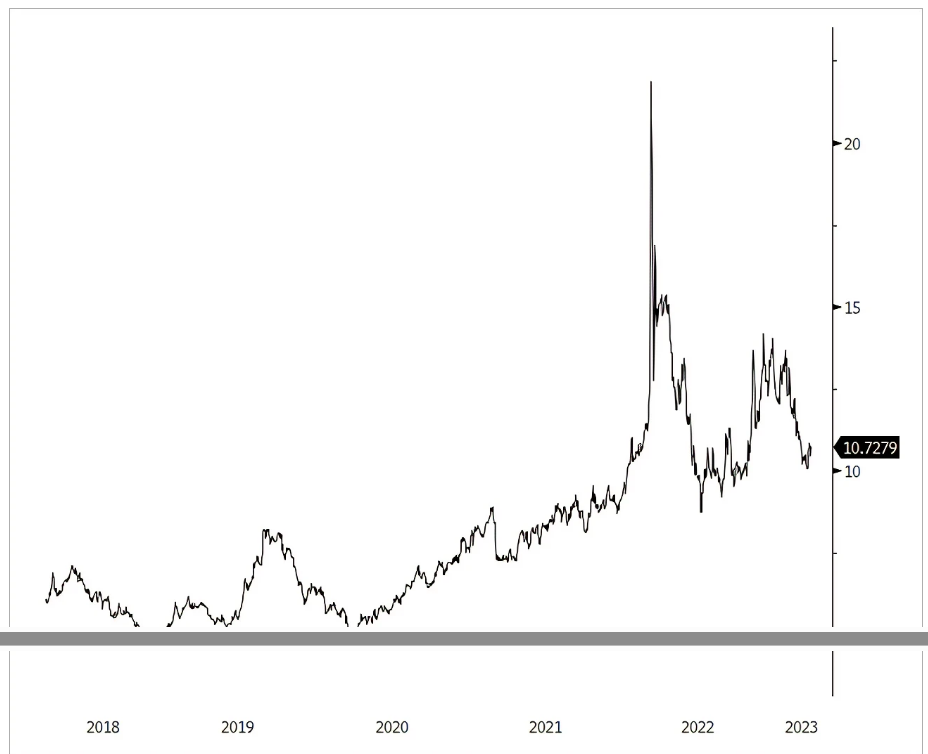
Figure 7. Low Nickel Inventories Suggest Price Volatility Ahead (2018-2023)
- 1 The Nasdaq Sprott Energy Transition Materials™ Index (NSETM™) is designed to track the performance of a selection of global securities in the energy transition materials industry, and was co-developed by Nasdaq® and Sprott Asset Management LP.
- 2 The Nasdaq Sprott Lithium Miners™ Index (NSLITP™) is designed to track the performance of a selection of global securities in the lithium industry, including lithium producers, developers and explorers; the Index was co-developed by Nasdaq® and Sprott Asset Management LP.
- 3 The North Shore Global Uranium Mining Index (URNMX) is designed to track the performance of companies that devote at least 50% of their assets to the uranium mining industry, which may include mining, exploration, development and production of uranium, or holding physical uranium, owning uranium royalties or engaging in other non-mining activities that support the uranium mining industry.
- 4 The Solactive Global Copper Miners Index includes international companies active in exploration, mining and/or refining of copper. The index includes a minimum of 20 and a maximum of 40 members. The calculation is done in USD as a total return index. Index adjustments are carried out semi-annually.
- 5 Nasdaq Sprott Nickel Miners™ Index (NSNIKL™) is designed to track the performance of a selection of global securities in the nickel industry.
- 6 Nasdaq Sprott Junior Copper Miners™ Index (NSCOPJ™) is designed to track the performance of mid-, small- and micro-cap companies in copper-mining related businesses.
- 7 Nasdaq Sprott Junior Uranium Miners™ Index (NSURNJ™) is designed to track the performance of mid-, small- and micro-cap companies in uranium-mining related businesses.
- 8 The lithium carbonate spot price is measured by the China Lithium Carbonate 99.5% DEL. Source: Bloomberg and Asian Metal Inc. Ticker L4CNMJGO AMTL Index. Data converted to pounds and to USD with Bloomberg FX Rates.
- 9 The U3O8 uranium spot price is measured by a proprietary composite of U3O8 spot prices from UxC, S&P Platts and Numerco.
- 10 The copper spot price is measured by the LME Copper Cash ($). Source: Bloomberg ticker LMCADY. Data converted to pounds.
- 11 The nickel spot price is measured by the LME Nickel Cash ($). Source: Bloomberg ticker LMNIDY. Data converted to pounds.
- 12 The S&P 500 or Standard & Poor's 500 Total Return Index is a market-capitalization-weighted index of the 500 largest U.S. publicly traded companies.
- 13 The U.S. Dollar Index (USDX, DXY) is an index of the value of the U.S. dollar relative to a basket of foreign currencies.
- 14 The Bloomberg Commodity Index (BCOM) is a broadly diversified commodity price index that tracks prices of futures contracts on physical commodities, and is designed to minimize concentration in any one commodity or sector. It currently has 23 commodity futures in six sectors.
- 15 The S&P Metals & Mining Select Industry Index comprises stocks in the S&P Total Market Index that are classified in the GICS metals & mining sub-industry.
- 16 The sigmoid curve or “S-curve” describes a typical growth trajectory over time: Growth begins slowly, picks up speed during a period of rapid growth, then tapers off as growth slows.
- 17 The BTFP offers loans of up to one year in length to banks, savings associations, credit unions, and other eligible depository institutions pledging any collateral eligible for purchase by the Federal Reserve Banks in open market operations.
0 comments:
Publicar un comentario