Andrew Hecht
Summary
- Silver stops below $30, drops, and consolidates.
- The breakout to the upside was a significant event.
- The ratio is heading for the long-term average.
- Silver speculation should increase above $30.
- I believe that a new all-time high is on the horizon for silver- SILJ should outperform the metal on a percentage basis on the upside.
To say it has been a wild ride in the silver market in 2020 would be an understatement. The precious metal with a reputation and nickname as “gold’s sibling,” started the year at just under $18 per ounce. The risk-off conditions in March sent the price to the lowest level since 2009 when it hit bottom at $11.74.
After falling to an eleven-year low, silver came storming back, and four short months later, it rose above its critical technical resistance level at the July 2016 high of $21.095. Silver broke out to the upside and rose to its highest level since February 2013. The eleven-year low led to a seven-year high in 21 weeks. Aside from breaking through technical resistance, silver took the leadership role in the precious metals arena from gold. Silver tends to attract lots of speculative interest when the price starts trending higher or lower. Silver offers trend-followers, speculators, and investors lots of price action and has a history of enormous percentage moves.
The bullish price action in the silver market is likely to continue. A falling dollar and record levels of government and central bank stimulus and liquidity are rocket fuel for the metal. After trading in a consolidation range between $13.60 to $21.10 per ounce for six years from 2014 through 2020, silver broke to the downside before reversing and breaking to the upside over the past months.
The ETFMG Prime Junior Silver Miners ETF product (SILJ) has the potential to outperform the wild action in the silver market on the upside over the coming months and years.
Silver stops below $30, drops, and consolidates
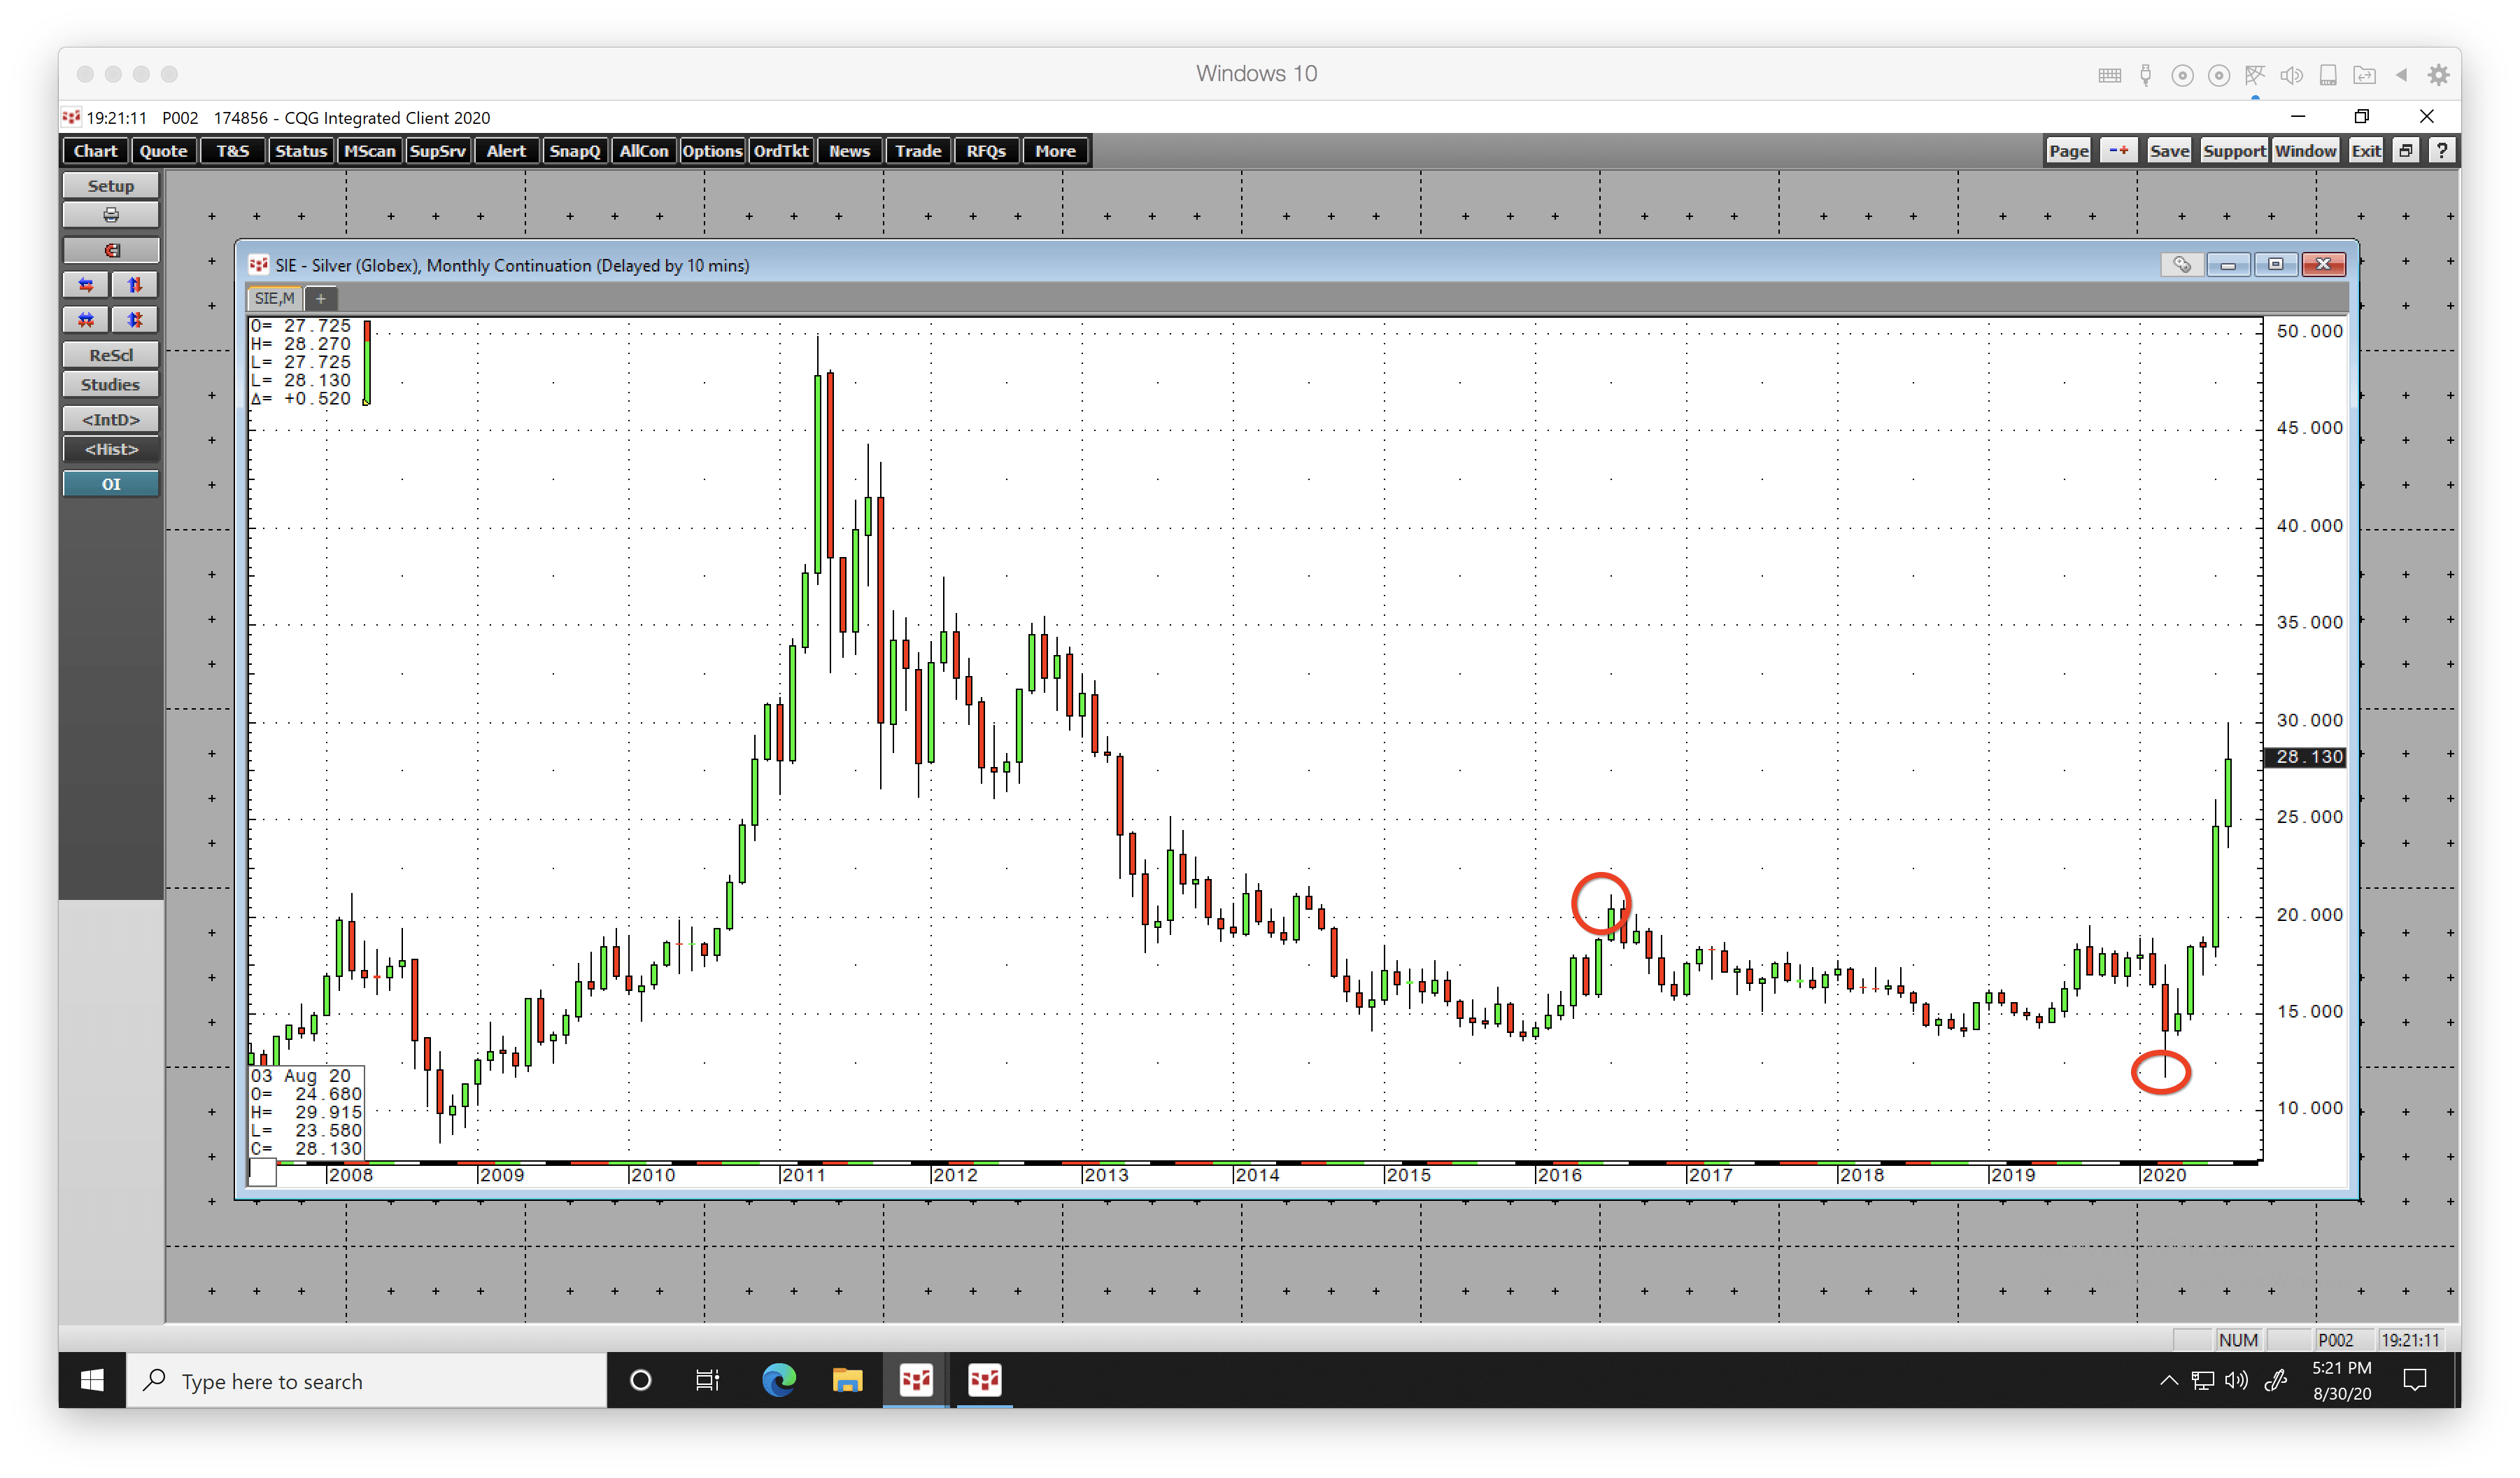
The nearby COMEX silver futures contract rose from $11.74 in mid-March to a high of $29.915 during the first week of August or an incredible 154.8% in under five months.
Source: CQG
The weekly chart highlights the rise of the silver price and its correction to $23.58 on August 12. The price rebounded to just over the $28 level at the start of this week. Silver has been consolidating near the recent peak. Since early August, the total number of open long and short positions declined from 207,470 to 168,618 contracts.
Falling open interest as the price declines is not typically a technical validation of an emerging bearish trend in a futures market. Price momentum and relative strength indicators declined from overbought conditions in early August.
Both metrics were above neutral readings as of August 28. Weekly historical volatility fell from almost 100% in mid-August to below 38% at the end of last week as the weekly trading ranges narrowed as silver consolidates.
The breakout to the upside was a significant event
Gold broke above its long-term technical resistance level at the July 2016 high of $1377.50 in June 2019. It took silver one year and one month longer, as it broke through its July 2016 high at $21.095 in July 2020.
Source: CQG
The monthly chart illustrates silver’s decline to the lowest price since 2009, its rise to the highest level since 2013, and five months of a steady rally. The next significant technical resistance level on the monthly chart stands at the October 2012 high of $35.445.
Above there, $37.48, the February 2012 peak, $44.275, the high from August 2011, and $49.82, the 2011 apex stand as upside targets.
The ultimate goal is the 1980 all-time high at $50.36 per ounce. Silver’s break to the upside launched a bull market in the precious metal that has been playing catch up with gold.
The ratio is heading for the long-term average
The silver-gold ratio is a measure of the number of ounces of silver value in each ounce of gold value.
In March, when silver fell to an eleven-year low, the ratio rose to the modern-day high.
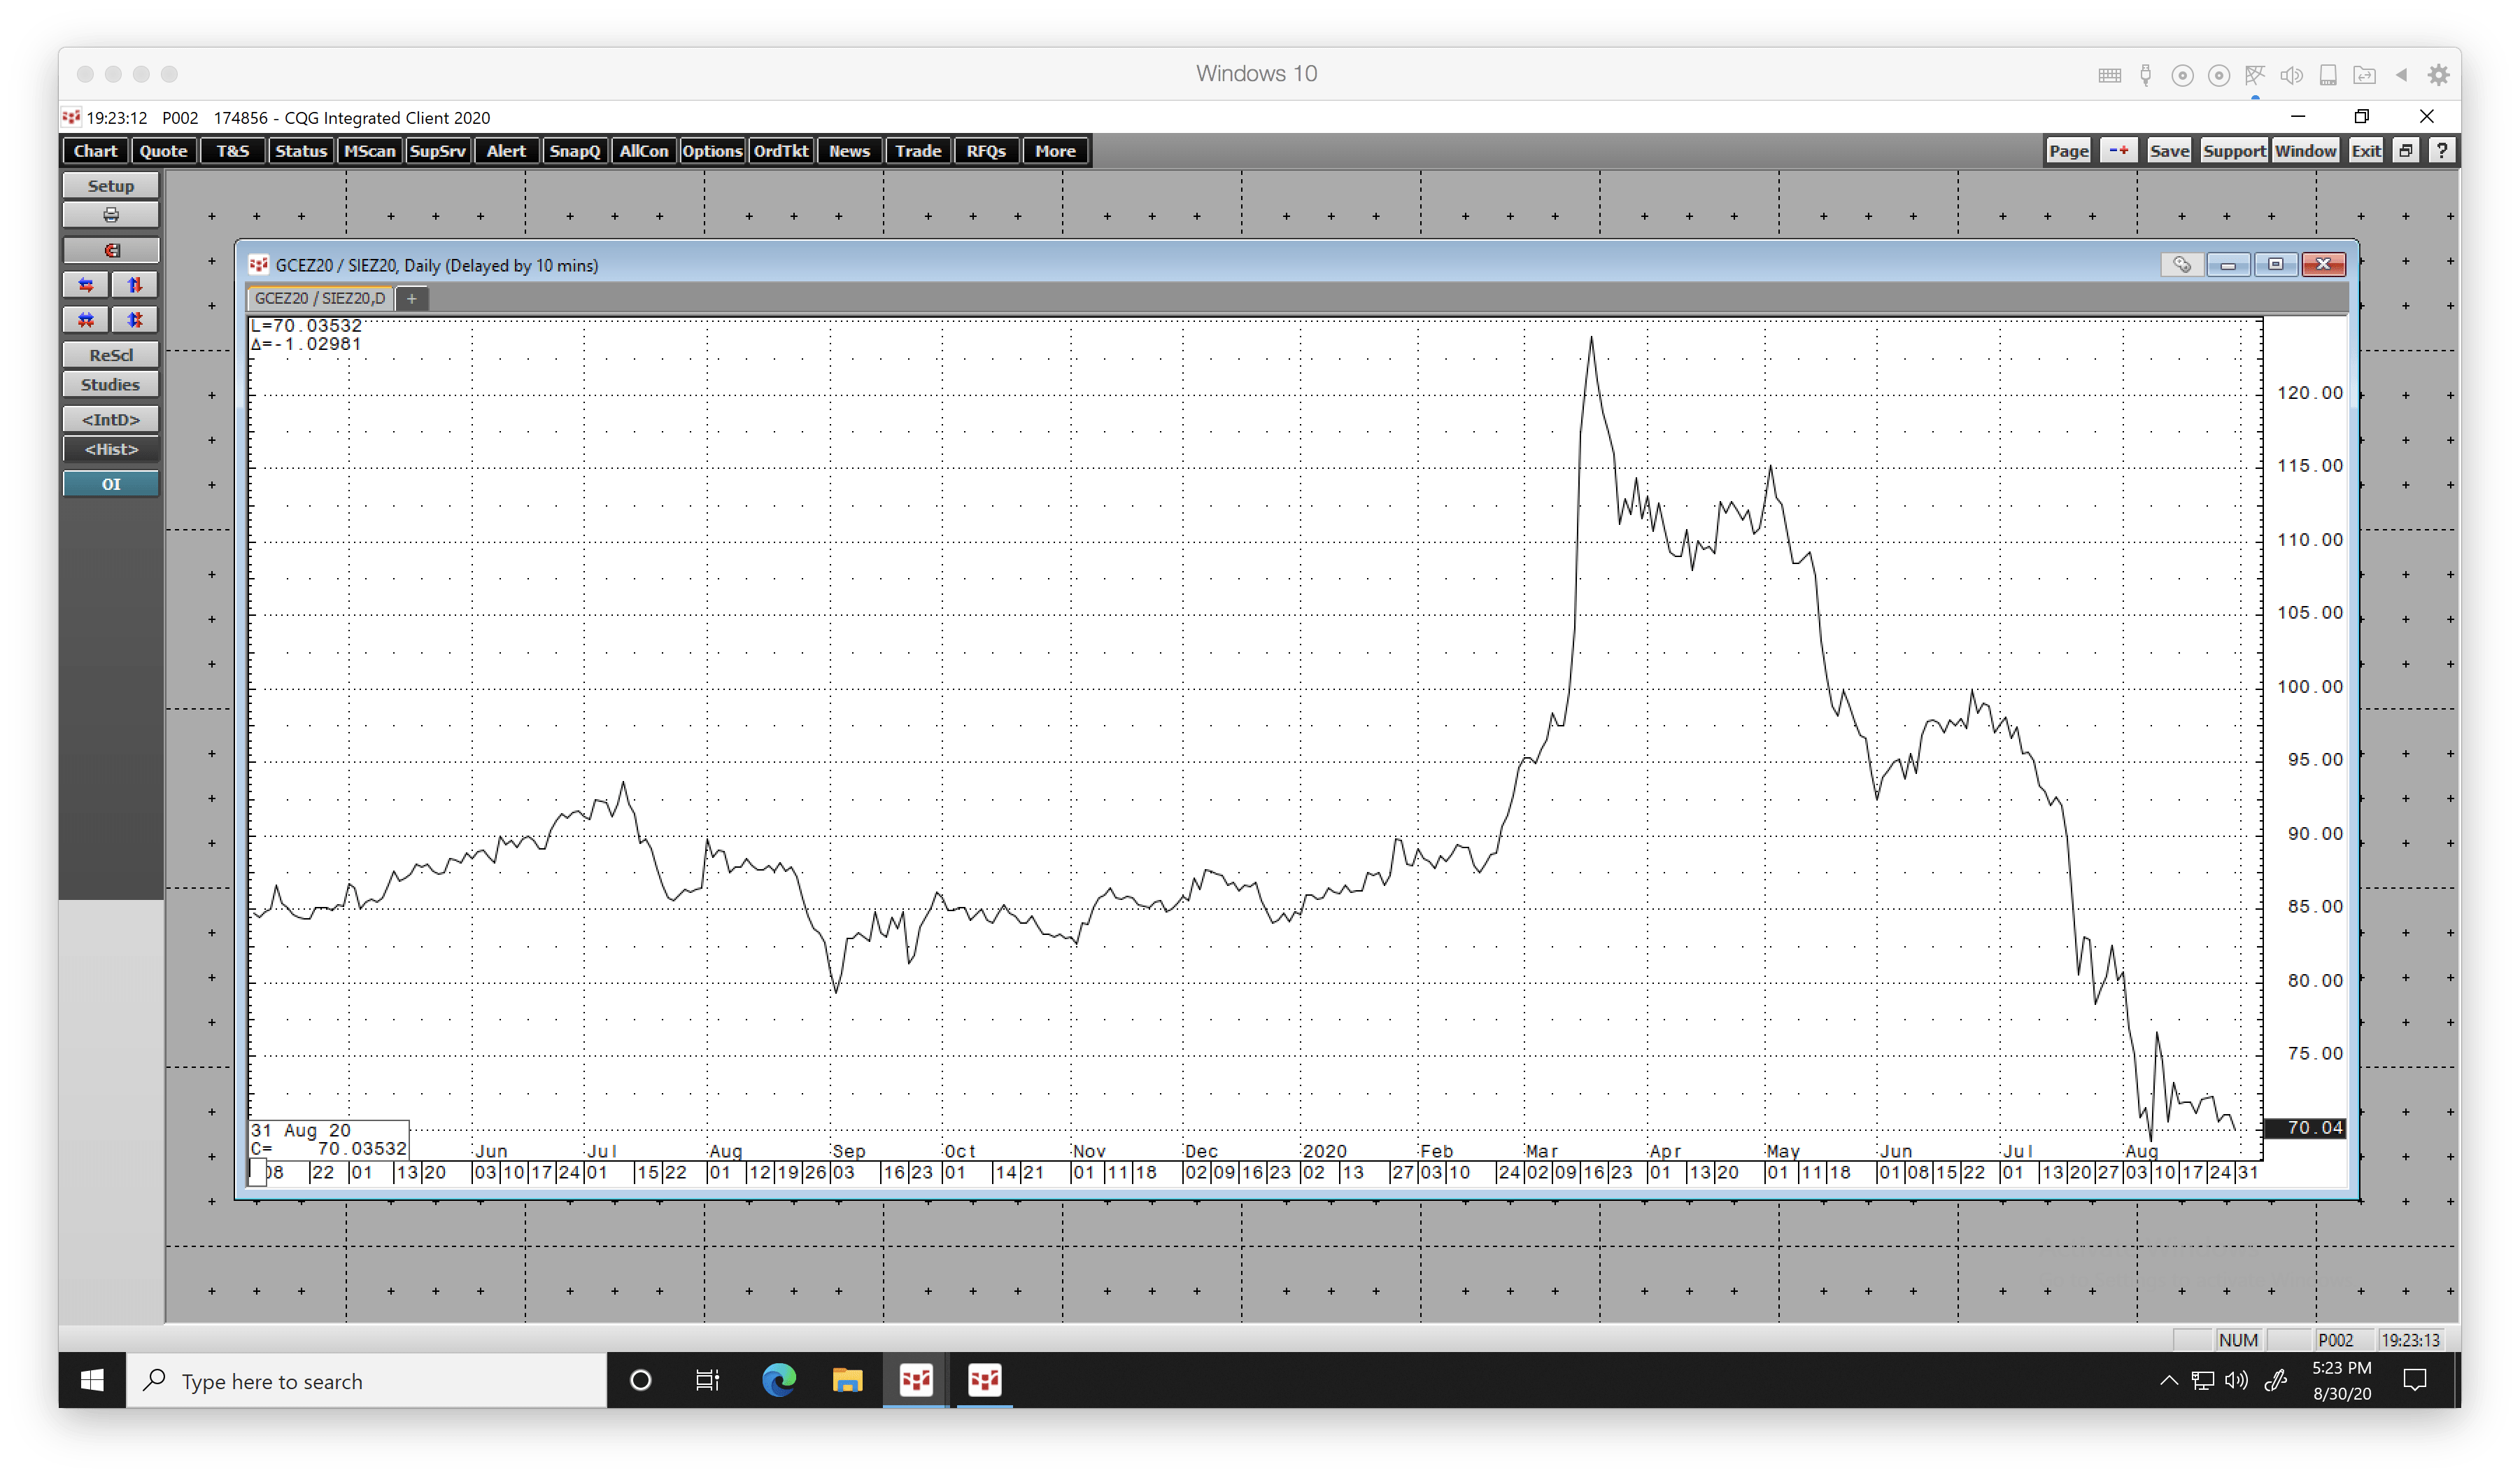 Source: CQG
The daily chart of December gold divided by December silver futures shows that the ratio rose to a high of just below 124:1 on March 18.
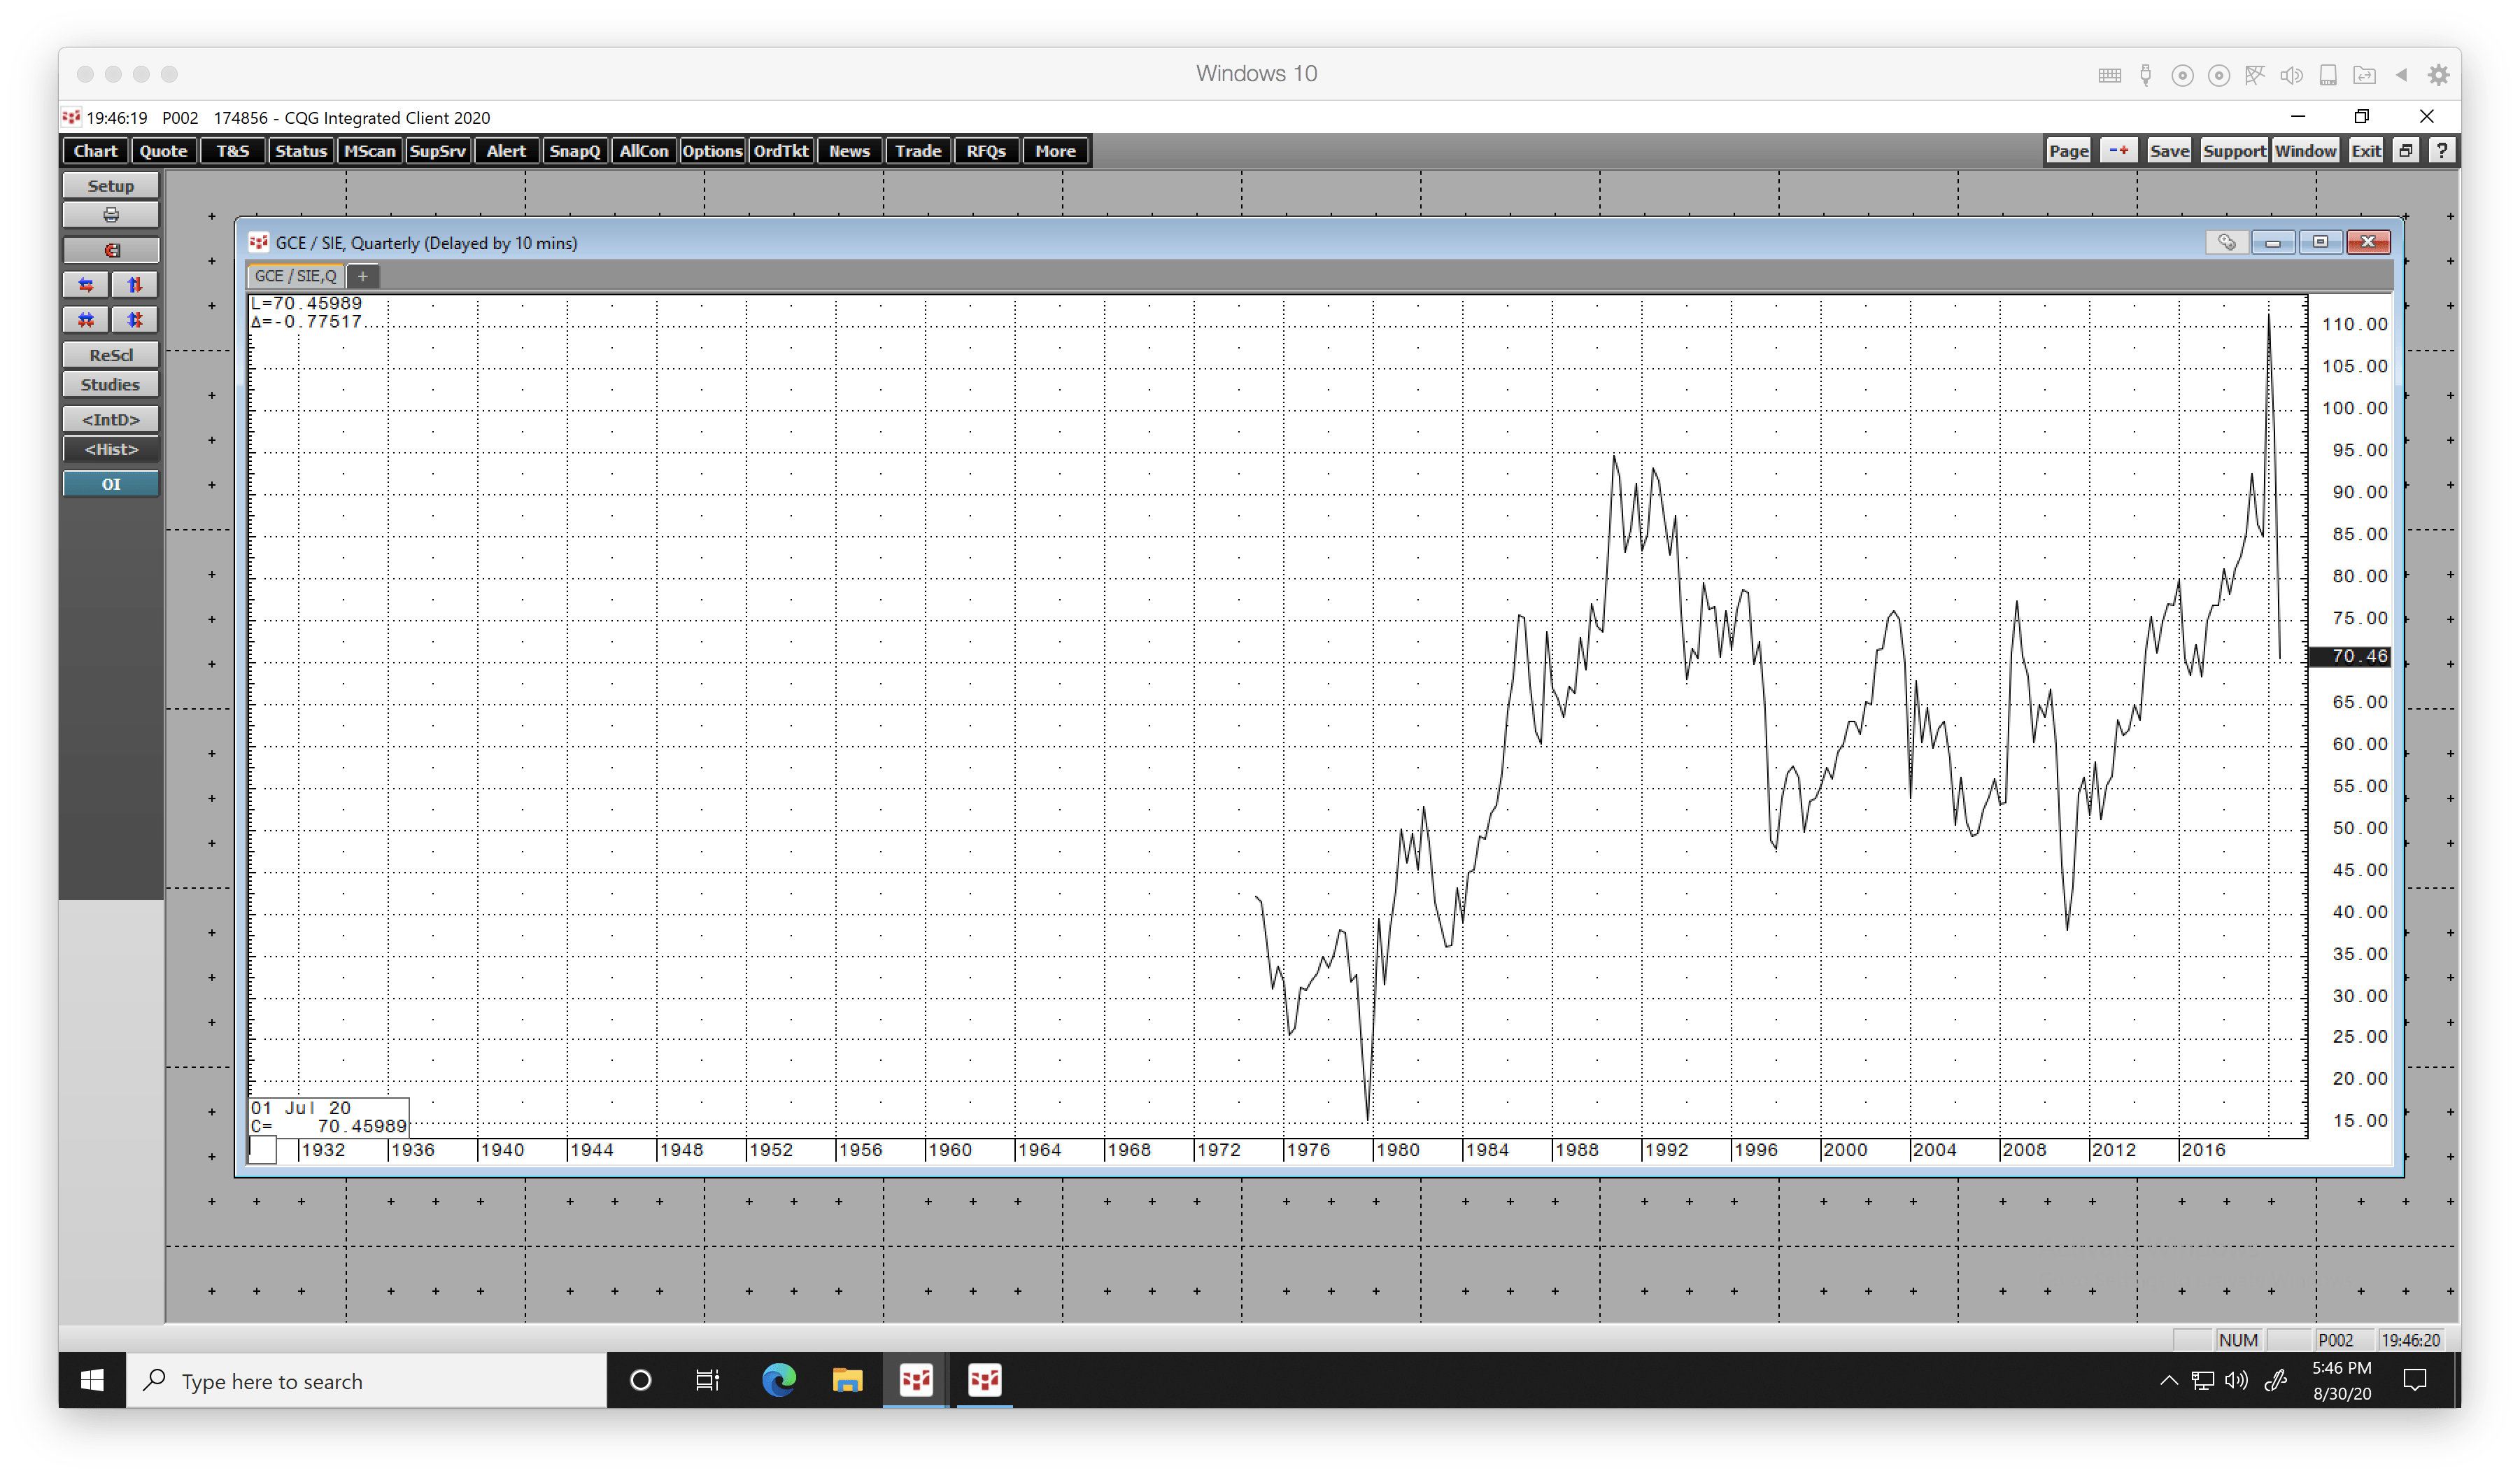
Source: CQG
The quarterly chart, that did not capture the peak in the relationship, shows that the previous record high was at 94.6:1 in 1990.
Over the past almost half-century, the average level of the ratio is just below the 70:1 level, considering the recent move to a new peak.
At the end of last week, the ratio was at the average level as silver’s rally caused it to catch up with the gold market.
Silver speculation should increase above $30
There is nothing like a bull market trend when it comes to attracting market participants to an asset. Speculators, trend-followers, and investors look for markets that offer significant percentage moves after a break to the up or the downside.
Another leg to the upside that takes the price of the continuous futures contract above $30 for the first time since early 2013 would confirm the bullish trend, causing increased interest in the silver market.
Silver and gold have a lot more than bullish price trends going for them these days. A declining dollar is bullish for the prices of precious metals. Unprecedented levels of central bank liquidity and government stimulus that is increasing deficits are highly inflationary.
Last week, Fed Chairman Jerome Powell told the world the US central bank is prepared to tolerate higher inflation levels. The current economic environment in the US and worldwide is highly supportive of rising precious metal prices.
A new all-time high is on the horizon for silver- SILJ should outperform the metal on a percentage basis on the upside
When the gold and silver markets are rallying, silver’s attraction for speculators causes far greater price volatility. As the variance in the ratio in 2020 highlights, silver tends to outperform gold on the upside and underperform on the downside on a percentage basis.
In both metals, mining shares tend to magnify the price movement in the gold and silver market.
Junior mining stocks can be even more volatile than the shares of established producers. The ETFMG Prime Junior Silver Miners ETF product (SILJ) has the potential to act as a leveraged instrument if the price of silver is heading higher and breaks above the $30 per ounce level.
The fund summary and top holdings of SILJ include:
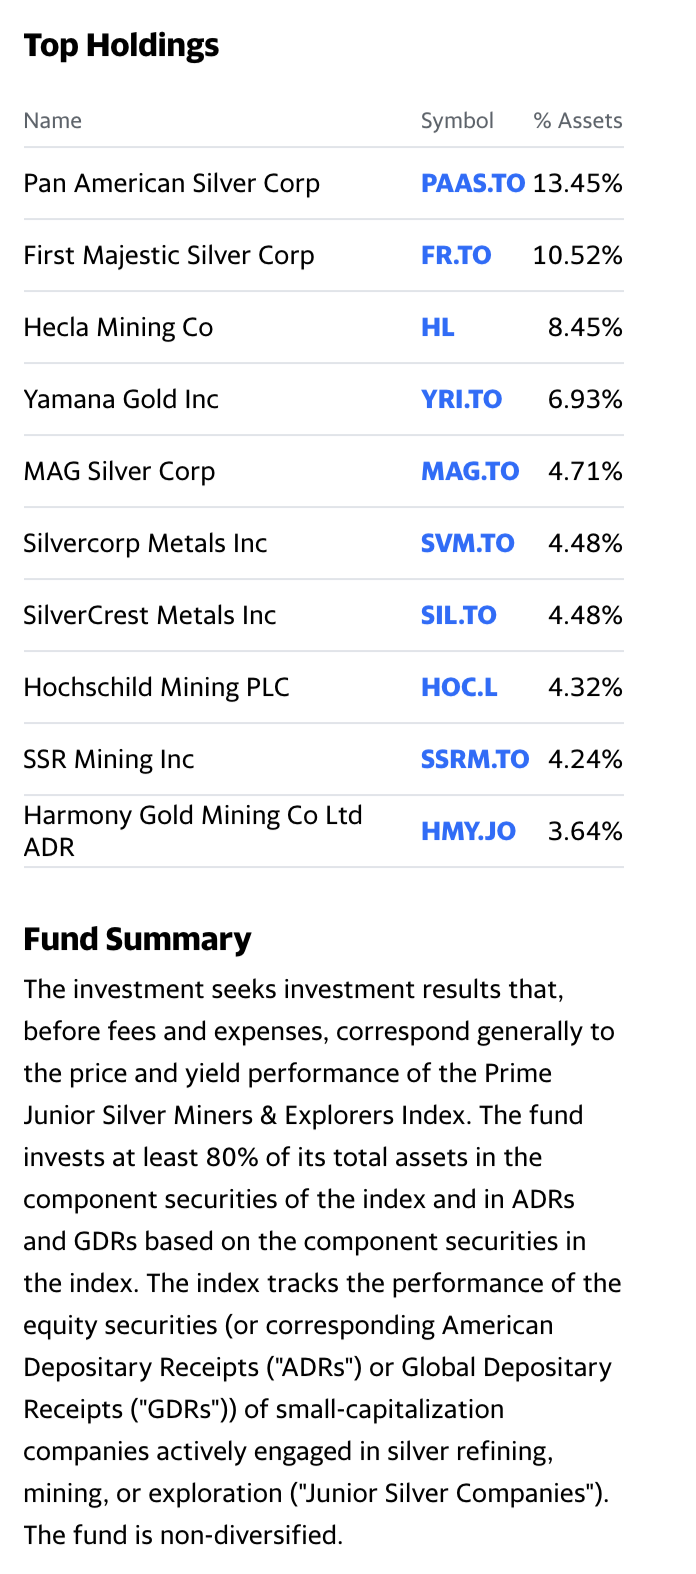
Source: Yahoo Finance
SILJ holds the leading junior silver mining companies.
The ETF has $259.01 million in net assets, trades an average of over 1.7 million shares each day, and charges a 0.69% expense ratio. Silver rose from $11.74 in March to a high of $29.915 or 154.8%.
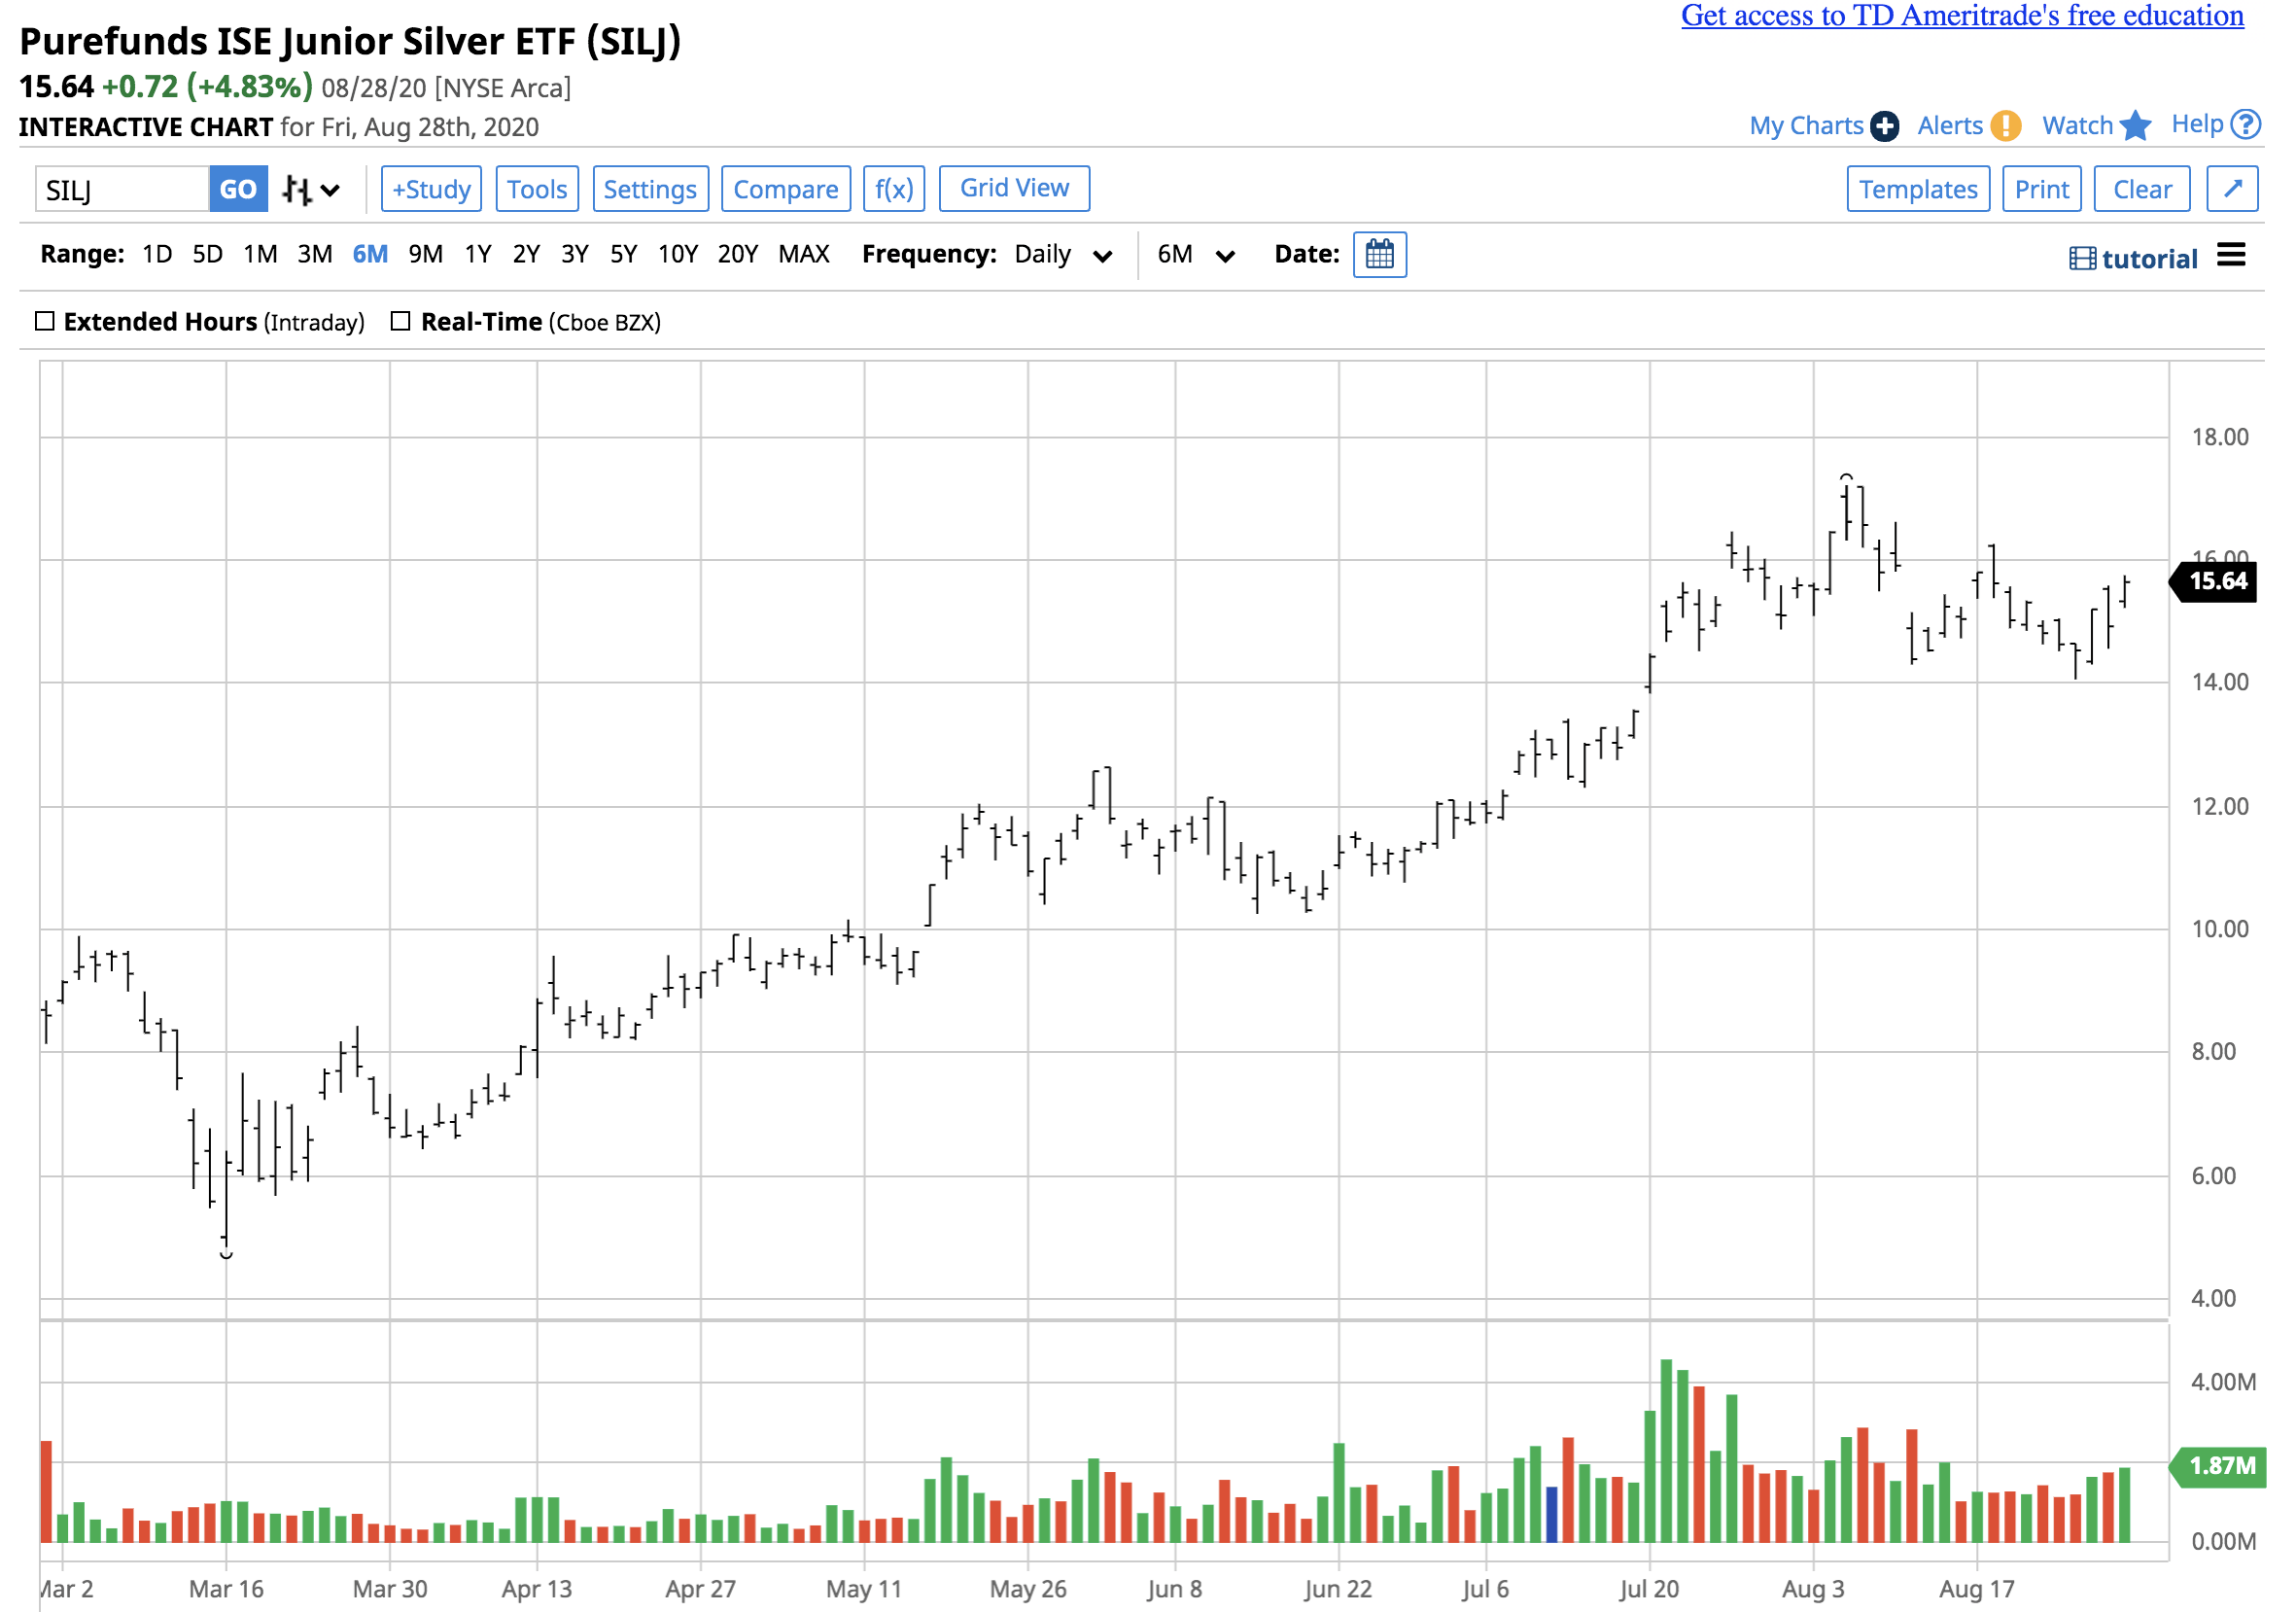
Source: Barchart
Over the same period, SILJ rose from $4.84 to $17.21 per share or 255.6% as the junior mining ETF provided a leveraged return compared to the volatile silver futures market.
The current environment creates an almost perfect bullish storm for gold and silver.
After the current consolidation period ends, we could see prices move substantially higher. A challenge of the 1980 high could be on the horizon over the coming months.
0 comments:
Publicar un comentario