3 Reasons Why This Gold Correction Could Be The Last Below $2,000
AustrolibDeliveries of September spot gold have intensified during gold's correction, October deliveries begin September 29 with over 60,000 contracts open, and Registered Comex gold supplies are falling.
A second round of lockdowns will crimp the supply of real goods and services and spur the next round of central bank money printing.
A no-deal Brexit looks imminent with the passage of the UK Internal Market Bill that overrides the Brexit agreement regarding Northern Ireland.
Coupled with a second UK lockdown already in force, some weak bank is going to fall and trigger the next global banking crisis.
Gold will continue to fall initially until the next round of money printing begins, at which point it should break through $2,000 for the last time. This could be the last opportunity to buy sound money at these prices.
Back in March 2008, six months before the lid was blown off the financial crisis, gold breached the $1,000 level for the first time. The developing banking crisis and deflationary panic brought it down by 34% by October, and from there it took another year before gold crossed the $1,000 threshold for the very last time.
We got close to testing that zone at gold bear market bottom in late 2015 at $1,045, but it is now nearly universally conceded that, barring a gold standard and massive deflation of the money supply, gold will never again go below $1,000 an ounce.
Gold has been in a correction since hitting a high of $2,090 in early August, but since monetary developments are moving much faster now than they were back then, I doubt it is going to be another year before it re-crosses the $2,000 barrier for the last time. Judging from political, economic, and monetary developments, gold could easily say good bye to the $1,000s for good before the end of this year.
I will lay out three reasons why this is likely, but first, take a look at this:
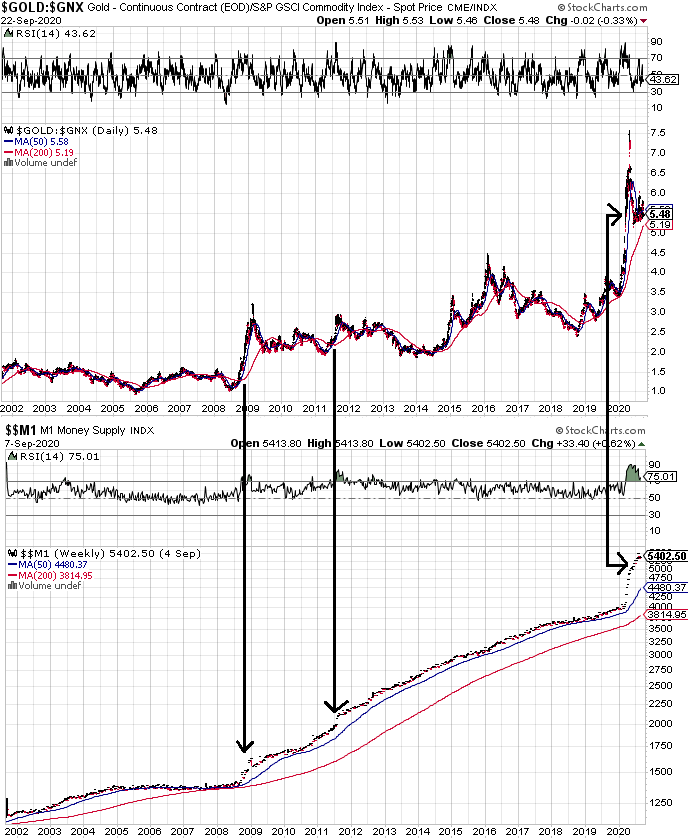
The top chart is the gold price relative to the S&P GSCI Commodity Index. The GSCI is weighted by daily production volumes, so plotting it against gold shows gold's per-ounce claim on the world's daily production of commodities, in other words gold's real-asset purchasing power.
What this chart shows is that in real terms, gold's bull market actually began in 2008 during the last financial crisis, not back in 2001.
It also shows that gold's 34% crash in 2008 was a total illusion. Same thing with gold's selloff last March, when gold's purchasing power in real terms actually doubled.
What was really happening during both these periods was that as all commodities were collapsing in deflationary panics, gold was falling much less, so its real purchasing power was rising strongly.
You could say that the dollar's purchasing power was also rising during these times, and that is true, but only ephemerally so, and the answer as to why is simple.
Deflationary panics like these are always coupled with a major burst of money printing, which is the bottom chart in the M1 money supply.
This inevitably brings the dollar's purchasing power back down, but it brings gold's even higher.
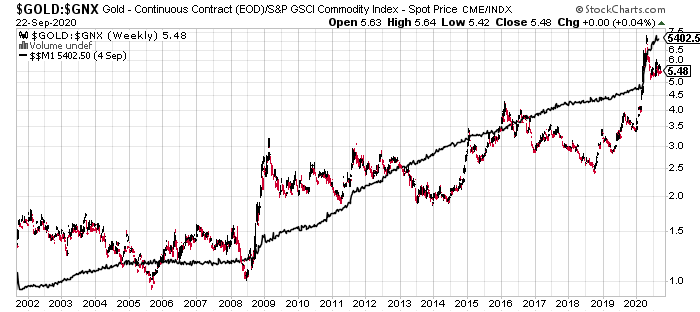
The result is that while gold has significantly increased in purchasing power against real assets since 2008, the dollar's purchasing power has fallen. You can see the correlation more clearly here, with the gold:GSCI ratio plotted directly against the M1 money supply:
Here's the same index in dollar terms since bottoming in February 2009:
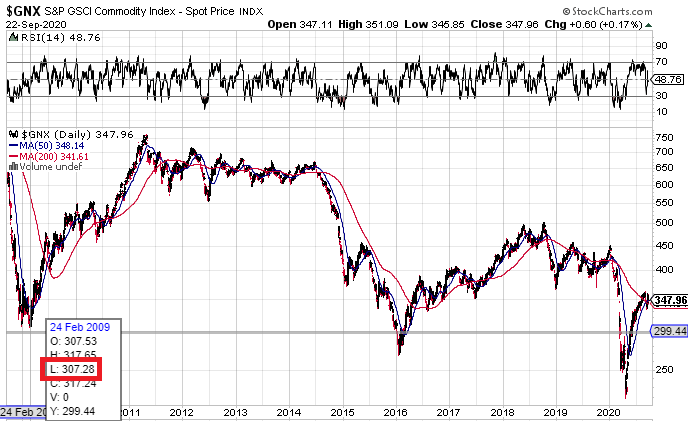
The dollar has still lost 13% (307 to 348) of its purchasing power in these terms, while gold has gained almost exactly 100% in the same timeframe.
With this in mind-and yes we will circle back here to hammer the point home-here is why the next time gold crosses $2,000, it could easily be the last time.
#1 Strong Deliveries, Meager Contract Rollover, And Gold Moving Off Comex
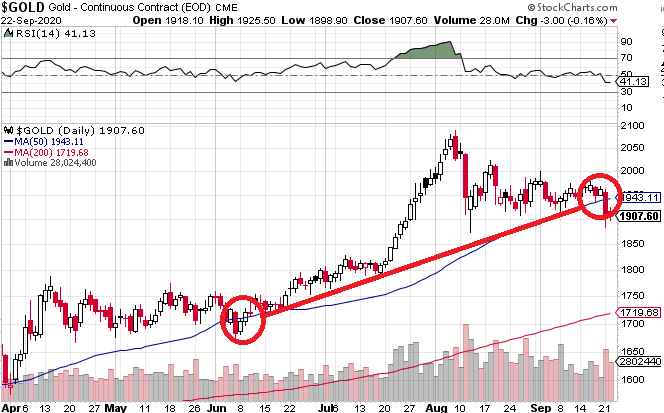
The September spot gold contract expires on September 29, three trading days from time of writing. As I detailed in a previous article on this contract, there have been buyers opening new contracts every single day since deliveries began, and calling for delivery on those spot contracts. Since spot cannot be rolled over into a futures contract, spot buyers can either call for delivery or cash settle. There is no other alternative. On September 21, the gold price breached its 50 day moving average for the first time since June, confirming a downtrend was in play.
Since then gold has sold off hard, and yet September deliveries have kept coming.
The day gold broke the 50DMA, 326 September spot gold contracts were bought (276 net change in September open interest despite 50 delivery closings = 326 net increase):
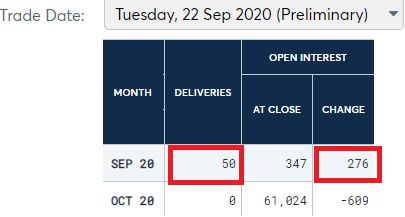
The screenshot above says September 22, but the data is on a one day lag, as you'll see from the delivery report below. The next day, 298 of those 326 contracts stood for delivery, the highest daily total since September 2 and the third highest for the month:
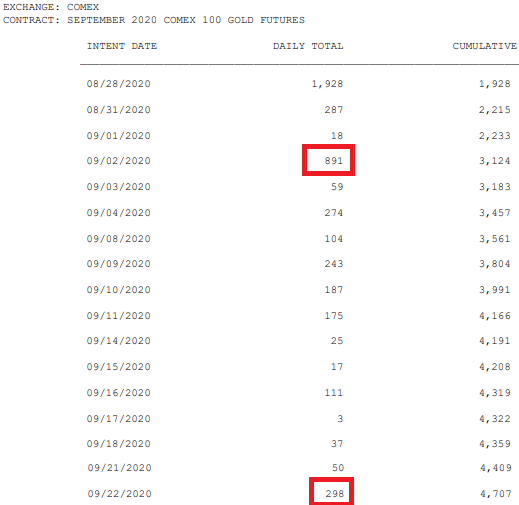
The fact that deliveries spiked specifically on a downtrend confirmation suggests that there are eager buyers using the discount in order to acquire physical gold.
I say this not simply because of the delivery numbers themselves, since deliveries only mean an exchange of warrants, and not necessarily the removal of gold from the Comex vaults physically.
In this case though, there is evidence that this gold is in the process of being physically moved out, or at the very least taken off the sale registry and hoarded.
The Comex delivery notice page uploads new registry data daily. The problem is there is no archive available so in order to track trends, the Excel files need to be downloaded and archived each day.
The earliest I have for September is for the 9th, and registered gold stocks on that day were 16,188,264.934 troy ounces. The latest for September 23 has 15,752,126.236. The difference is 436,138.7, or 4,361 contracts worth. That's awfully close to the September total so far of 4,707, evidence that much of the gold being delivered this month will not return for sale to satisfy future contracts.
Eligible stocks have risen by the equivalent of 4,202 contracts over the same period, indicating former Registered stocks have been moved to Eligible. The rest has ostensibly been moved out of the vaults.
Adding weight to this is that the last day to roll over October gold is September 28, which means that at time of writing there are 3 trading days left to roll over before longs must either take delivery or cash settle.
Yet, there is little evidence that October gold longs are interested in rolling over to avoid delivery. The number of contracts open for October gold has fallen by only 3% since last week. See red boxes in the two screenshots below:
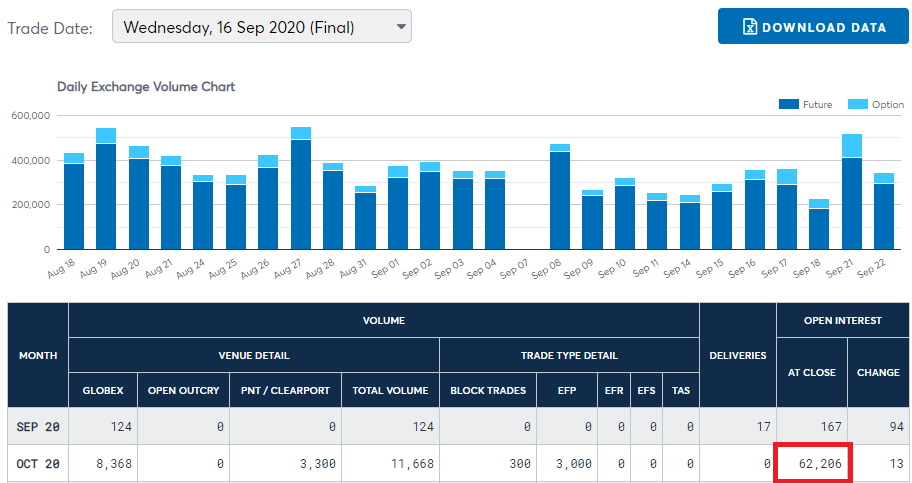
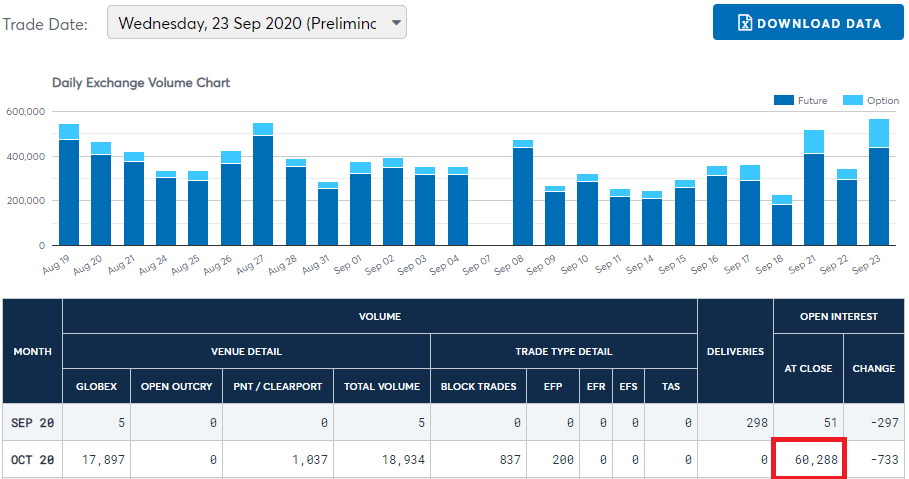
60,288 October gold contracts remain open as of September 23 versus 62,206 on September 16. Big deal, you could say. There are still 3 days left.
Yeah, we'll probably see some degree of rollover, except compare this with platinum, which has the same rollover deadline, and open interest has fallen by 54% over the same timeframe, from 36,442 to 16,791 contracts as of September 23 data.
If rollover is progressing so strongly in platinum, it should also be for gold but it clearly is not, indicating that many of these 60,288 contracts will probably end up standing for delivery as well. The all time record for one month is last June at 55,102.
It will be very interesting to see what happens with Registered Comex gold stocks once October deliveries begin.
#2 A Second Round of COVID-19 Lockdowns
Fundamentally, lockdowns are very bullish for gold because they diminish the supply of real goods and services and spur intense money printing from central banks at the same time. The United Kingdom is already under a resurgence of severe lockdown restrictions, and the European Union looks likely to follow soon, possibly within days. The March lockdown initially took down gold prices in dollar terms, though not in real terms as gold declined much less than all other commodities and the Gold:GSCI ratio reached new all time highs. The slingshot from there in dollar terms was one of the most powerful advances in the price of gold since January 1980. The next lockdown should have similar consequences for the gold price, first bringing it down strongly, followed by money printing, which could bring gold back over $2,000 permanently.
#3 A No-Deal Brexit Triggering a Global Systemic Bank Crisis
A no-deal Brexit looks only weeks away from becoming inevitable now.
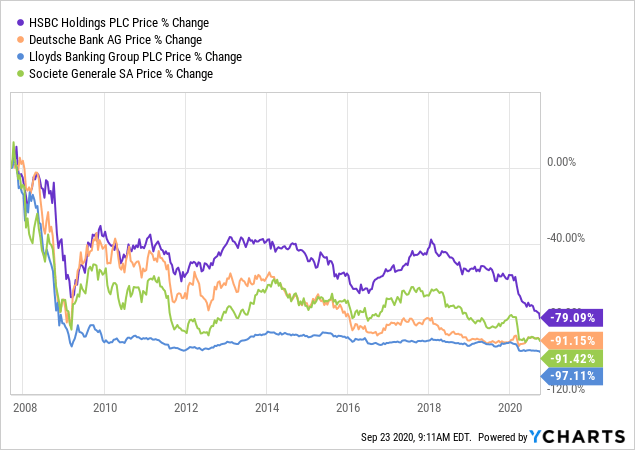
European bank stocks are already at multi-decade lows, and some are making new all-time lows. HSBC (HSBC), a global systemically important market-making gold bullion bank, broke through the $20 handle for the first time ever on September 18th, going well below its post 2008 financial crisis lows of $23.59, and HSBC is actually one of the better performing European bank stocks since 2007 (see chart below). Bloomberg reports that HSBC loyalists are losing faith in the stock now.
Lloyds (LYG), the largest domestically-focused UK bank, is in danger of breaking the $1 handle on the New York Stock Exchange and may get delisted as a result. French SocGen (OTCPK:SCGLY) is approaching its all time lows again and just announced that it is divesting its asset management arm.
Deutsche (DB) is closing in on its all time lows hit in May and just announced the impending closure of 20% of all its branches. I can't see what this signals other than the next financial crisis is imminent, or perhaps already starting.
The contentious UK Internal Market Bill, which would override portions of Brexit agreement dealing with Northern Ireland, has already passed through the British parliament easily and heads to the House of Lords next week for final approval.
I cannot see how, if a no-deal Brexit happens in conjunction with strict lockdowns in the UK suffocating the real economy, that at least one of these already extremely weak banks doesn't just keel over and start a domino effect that leads to mass bailouts, the next financial crisis and the next and perhaps final round of money-printing by central banks across the world.
Conclusion
In the short term, gold probably still has further to fall before it bottoms again, and silver, too. We've seen deflationary panics like this before, and I will be scaling in on panic days with available cash. How far exactly the metals complex will fall I can't say, but I would loosely guess gold won't get much lower than $1,700 before the next round of money-printing begins. This may be the final opportunity of our lifetimes to pick up some sound money at these dollar prices.
In real terms though, there will almost certainly be no decline in the price of sound money. Meaning versus production-weighted real assets, the GSCI Commodity Index, gold will likely skyrocket again as it did during the deflationary panics of 2008 and March 2020, because gold tends to fall much less in dollar terms than other commodities during these periods.
Meanwhile, the dollar price will inevitably catch up as it always does after the money supply skyrockets once again. For all these reasons, this ongoing correction in gold could be the final opportunity to buy below $2,000.
Once we cross that threshold a second time, we will likely never see anything below $2,000 gold again, and it will be off to the races.
0 comments:
Publicar un comentario