James Emanuel
Summary
- S&P 500 continues to outpace nearly every other stock index and asset class both domestic and international, but has it lost touch with reality?
- Passive funds have destroyed the efficiency of the markets.
- Central bankers have dug themselves into a hole so deep that there is no way out.
- Political manipulation has distorted the market with no tangible economic benefit.
- A perfect storm lays ahead caused by a rare combination of economic factors. We explore how investors can protect themselves against a major price correction.
The S&P 500 Pendulum Swings Too Far
In the face of adversity the S&P 500 (SPX) continues to hit new highs and to outpace the underlying growth of its constituent companies. So what? People are getting rich quickly; what’s the problem?
I’ll explain the problem in this article. It’s a huge problem, and you ought to be concerned. I will also explain the action that you might want to consider in order to mitigate the consequential risk.
Forget that the U.S. economy shrank by an annual rate of 32.9% between April and June, its sharpest contraction since the second world war. Forget that the official unemployment rate is 11%. Forget that over 200,000 people in the U.S. have died from COVID-19 and that 300,000 will be dead by December. The only news that seems to matter is that the stock market has hit another all-time high!
Really? What kind of world are we living in?
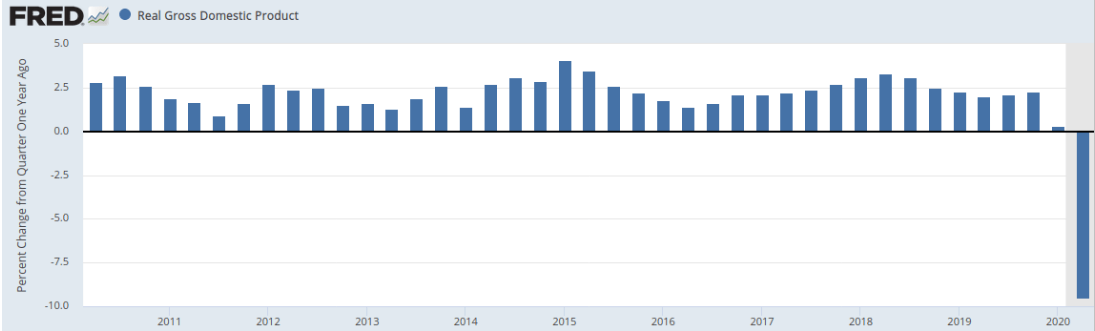
US GDP, Source: US Bureau of Economic Analysis
The S&P 500 is widely regarded as the best single gauge of large-cap U.S. equities. More than $11.2 trillion is indexed or bench-marked against the S&P 500. The index includes 500 leading companies and captures approximately 80% of available U.S. market capitalization. Therefore, it is quite representative of the entire stock market.
Intuitively, one would be forgiven for thinking that a stock market index and GDP should grow at a similar pace, but the S&P 500 is a price index in contrast to a total return index. Said differently, it does not include dividends, which explains why since 1871 the index has under-performed the overall economy. It also explains why it ought to always under-perform the economy. However, not only has the S&P500 recently been keeping up with the economy, in 2019 it outpaced it by a whopping 787%.
The index logged an increase of 31.5% in 2019. By comparison, the combined businesses that make up the index saw their revenues and profits climb by only 4% per share, less in dollar terms due to fewer shares outstanding at the year end because of buy-backs, but don't get me started on that subject! Using the logic that stock prices track earnings over time, this appears to be an unsustainable situation.
You may be thinking to yourself that 2019 was an extraordinary year and that the market will mean revert over the longer term, but you would be wrong. The index continues to nudge all time highs despite COVID-19 having created an economic recession so deep that we have not experienced anything on this scale since the great depression of 1929. More particularly, the pace of growth seems to be accelerating. In July 2020, the monthly return of the S&P 500 was 5.51%, which is 66% on an annualized basis. Even without the coronavirus-induced recession, this is historically excessive as becomes evident when you compare it to a monthly return of 1.31% a year earlier and against the long-term monthly average of 0.45%.
Does any right thinking individual honestly believe that 80% of listed US companies by market capitalization increased in value by 5.51% during the month of July having already increased in value by 31.5% during 2019? If this continues, investors will double their money every 18 months. On that basis, do you think that this is sustainable?
Price growing faster than value? Yes. Price well in excess of value. Yes, also.
In my decades of stock market investing, I have never experienced anything like this before. It is irrational beyond belief. It is almost as though the S&P 500 is operating in some form of parallel universe.
Corrections in markets are the mechanism by which irrational prices normalize. They happen periodically, and an investor needs to be prepared with risk mitigation hedges in place. There are a number of risk management strategies that you might like to consider - more on this later in the article.
The Fabulous Five and Tech Euphoria
May I remind you of the immortal words of the great Benjamin Graham when he said that even the best companies at the wrong price make for a poor investment. On that basis, I would argue that the S&P 500 is full of wonderful companies at the wrong price.
Despite nascent growth in profits for the index during 2019 prior to the pandemic, there was plenty of profit among the big tech businesses. However, even among the “Fabulous 5”, which is made up of Apple (AAPL), Microsoft (MSFT), Google (NASDAQ:GOOG) (NASDAQ:GOOGL), Amazon (AMZN) and Facebook (FB), not one of these companies was able to grow sales or profits by a rate matching the 31.5% appreciation in the index.
Against the backdrop of the Fabulous 5 being unable to grow profit at 31.5%, would it surprise you to learn that all five outperformed the index and grew in price by far more than 31.5%! The Fab 5 are great companies, no doubt, but good value at any price? I think not.
Let us consider the longer term contribution of the Fabulous Five companies to the performance of the S&P 500 index as a whole. In the decade to 10th February 2020, the sales of these five companies had grown from 1.9% to 7.9% of total sales generated by index constituents. At the same time, profits from this group of five grew from 6.5% to 14.1% of all profit generated by members of the index.
Based on this information, how would you price these five companies relative to the total value of the index? Are they worth 7.9% of the index value based on their top line revenue contribution, or perhaps 14.1% of the index value based on their earnings contribution? Surely, not more than 14.1%?
Would it surprise you to learn that they are priced at almost 25% of the entire value of the index? Five companies out of five hundred or 1% of constituents by number are priced at 25% of the value of the index! Can that be justified or has their price run ahead of their intrinsic value?
If we assume that they should not be priced at more than 14.1% of the value of the index, then at 25% of the value of the index, one might argue that they are more than 43% overvalued.
Even if the price can be explained on the basis of expected future growth, then a 43% price premium means that their future success is already priced in. Said differently, if they perform in line with very high expectations, then their intrinsic value will eventually catch up with their price, which means little or no further upside over the next decade for anyone investing today. Conversely, if these companies underperform expectations, then they have a long way to fall back to reality.
These five companies are, to a very great extent, responsible for the S&P 500 having run so far ahead of reality.
And to make matters a whole lot worse, there is talk of Tesla (TSLA) being included in the S&P 500 soon. This is a company that currently trades on a price to earnings ratio of 900 and which on any rational measure is one of the most overpriced companies in the world. If it is included in the S&P 500, it will only exacerbate the problem of the index being out of touch with reality, and it will increase the risk profile for those investing in anything bench-marked to the S&P 500 index.
The last time we experienced this kind of tech frenzy was the dot com boom and bust of 2000. Only this time, it is a whole lot worse as I shall go on to explain.
Indicators of an Overvalued Market
Let us look at the peaks and troughs in the S&P500 over the past 90 years.
The peaks are in red, the troughs are in blue.
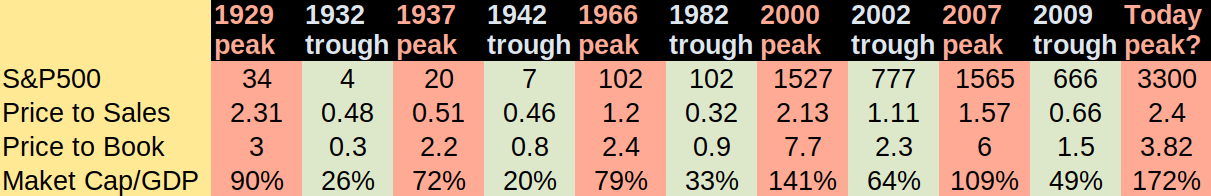
Source: Bureau of Economic Analysis, US Department of Commerce, Standard & Poor’s
The current price to sales figure of 2.4 times is a record high. It exceeds the 1929 pre-crash stock market level and is also well ahead of that seen in the irrational exuberance of the 2000 dot com boom.
Some of the increase can be attributed to higher net profit margins of circa 10.7% at present, but even if net profit margins were down at 9%, the price to sales number would still be 2.02 based on a constant earnings yield, and so, this over-valued signal is still valid.
The price to book ratio of the index currently stands at 3.82 which, while being below both the 2000 and 2007 peaks, is still high on an historic basis and certainly in red-flag territory. Why is price to book so important? It highlights how much of a premium to the equity value of a company an investor pays and so defines the earnings yield that will be achieved.
If the S&P 500 return on equity is 16% and you pay a price that is 3.82x the equity value, then the earnings yield that you will achieve on your investment will be a meagre 4.19%. That doesn’t meet the hurdle rate of any intelligent investor that I know.
Market cap to GDP became popular in recent years thanks to Warren Buffett. Back in 2001, he remarked in a Fortune Magazine interview that "it is probably the best single measure of where valuations stand at any given moment." On this measure, the market looks to be more overvalued than at any time in history, and more concerning it is higher by quite some significant margin.
The long term average is 82% and yet today we stand at 172%.
To make matters worse GDP is now falling due to the coronavirus pandemic while the S&P 500 continues to climb - see the FRED chart below which demonstrates the divergence. This will amplify the Market cap to GDP metric unless the market corrects pretty soon.
The Pendulum
The issue is that the markets act like a pendulum. If the price swings too far to the right then eventually it will swing back equally hard to the left. This cycle typically takes two years to complete before the market eventually resumes its upward trend as the chart below demonstrates. It is also noteworthy that these two-year corrective periods coincide with recessions which are shaded in blue for ease of reference.
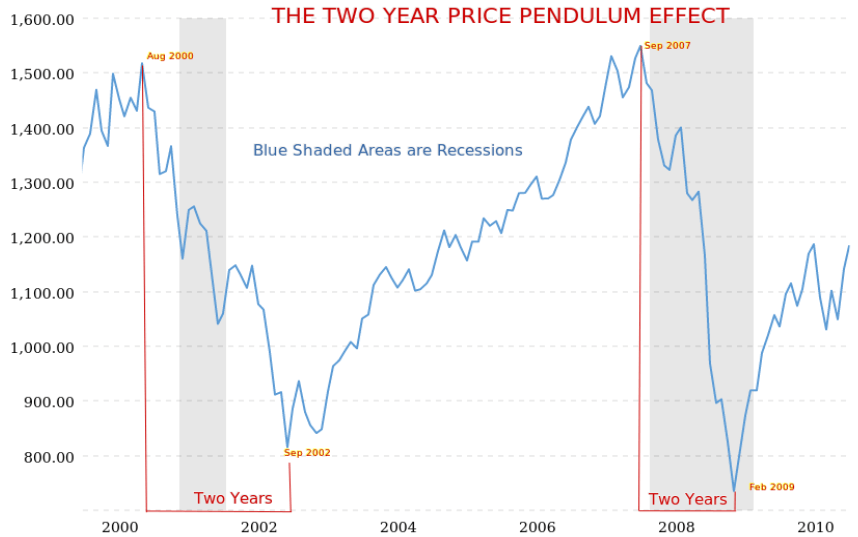
Source: Macrotrends
Now, let us zoom out of the same chart and take it to the present day. We can see the pendulum has swung so far to the right that the dot.com crash in 2000, and the dip caused by the 2008 financial crisis appear almost insignificant in comparison.
Note also the shaded area denoting a recession in 2020 and see how the market corrected during both of the previous shaded areas! This warning signs certainly look ominous.
Source: Macrotrends
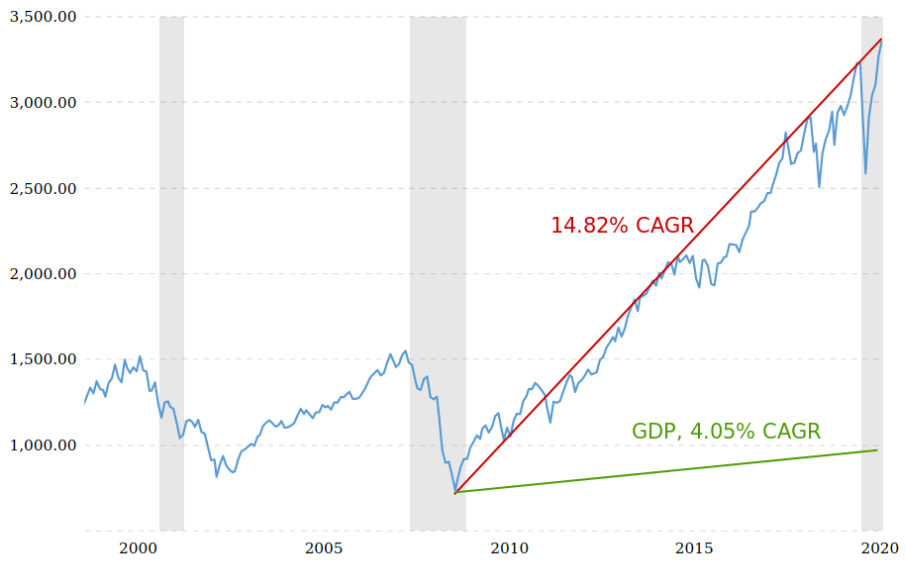
Of particular note is that, since 2009, the S&P 500 has experienced a compound annual growth rate of 14.82%, while the underlying economy has only grown at an average rate of 4.05%.
The math simply does not work. If the companies in the economy only grow GDP at 4% per year over a decade how can the value of those companies increase by almost 15% per year in the same period?
The chart below shows that, over the long term, the S&P 500 and GDP have historically been mean reverting. Before now, the largest divergence occurred in 2000 and in 2007, but you will note that on both occasions a correction brought the index back into line with the GDP growth trend.
This makes perfect economic sense, and one may anticipate that this will always be the case.
But, as you can see, never before has the market been priced so far ahead of the underlying economy as it is now.
On this basis, the sharp fall in the stock market back in March 2020 when the pandemic first struck the U.S. pales into insignificance relative to the size of the drop required to bring the index back in line with economic growth.
This suggests that the 2020 economic shock will not result in the "V" shaped recovery that many have assumed, but instead it will be a "W" shape with the second dip, which still lies ahead, being far greater than the first.
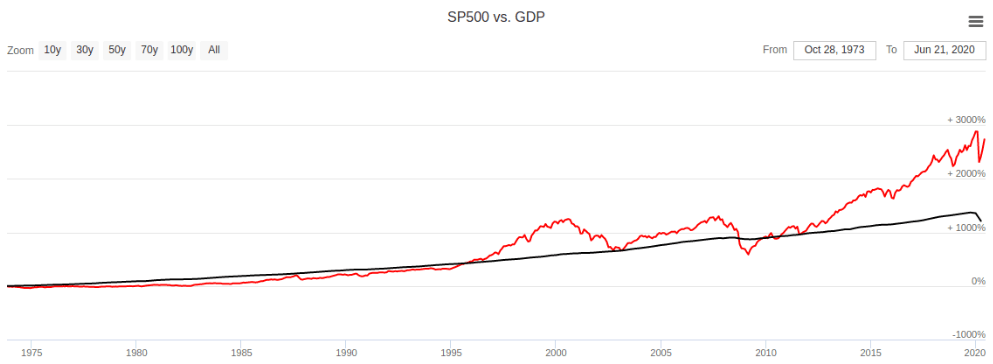
Source: Longtermtrends.net
The market last broke away from the GDP growth rate back in 2011 and an equity asset price bubble began to inflate - more on this later. For the eight years that followed the asset price bubble grew but at least both GDP and the market were trending in the same direction with a positive gradient on the curve.
But fast forward to 2020 and we now not only have a hyper-inflated stock market, but we also have divergence against the underlying economy. While GDP and the economy are contracting, as one would reasonably expect in a recession, the S&P 500 is accelerating higher.
We have a negative gradient on GDP curve and a positive gradient on the S&P curve. This is a huge red flag warning sign in my book.
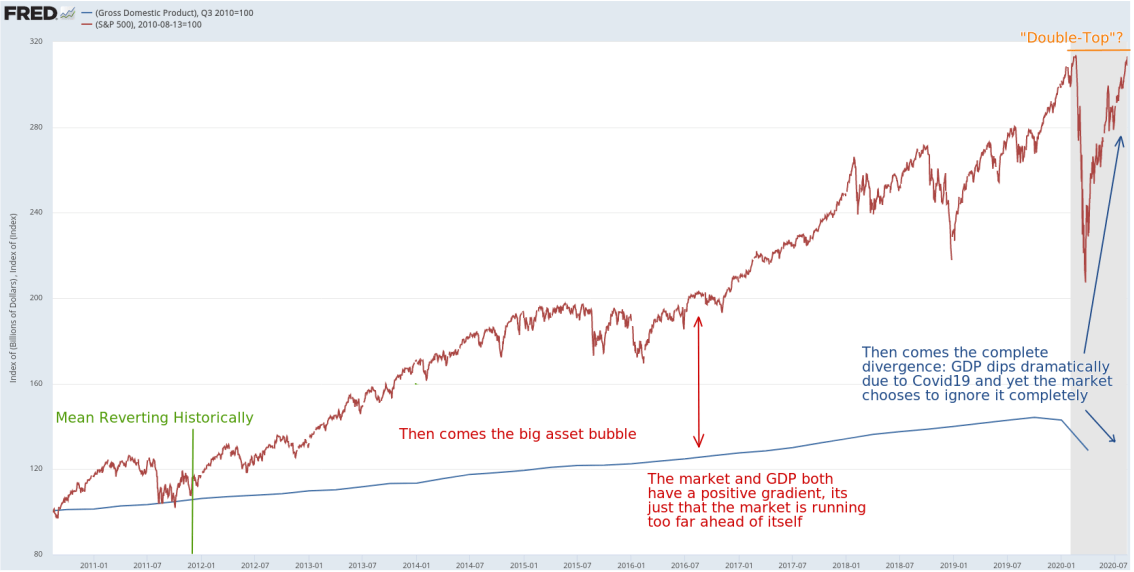
Source: Federal Reserve Bank of St Louis, James Emanuel
Technical analysts have been looking at the chart above and have been suggesting that we are heading for a “double-top” shown above in orange.
For those not familiar with technical analysis, a double top usually leads to a sharp downturn after the previous high is retested but not materially breached.
Said differently, it is where the balance of buyers and sellers shifts to become top heavy, hence the impenetrable resistance level and the subsequent sell off. As such, both technical and fundamental analysts seem to be aligned in anticipating a correction imminently.
The Cause of this Extraordinary Situation
A perfect storm is defined as a particularly violent storm arising from a rare combination of adverse meteorological factors. I would suggest that in economic terms we are heading into a perfect storm due to a rare combination of economic factors.
First is central bank policy that will go down in the history books as being one of the biggest economic mistakes of all time. Second is political manipulation brought about by the slashing of corporate taxes. Third is the proliferation of passive funds which have destroyed the efficiency of markets.
Let us take each in turn.
Cause 1: Central Bank Lunacy
The Federal Reserve, along with central bankers in most developed countries, has now dug themselves into a hole so deep that there is no way out.
The solutions adopted by Central Bankers following the 2008 economic crisis have inflated an asset price bubble like no other. Equity prices and real-estate prices have shot up like sky-scrapers, but their foundations are built on sand.
How do central bankers reverse the lax monetary policy that they have pursued for way too long without the entire house of cards collapsing? The answer is that they can’t, and this is why they are now completely hamstrung.
The Fed has demonstrated a desire to reverse its quantitative easing position and also to normalize interest rates on numerous occasions over the past decade. Each attempt has failed. The economy was always considered too weak, even when the unemployment rate was down at 4%.
So, how do you reconcile the economy being too weak for a 2% interest rate environment with the S&P 500 increasing at 14.8% per year over the same period and continually hitting new highs?
The truth is that lax monetary policy of central banks has caused an asset price bubble which is sustained by cheap money rather than by economic fundamentals. More particularly, no central banker wants to see the bubble burst during their tenure and so there is a reluctance to move towards normalization which means that we are stuck with the status quo.
The explanation provided for the Central Bank intervention this year was to calm financial markets because they were threatening to become dysfunctional, which was indeed true. But acting in concert, all the world’s major central banks pumped trillions of dollars, euros, yen and pounds into their financial markets. Stock markets rallied even though this was the period when output was collapsing everywhere.
The rapid bounce in stock markets helps to give the impression that everything is under control and the economic crisis is drawing to a close. But perception is far from reality.
Ask yourself this - how many of your friends and family are in a better financial situation now than they were in 2019? How many businesses do you know that are on their knees? How many companies are laying-off staff, cutting dividends and slashing earnings forecasts?
And yet the stock market is hitting all-time highs.
Financial markets were once seen primarily as places where businesses and governments could raise capital for productive investment. However, there has been a pivot in recent years away from production towards speculative finance, most of it debt-fueled.
And worst of all is that the Central Bankers who are charged with the responsibility of mitigating systemic risks in the financial system have created the biggest risk of all.
I am not alone in my thinking. Tobias Adrian, the financial counsellor at the International Monetary Fund, said recently that emergency action by central banks had boosted asset prices and added that these “unprecedented actions could have unintended consequences, such as fuelling asset valuations beyond fundamental values simply on expectations of lasting support by policymakers”.
Watching investors in the market at the moment reminds me of the scene in the movie Rebel Without a Cause when James Dean drives at full speed towards the cliff edge. This is a dangerous game, and people will eventually get badly hurt.
Cause 2: The Trump Administration
First, I must declare that I am a British citizen living in the UK and so I have no US political allegiance. I am neither a Republican nor a Democrat. I write this section of this article based purely on observations of the economic effect of a political policy, not as an endorsement or criticism of that policy.
Without exception, every speech made by Donald Trump has a reference to the stock market. It is extraordinary that he measures his success relative to the performance of the stock market. A cynic might also say that he has so much personal wealth invested in equities that he has an ulterior motive, but let’s ignore that for now.
We have already seen how an asset price bubble was inflated by lax central bank monetary policy. The market rallied very strongly as a result from 2009 until 2015, but then, market valuations started to looked very overdone, and the market hit a plateau.
In fact, the market began to wobble as market prices appeared to have run way too far ahead of the intrinsic value of the market. Most seasoned investors anticipated a correction at that time but Donald Trump came to the rescue.
Trump’s 2016 election manifesto included a promise to slash corporate taxes, which he subsequently delivered via the Tax Cuts and Jobs Act 2017. This was an ingenious political move which amounted to a sleight of hand that would have put Penn and Teller to shame.
By slashing the corporation tax rate from 35% to 21%, corporate America instantly saw net earnings increase from 65 cents in the dollar to 79 cents.
This amounts to a 21.5% earnings boost without any improvements in the fundamentals of the economy. And since share valuations are a product of earnings, as profits increased by 21.5%, then so too did share prices as the chart below demonstrates.
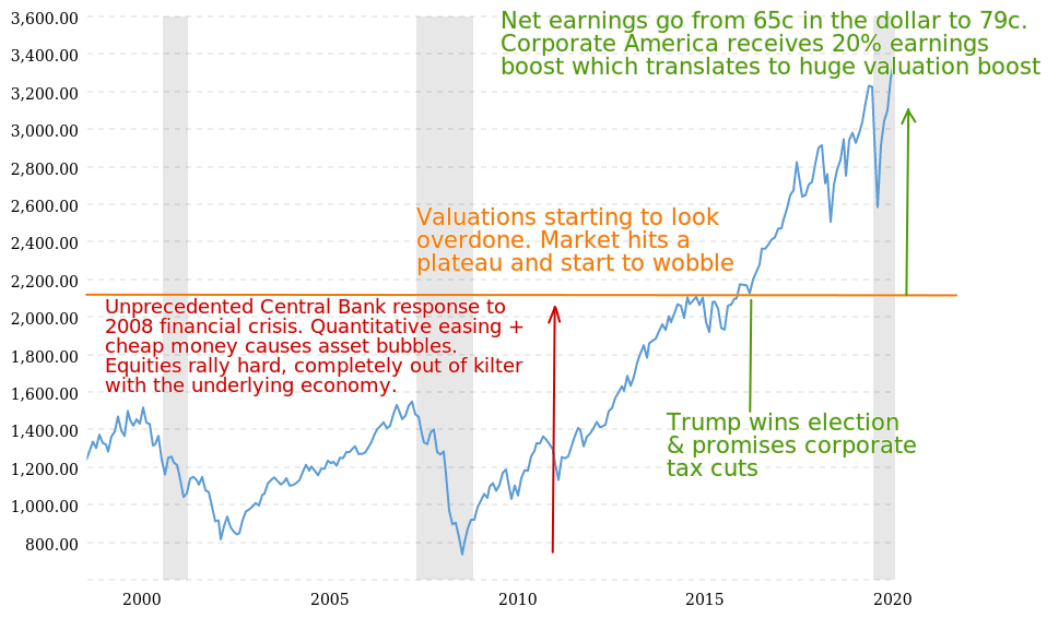
Source: Macrotrends, James Emanuel
The media didn’t understand what had happened. Instead they saw Wall Street rally hard after Trump was elected and reported that Wall Street was cheering a Trump presidency!
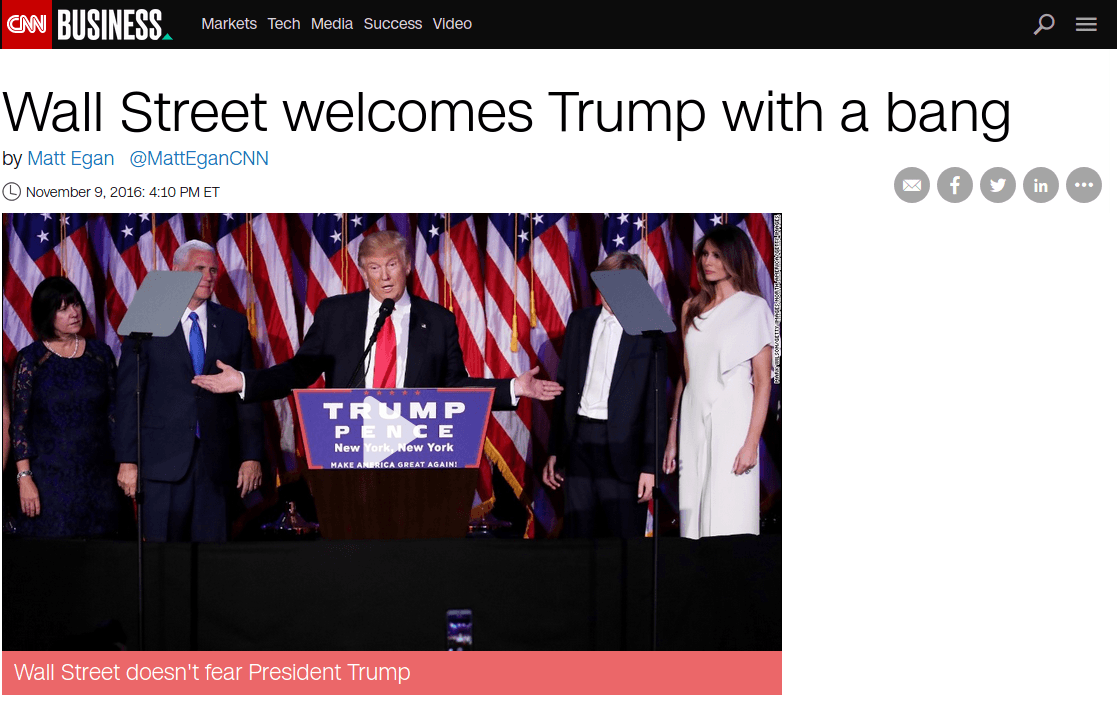
Very clever political move Mr Trump, and great for his family investment portfolio, but not a good thing for the market in the long term.
The market was arguably overvalued in 2015/16. Now, it had been propelled into the stratosphere. At this stage, there was absolutely no correlation between the market and underlying economics as already demonstrated earlier in this article.
Of greater concern is that the increase in profitability is now fully baked into the market, and the benefits of tax cuts have mostly been competed away. So, we now have artificially inflated equity markets with no tangible economic benefit attached.
More particularly, the public debt mountain is now a staggering $25 trillion, which is 116% of GDP. Public debt was already out of control following the 2008 financial crisis, but COVID-19 has made matters a whole lot worse.
The government must repay this debt over time, and so, higher taxes are inevitable. So, what happens when the corporate tax rate goes back to 35%? Well, corporate America sees an instant hit to its bottom line and that causes at least a 17.7% stock market contraction as profits are squeezed from 79 cents in the dollar to 65 cents.
Not a very attractive prospect, but it will have to happen at some point, and it may occur soon after the November election. That political tax cut stunt in 2016/17 doesn’t look so clever now!
To make matters worse still, over the past decade, the companies of the S&P 500 have spent more than 100% of their profits paying dividends and repurchasing shares - mostly to offset dilution that would otherwise be caused from remunerating executives with free share options.
Know this: for much of the past decade, these repurchases were made at multiples averaging about 20 times earnings, or at an earnings yield of 5% well below the average return on equity which dilutes shareholder returns.
This is financial engineering in the extreme. It has masked an enormous transfer of wealth from shareholders to company executives, so far undetected by a decade of rising stock prices.
Said differently, the boost in earnings brought about by Mr Trump has enriched a minority of top corporate executives at the expense of shareholders who have not noticed the situation because, at least on paper, their shareholdings are currently worth more.
To those shareholders, I say “wake up and take notice” because the tide is about to go out, and the corporate executive is now wearing your swim suit!
Cause 3: Passive Funds
Passive fund management now accounts for over 50% of all assets in US stock-based funds.
That is up from just around 25% a decade ago. 2005 and 2006 were the last two calendar years in which actively managed U.S. equity funds had back-to-back inflows. As the chart below shows, money has been pouring out of active funds and into passive funds on an accelerated basis.
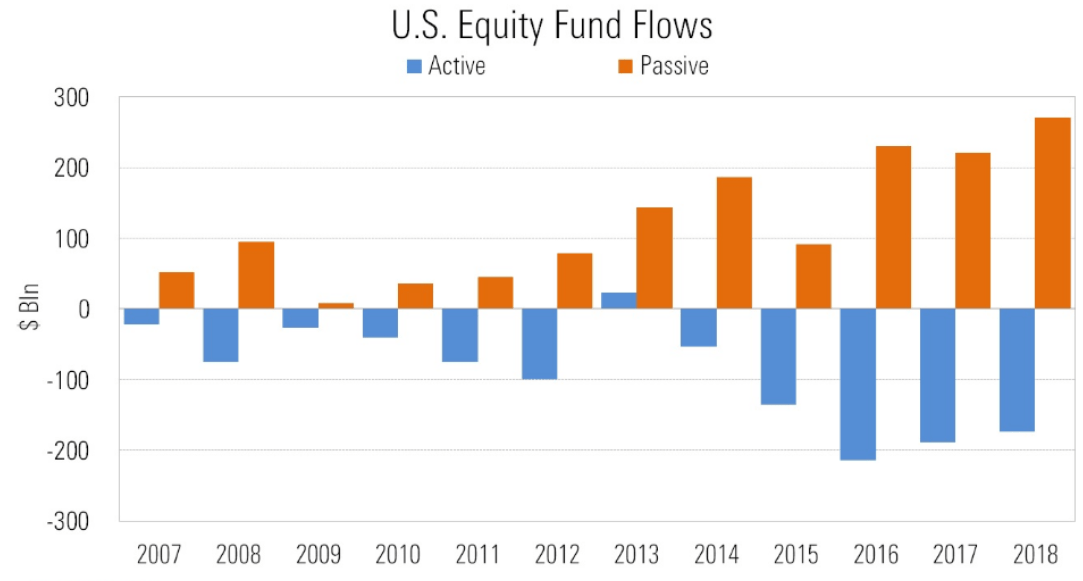
Source: Morningstar
Passive funds track the market and the fees are lower. So what’s the problem? Allow me to explain.
The stock market has always maintained efficiency because it is democratic. The great Benjamin Graham in his critically acclaimed 1949 book The Intelligent Investor stated,
“In the short run, the market is a voting machine but in the long run, it is a weighing machine.”
What he meant by this is that there is every possibility that investors may back the wrong horse in the short term, but those horses quickly lose favour, and so over the long term, the market will sort the good from the bad. So, active investing, over time, is the mechanism by which the market settles on fair valuations.
Then came the passive funds.
John Bogle founded the Vanguard Group in 1975 having found inspiration from Nobel Laureate economist Paul Samuelson’s 1974 article, “Challenge to Judgment” which argued the merits of an index tracking fund. Today, the Vanguard Group is the second largest fund manager in the world!
Passive funds did not really gain any noticeable traction until the economic crisis of 2008, and then the landscape shifted as the chart above demonstrates, supported by the chart below.
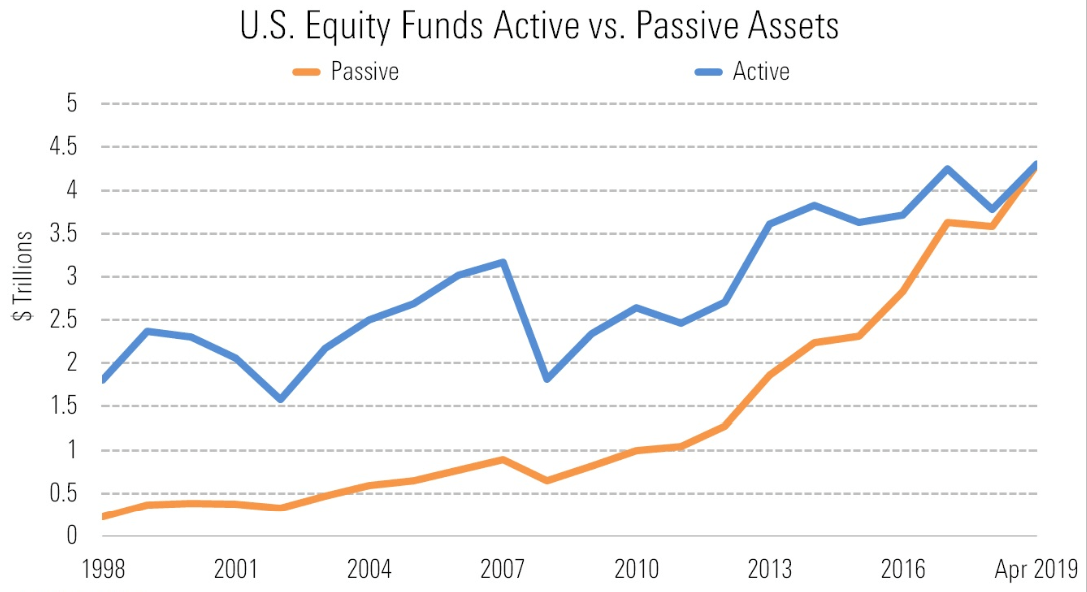
Source: Morningstar
In principle, the concept is attractive. Low fees and tracking the market take the pain out of investment decisions. But please bear in mind that a fund which tracks the market and then deducts fees will mathematically always underperform the market – so if you are seeking alpha, passive investing is not for you.
In any event, the principal of passive investing relies upon passive funds only being a small proportion of total investing activity. The theory is that active investors do all of the hard work analyzing corporations and placing their money in the most promising companies – the good investments will then be pushed to the top of the pile being more heavily weighted in the indices.
The passive funds simply piggy-back on the hard work of the active investors by tracking the index, without doing any analytical work themselves, and so avoid analytical expense whose benefit is passed on to investors in the form of lower fees. Great in principle, but then, some might argue so was Marxism! Neither is good in practice.
Allow me to explain the issue. What happens when the passive funds start to dominate? The theory completely breaks down. Now, instead of the dog wagging its tail, the tail is blindly wagging the dog.
Now, rather than the passive funds being able to piggy-back on the work of the active fund managers, instead now passive funds have created a negative feedback loop whereby they are all piggy-backing each other!
A passive investment manager allocates capital blindly. As investors deposit money into the fund on a regular savings basis, the passive fund buys shares in the constituent companies that make up the index being tracked regardless of fundamentals.
So, if one of those companies has an unrealistic price to earnings ratio the fund manager still buys it. And that pushes the price higher, and so the price to earnings ratio becomes more unreasonable. And then, the next passive fund buys it, and it goes up further, and so on and so forth, up and up and up.
This is how shares like Tesla trade on PE multiples of over 900 – no rational active fund manager would ever invest in that because it implies an earnings yield of 0.14% with a whole heap of risk attached – you would be better off buying the 10 year Treasury which yields 0.69% risk free!
Tesla is a great example of how passive funds have destroyed the efficiency of the market. Its share price is up over 800% this year, not because its business prospects have improved - in fact, its sales have been in decline since Q4 2018, but because the market knew that four straight quarters of profit would qualify it for inclusion in the S&P 500.
This would mean that the S&P 500 passive funds would all have to blindly buy it regardless of its economic fundamentals, and so the speculators tried to front-run the passive funds in order to make a fast buck. And this is what I mean by a negative feedback loop, which is caused by passive funds and which is destroying he efficiency of the market.
The other issue with passive funds is one of concentration risk. As we learned earlier, the Fabulous 5 are only 1% of the S&P 500 by number of companies, but they are 25% of the index by value. And so if you switch your investments from an actively managed fund with a diverse portfolio of good value companies into a passive S&P 500 fund, you will find that 25% of your money is invested in just five companies.
Now, multiply that by the tens of millions of investors who have switched to passive investing and you have trillions of dollars, 25% of which is now invested in only 5 companies! Is it any wonder that these companies have market caps of well over $1 trillion USD? It is not about how good these companies may be or about their future prospects, it is all about passive funds blindly inflating market prices and distorting the market.
And so you can see how passive funds have contributed to the S&P 500 being at overvalued levels that we see today. Regulators really ought to sit up and take notice because their remit is to ensure the efficient functioning of markets and to mitigate systemic risks. I would argue that they have dropped the ball on this one!
Conclusion
The S&P 500 is, by any measure, off the scale in terms of being overvalued.
My calculations suggest that fair value is in the 1,600 to 1,800 range rather than the 3,386 that it is at the time of writing. In the interests of brevity, I shan't go into my valuation methodologies, but if you are interested in equity valuation techniques, I cover them in great detail in my book "Success in the Stock Market".
However, I will add that the result of my calculations is supported by the metrics that we used at the beginning of this article. With the S&P 500 at 1,800, the Market Cap to GDP ratio would fall to 91.4%, the price to sales multiple would drop to 1.28, and price to book would be 2.03 - those are far more realistic levels. And so the suggestion is that the S&P 500 is due a correction in the order of 50%.
Is there a recent precedent for such a correction? The answer is yes. In the 1960s, there were a group of blue chip companies known as the Nifty Fifty. Back then, this group of 50 large, good quality companies like General Electric (GE) and Polaroid were rated at anything up to 100 times earnings as investors poured in regardless of price - much like Facebook, Tesla and Netflix (NFLX) today.
Eventually, the market came to its senses and a stock market crash caused a long overdue price correction. The S&P 500 fell by 39% between 1973 and 1974. The Nifty Fifty fell by a whopping 47%. It took investors in these stocks a decade to recoup their losses, and they never caught up with the broad market.
The S&P 500 has been running on steroids for the past few years, but the drugs have now run out.
We know interest rates are almost zero, and so they can’t go very much lower. There is more chance that they will move higher at some point and, as interest rates increase, so earnings yields need to increase. For this to happen, stock prices need to move lower – substantially lower.
Similarly, we have seen that net margins are historically very high. Can they go very much higher than 11% on average? Probably not, particularly in a pandemic induced recession. So, what happens when net margins are squeezed? The price to sales ratio moves lower and once again, stock prices are negatively impacted.
There are no more tax cuts on the horizon and in order to repay the national debt taxes will need to go up pretty soon. That will hit the bottom line of corporate America, reduce earnings and so negatively impact stock prices.
Government support that has helped keep businesses and workers afloat following the coronavirus shutdowns cannot last forever. There are a great many businesses and employees that will soon have their life-support turned off. The true impact of this global disaster is yet to be felt. This will send a shock-wave through the economy.
In summary, there is nothing on the horizon to drive the market higher but a great many things that will lead to it correcting.
I know that I am not the only one to have observed that the market is way overpriced. Warren Buffett is sitting on $135 billion in cash at Berkshire Hathaway (NYSE:BRK.A), and given current market valuations, he has been unable to invest it. Instead, he is waiting patiently for the correction that seems inevitable.
In their new book, Boom and Bust, Quinn and Turner note that between 1987 and 2009, there has been a stock market crash on average every six years, but we have not had a meaningful correction now for 12 years. “The global economy has essentially become a giant tinderbox, susceptible to any spark that may come its way.” The world is not exactly short of potential sparks right now.
My message to you, my fellow investors, is be careful. The Wall Street crash began on October 24th, 1929. The market subsequently lost over 88% of its value. I have often wondered what it must have felt like on October 23rd, the day before the fall. Perhaps it felt very much like it does today!
So, what are you able to do?
You could cash out at high prices and wait for prices to drop before reinvesting. Sometimes cash is king.
This may be an interesting proposition if you are invested within a tax-free wrapper, but otherwise, it is not likely to be tax efficient as selling down your entire portfolio at premium prices means a huge capital gains tax liability.
You could adopt a long/short trading strategy. This works by investing in companies within the same industry where one looks far better valued than the other.
So, for example, Toyota Motor ADR (NYSE:TM)/Toyota Motor Corporation (OTCPK:TOYOF) is trading at 9.8x earnings, while Tesla is trading at an enormous 900x earnings. If you take the view that Toyota is better value, then you would take a long Toyota position versus a short Tesla position.
If the economy recovers without a correction then Toyota may reasonably see a multiple expansion of 50% to a PE of 14.6, but Tesla is unlikely to see a 50% multiple expansion to 1,350x earnings!
So, you would profit from the differential.
If the market crashes then Tesla has much further to fall back to reality - an 80% drop in the Tesla share price would still leave it trading at a crazy 180x earnings - and this would give you a far larger gain on the short side than a 25% loss suffered on the Toyota position, which is unlikely to trade on a multiple below 7.5x.
You could take a short futures position on the index a hedge.
This means that you hold on to your long portfolio of stocks, but if the market crashes then you will make a gain on the futures which will, at least partially, cushion your losses on the stocks. The downside from here on such a short position looks limited.
You could buy an index put option.
This would allow you to profit from a collapse in the benchmark which, just like the futures, would mitigate your portfolio losses and so you would be hedged.
You might like to move out of overvalued tech stocks and into more defensive sectors such as Consumer Defensive, Healthcare, and Utilities which will be more competitively priced at the moment and will usually fare better in a downturn.
You could take a position on the index itself as a hedge or alternatively on the CBOE VIX volatility index which will spike if there is a correction.
Or you could exit equities altogether and invest in defensive assets. Many people have already done which is why the price of gold is up 50% year to date.
In summary, whatever you decide to do is better than doing nothing.
Risk management is the most important part of portfolio management.
As Warren Buffett always says, there are two golden rules when investing: "Rule No. 1: Never lose money. Rule No. 2: Never forget rule No. 1!"
0 comments:
Publicar un comentario