by: Daniel Schönberger
Summary
- Since I started my series in October 2018, twelve out of the fourteen stocks covered outperformed the S&P 500 and would have been a good investment.
- Job growth is slowing down, earnings are stagnating, but yet the S&P 500 is rallying from all-time high to all-time high.
- Nevertheless, in my opinion, it is not the time to invest for the long term right now.
- Job growth is slowing down, earnings are stagnating, but yet the S&P 500 is rallying from all-time high to all-time high.
- Nevertheless, in my opinion, it is not the time to invest for the long term right now.
I started my “Preparing for the end of the cycle” series about a year ago - the first article about 3M Company (MMM) was published on October 15, 2018. During the last few months, I did not provide an update - my last article about the stocks covered in the series is from May 2019 - as I did not consider it to be necessary or make much sense.
Despite the dark clouds on the economic sky, the stock market is still rushing towards new all-time highs and the chances to hunt for real bargains are very limited. I expected the stock market to have reached its cycle peak by now, which is obviously not the case, and the US stock market (and maybe also the global economy) continues to ride on the edge of a razor blade.
Despite the dark clouds on the economic sky, the stock market is still rushing towards new all-time highs and the chances to hunt for real bargains are very limited. I expected the stock market to have reached its cycle peak by now, which is obviously not the case, and the US stock market (and maybe also the global economy) continues to ride on the edge of a razor blade.

What If?
Would it have made sense to invest in the S&P 500 (SPY) in the meantime? Maybe!
Since October 15, 2018, the S&P 500 increased about 14%, which is a solid performance. After the stocks tumbled last year in November and December, the performance since the beginning of 2019 was quite impressive, with all three major US indices rushing towards new all-time highs in the last few weeks.
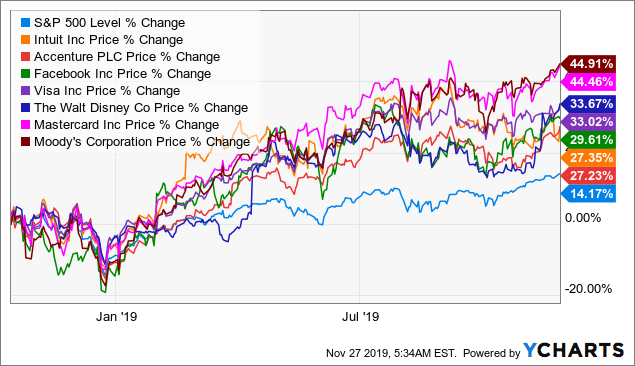
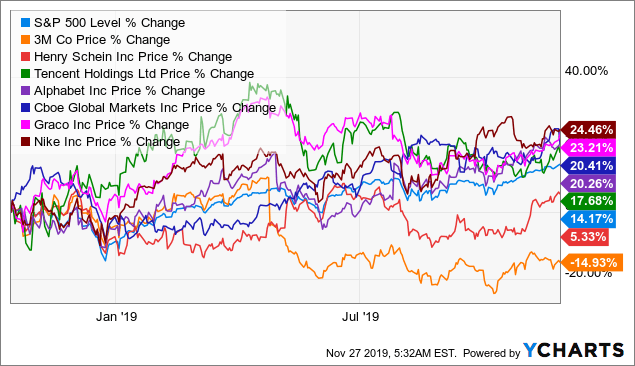
If I would have invested in the fourteen stocks I covered in my series, the performance would have been much better. Aside from two stocks - 3M Company and Henry Schein (HSIC) - all 12 other stocks covered in the series outperformed the S&P 500 during that time frame, with Mastercard (MA) and Moody’s Corporation (MCO) leading the list (both gained about 45% in value).
The performance of these fourteen stocks underlines two aspects. First of all, the list of stocks I selected to be great long-term investments obviously have the potential to outperform the market (even the two lagging stocks have the potential to outperform over the long run).
It also shows that investing in these stocks about a year ago would have been very profitable, and by not investing in these stocks I missed out on large profits. These stocks gained in value, as these companies have really superior business models, and I am really convinced that all of these stocks are good long-term investments.
It also shows that investing in these stocks about a year ago would have been very profitable, and by not investing in these stocks I missed out on large profits. These stocks gained in value, as these companies have really superior business models, and I am really convinced that all of these stocks are good long-term investments.
But we also have to acknowledge that the gains during the past 13 months are probably not just the result of fundamental outperformance. To give an example: Moody’s could report great quarterly results, with revenue increasing 15% YoY and adjusted diluted earnings per share increasing 27%.
Despite these impressive results, we have to ask if a 45% price increase is justified for Moody’s with the business being pretty consistent over time. Without disputing that Moody’s is an excellent business, the price increase since October 2018 was probably not just driven by fundamentals but also by the market sentiment, which will lead to overvaluation and drive the stocks to unjustified high prices.
Despite these impressive results, we have to ask if a 45% price increase is justified for Moody’s with the business being pretty consistent over time. Without disputing that Moody’s is an excellent business, the price increase since October 2018 was probably not just driven by fundamentals but also by the market sentiment, which will lead to overvaluation and drive the stocks to unjustified high prices.
Why So Hesitant?
You might ask why I am so hesitant to invest in these stocks right now, as it is quite obvious that each company is a great business (I told you so myself). In its essence, the answer is very simple, but when discussing it, the matter can become very complex. The short answer to the question: the market is not only overvalued but we are at the end of the cycle, which is not a good time for long-term investments.
I assume the short answer will not be enough to satisfy or convince you, and therefore, we will go into more detail about the current state of the (United States) economy. When looking at the fundamental data and the thousands of indicators, metrics and numbers we can use, there are several indicators showing that the economy is still in great shape and other indicators are sending clear warning signals. Our job is to interpret the different signals and metrics we can use and construct a story describing what the market and the economy will do in the next few years.
When looking at the different metrics, we have to recognize that some indicators are rather leading indicators, while other indicators are rather lagging the economy. When examining these indicators, we see some kind of order and chronology at which point in time these different indicators are reacting to market news or are maybe indicating a recession. Some indicators might hint towards a recession as early as 24 months before a recession, and other indicators will not react until after the recession.
There are also huge differences about the quality of these signals - some are easy to interpret and send clear signals, while others leave much more room for interpretation. And still others frequently send false signals, making the quality questionable. In the following sections, I will present some indicators I consider to be reliable.
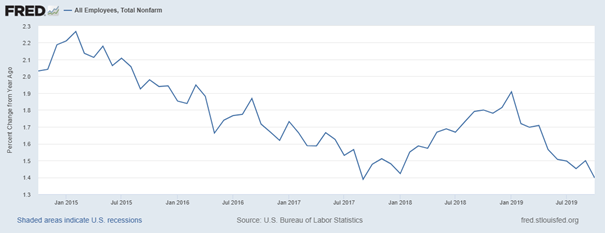
We start by looking at the labor market. The unemployment rate is currently 3.6% and the lowest rate it has been in decades (it was lower at the beginning of the 1950s). But the unemployment rate is not really a good early warning indicator for a recession. We should rather look at the initial unemployment claims, which will react earlier.
This number is stagnating at a low level and not really indicating any problems - it has been fluctuating around 220,000 weekly initial claims for unemployment insurance. So far, we see no real signs that the number is dramatically increasing.
It is not really improving, but it is also not getting lower. We can also look at the number of monthly added jobs (the nonfarm payrolls), which is still high (above 100,000, which is often considered to be an important threshold), but the number is slowing down.
We can also use the weekly working hours in manufacturing as a good early warning indicator.
The weekly working hours declined from 41.0 hours in 2018 to 40.3 hours right now. Usually, the number of working hours started declining before a recession, as companies won’t fire people right away, but rather reduce the working time (either reduced number of overtime hours or simply not working full-time any more).
In the last recession, the weekly working hours started declining, as the economy was already in a recession.

In the next section, we are looking at the treasury yields and the actions of the Federal Reserve, as both are tied together. Right now, the yield curve, which is just a graphical representation of the different treasury yields, is more or less flat on the left-hand side and a bit steeper on the right-hand side.
The “normalization” of the yield curve in the last few weeks was interpreted as a positive sign by some market participants after the yield curve has been inverted a few months ago, but it is actually a bearish sign, as these are the classical steps that happen before a recession: the yield curve is inverting more and more over time, the typical next step is the Fed lowering the Federal Funds rate (in most cases several times), and the left-hand side (short-term) of the yield curve is reacting to the actions of the Fed and the short-term treasury yields are declining, which leads to a normalization of the yield curve.
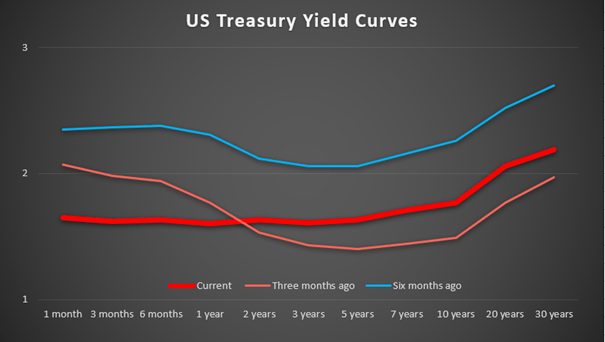
(Source: Own work based on numbers from U.S. Deparment of Treasury)
As often in the past, the Fed called the lowering of the Federal Funds rate just a “mid-cycle adjustment”. But aside from the lowering of the Federal Funds rate, the Fed also started to increase its balance sheet again: after the balance sheet was reduced from $4.5 trillion to about $3.75 trillion, the balance sheet is above $4 trillion again. In my opinion, the Fed knows very well that we are at the end of the cycle (or very close to the end) and is trying to ease the inevitable fall (which is the Fed’s job).
Another fundamental number I didn’t pay much attention to in my past macro articles is the reported earnings. When analyzing individual companies, I always pay attention the reported earnings, but I never focused on the reported earnings of the S&P 500. According to Multpl, the trailing 12 months' earnings were basically flat between December 2018 and June 2019 (shown by the monthly data), but most companies could still beat estimates, as expectations have been lowered. With almost all companies having reported quarterly results, earnings declined 2.3% in the third quarter, according to FactSet (data from mid-November).
A week later, Proprietary Research reported earnings decline of only 0.4%. For the fourth quarter, analysts are expecting earnings to decline in the very low single digits (about 1%) compared to the same period a year before. Not to long ago, earnings growth was expected to be above 10%. When looking at the earnings decline during the last two recessions, the situation right now is not really comparable, as we saw declines in the mid-double digits, but when considering the rising US indexes against the background of stagnating or even slightly declining earnings, one must wonder.
Black Friday last week and Cyber Monday this week demonstrated once again that consumer spending is still very healthy (and responsible for about 70% of the US economy). On Black Friday, online shoppers spent about $7.4 billion (at the time of writing, I didn’t have numbers for Cyber Monday). While companies like Visa (V) or Mastercard are profiting from high consumer spending, which is rising about 20% compared to the year earlier, many companies have stopped investing, which becomes obvious when looking at 3M Company or Graco Inc. (GGG), for example.
Where To Go From Here?
I know it sounds frustrating - especially when looking at the performance of these stocks - but I still would not buy stocks right now. Considering the even more stretched valuation levels - US stocks increasing more than 20% on average (measured by the S&P 500), but earnings are stagnating - should make us even more hesitant if it is a good idea to buy stocks right now.
When looking at the P/E GAAP TTM, 3M Company and Henry Schein seem to be cheap (trading at 20 or below), and when looking at the price-to-free cash flow (which might be the best among the simple valuation metrics), there even more companies trading below 20: aside from 3M Company (trading at 13.92) and Henry Schein (trading at 15.67), Facebook (FB) is trading at 16.28, Alphabet (GOOG) is trading at 17.06, Accenture (ACN) is trading at 19.25 and Graco is trading at 19.78.
In my article about a year ago, I calculated an intrinsic value of $140 for 3M Company, and it would be one of the very few stocks on my buying list right now (but it has to decline at least 10% from current valuations to be attractive). And the stock is also interesting for its dividend, which would be above 4% when buying for $140.

Conclusion
I still believe it pays off to be prepared early and to have a watchlist of stocks to invest in. It is better to know what companies to invest in when the price is right and just having to execute than watching a certain stock (or several stocks) decline suddenly and first having to do the research to see whether the stock could be a good pick.
Nevertheless, I might have been publishing my watchlist too early, as the stock market seems to take a lap of honor to celebrate the great run it had during the last decade. Maybe we should not stop investing entirely and still pick great stocks when bargains arise, but it was right to slow down and reduce the amount of money invested in the stock market about one or two years ago - despite the run, the downside risk is extremely high and bargains are limited.
0 comments:
Publicar un comentario