The Tale Of Gold's 200-Day Trend Line
by: Clif Droke

- Its lateral trading range was necessary to allow it to consolidate the rally.
- Central bank demand will keep gold price stable until the next breakout.
For many investors, gold’s extended trading range since late August has been agonizingly long.
Gold bulls have patiently waited for the next rally phase of the metal’s price to commence. And while there are fundamental signs which favor the continuance of gold’s bull market, the wait for the next extended rally will likely continue a while longer.
In this report we’ll review the factors which point to gold enjoying strong underlying support, but also needing additional time to consolidate its June-August rally before commencing another major climb.
One of the biggest arguments that gold bulls have made for a renewed rally phase in the metal is the sharp drop in the greenback this past month.
In recent reports I, too, have made the case that the improvement in gold’s currency component will help keep the metal’s price buoyant in the coming weeks.
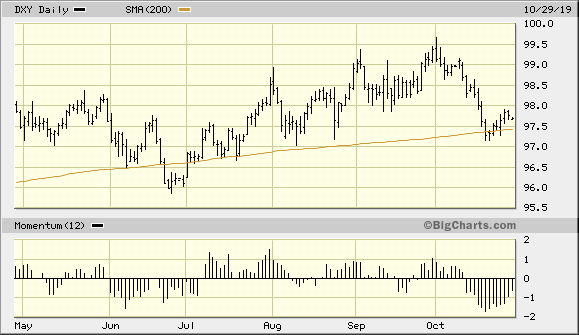
Indeed, the weaker U.S. dollar index (DXY) is the reason for investors to remain positive on the gold outlook since gold tends to move inversely to the dollar.
Yet the dollar’s weakness alone isn’t sufficient to allow gold to launch a sustained rally, e.g. one lasting several weeks to months.
This is especially true given the fact that while the dollar has dropped considerably in recent weeks, it’s sitting on a trend line that has reversed previous declines.
I’m referring of course to the widely watched 200-day moving average.
Shown below is the dollar index in relation to its 200-day trend line. In the recent past, the 200-day MA has served as an inflection point for declines in DXY.
This was certainly the case in January and June of this year, as the dollar reversed a major decline in both instances.
However, regardless of whether the 200-day MA will act as a support to keep the dollar from further weakness, the extent of dollar’s decline in October should be enough to give gold at least a temporary shot of adrenaline and give the bulls a short-term advantage.
.
 Source: BigCharts
Yet while a short-term rally is certainly possible on the back of the dollar’s recent weakness, there are other factors preventing an extended intermediate-term-oriented gold rally from taking place just yet.
What gold enjoys in the way of its improving currency component, for instance, is somewhat negated by the loss of its safety bid.
While there are still reasons for investors to own gold as a safety hedge against various geopolitical concerns – including Brexit – the biggest catalyst for gold buyers in late 2018 until this summer was the U.S.-China trade war.
But now the bellicose rhetoric that characterized the tariff dispute for much of 2019 has been replaced by a more diplomatic tone.
This cooling of passions has diminished the demand for safety while increasing investors’ tastes for riskier assets.
This explains the lateral trading range in the gold price since its late August peak.
A more mundane explanation for gold’s low-volatility consolidation phase in the last two months can best be explained with a graphic illustration.
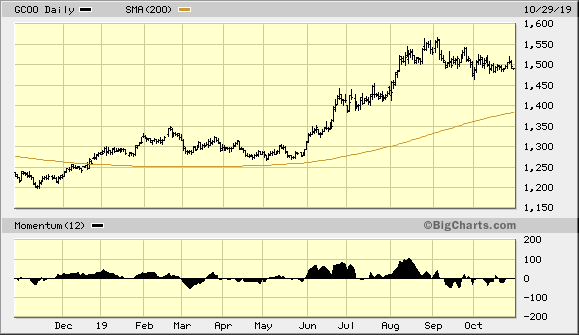
Shown below is the one-year gold price graph along with its 200-day moving average.
The 200-day MA is a commonly used technical tool by traders and money managers alike, and its widespread use as a longer-term trend identifier also gives it a psychological significance.
Computer trading algorithms are programmed to sell or buy when the 200-day MA is either broken or successfully tested.
As you can see in the following chart, the gold price became drastically over-extended from its 200-day trend line during the big run-up in June to August.
Whenever price becomes distended from the 200-day MA, it sends the message to technically oriented traders that the market is potentially “overbought” and therefore vulnerable to a bear raid.
For that reason, many participants take profits or sell outright whenever the distance between price and the underlying moving average becomes conspicuous.
.
 Source: BigCharts
The last time a gold rally outstripped its underlying 200-day moving average by a comparable degree was back in 2016.
An extended rally in gold in the first half of 2016 put the gold price well above the 200-day MA.
Subsequently, it was followed by a major decline later that year.
It wasn’t until the gold price overshot the 200-day MA on the downside in late 2016 that buyers were once again attracted to the metal and a rebound then followed in 2017.
The above graph shows that even after two months of a sideways drifting pattern, gold is still somewhat over-extended from this trend line.
For this reason, the metal could use some additional consolidation before its next extended rally phase begins.
The closer in line the gold price comes to its 200-day MA, the more technically healthy the market will be.
For this reason, investors shouldn’t be overly concerned by the amount of time that gold has spent in its trading range.
Trading ranges are often a cause for concern among participants because of the fear that a narrow, trendless market is used to disguise a distribution campaign (i.e. informed selling).
There are, however, good reasons for believing that gold remains in strong hands right now and that no significant selling pressure is plaguing the market.
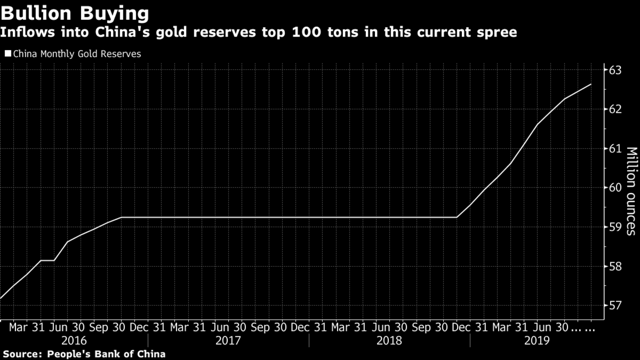
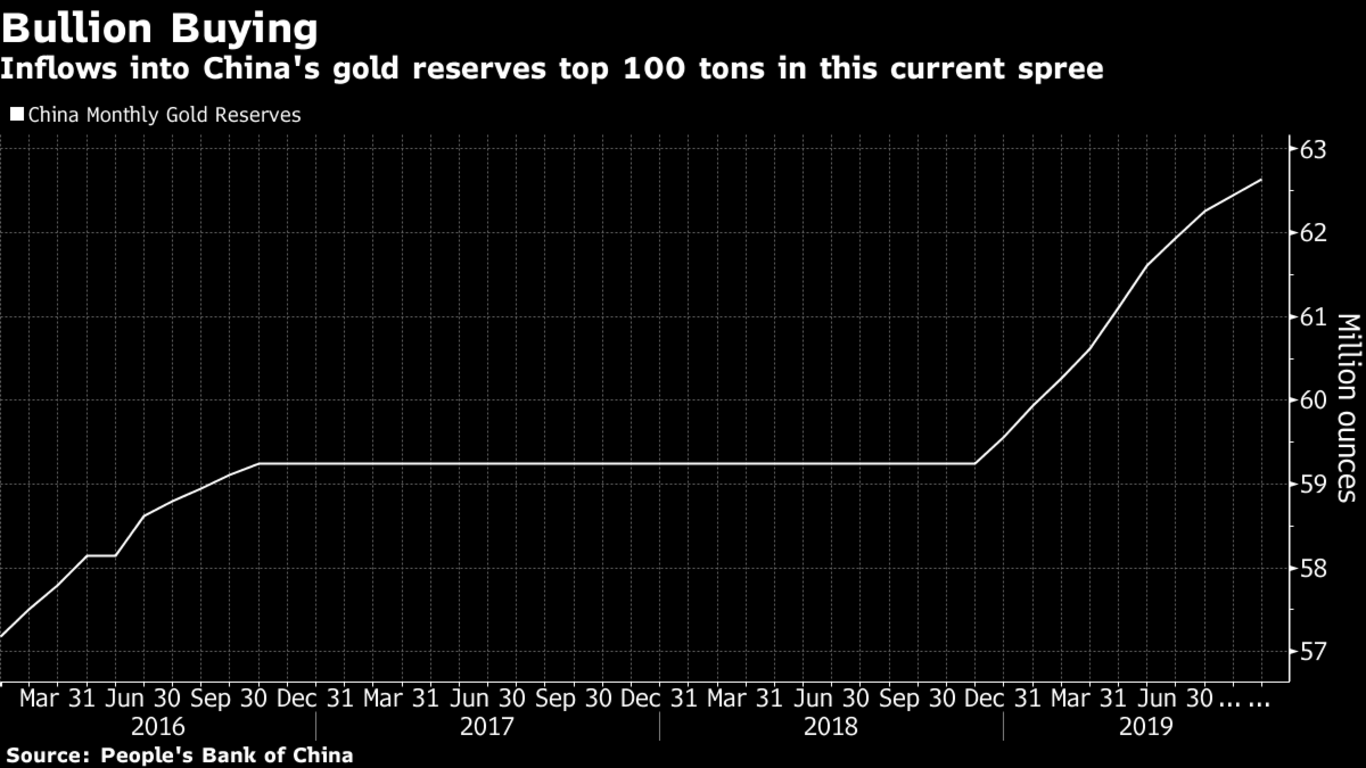
One of the reasons for assuming that gold’s support is still strong is that central bank demand has been exceptionally high in the last several months.
Heading the list of sovereign gold buyers, China’s gold reserves have increased by more than 100 tons since last December.
The People’s Bank of China raised its gold holdings to 62.64 million ounces in September alone, according to various news reports.
Ever since central banks began heavily accumulating gold in the past two years, gold has acquired a major underlying support that should keep its price from declining significantly during downward phases of its short-term market cycles.
.
. Source: Bloomberg
 Source: Bloomberg
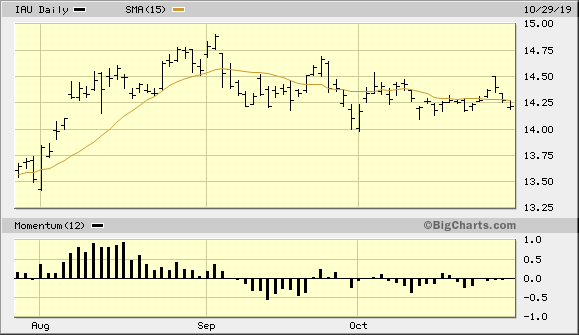
Turning our attention to the immediate-term (one-to-four-week) outlook, the iShares Gold Trust (IAU) still hasn’t confirmed a bottom signal following its September-October “correction.”
Earlier this week it looked as if this popular gold-tracking ETF would confirm a bottom and reversal signal by closing two days higher above its 15-day moving average.
However, the 2-day higher close above the 15-day trend line was immediately reversed the next day.
This effectively invalided what was a preliminary breakout signal.
Thus, we’re back to waiting for the next buy signal in this gold trading vehicle.
.
 Source: BigCharts
While I still anticipate that the fourth quarter will be a productive one for gold and gold mining shares, patience is still required on the part of investors.
Until the gold price becomes less over-extended from its underlying 200-day moving average, its lateral trading range will likely continue a little while longer.
It may take a return of the inevitable global economic fears among investors at some point later this fall before gold gets its second wind and recovers its “fear factor.”
For now, though, investors can maintain intermediate-to-longer-term holdings in gold and gold-tracking funds.
On a strategic note, I’m still waiting for both the gold price and the gold mining stocks to confirm a breakout signal per the rules of my technical trading discipline.
Accordingly, I haven’t yet initiated a new short-term trading position in the VanEck Vectors Gold Miners ETF (GDX).
GDX is my preferred trading vehicle for the gold mining stocks and the ETF I refer to most frequently in this report.
I’m currently in a cash position in my short-term trading portfolio.
0 comments:
Publicar un comentario