Fed Gives Up On Inflation, Welcome To The U.S. Of Japan
by: Lance Roberts
Summary
- Retest confirms bullish breakout.
- Fed gives up on inflation.
- Welcome to the U.S. of Japan.
Retest Confirms Bullish Breakout
"If you are a bull, what is there not to love?"
That was the message from two weeks ago, and the reasoning behind increasing our equity exposure in portfolios as we head into the end of the year.
With the Fed cutting rates on Wednesday, and companies winning the "beat the estimate game" as earnings season progresses, the markets finally broke out to new "all-time" highs this past week.
With the Fed cutting rates on Wednesday, and companies winning the "beat the estimate game" as earnings season progresses, the markets finally broke out to new "all-time" highs this past week.
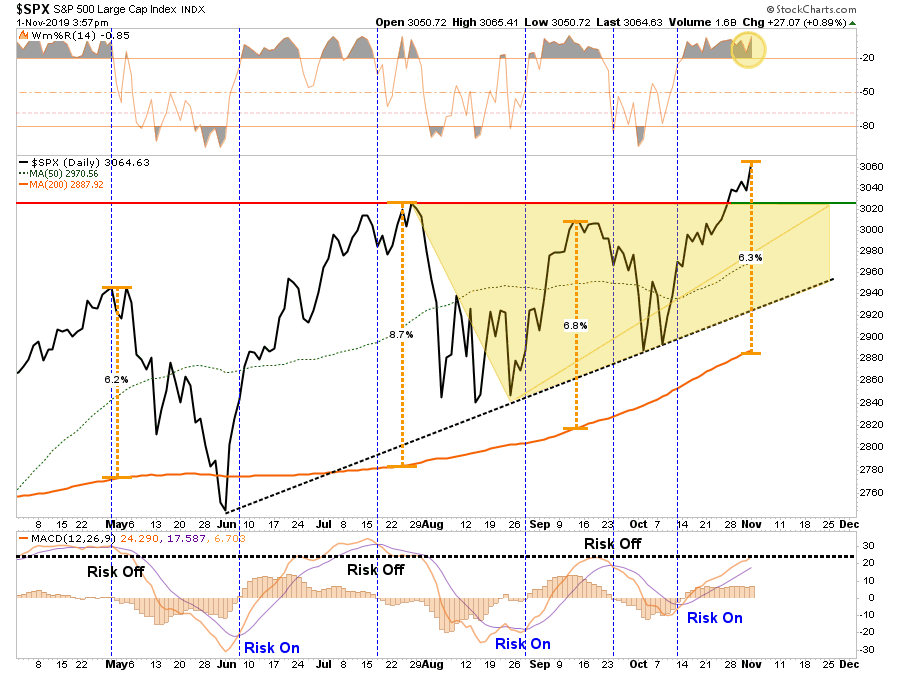
This breakout is consistent with the "revival of the bulls" which is needed as there is too much attention focused on a "recession" and "bear market." (If a recession/bear market would have occurred, it would have been the first time in history "everyone" saw it coming.)
"Over the last 30 years, when the Fed has implemented an 'insurance' rate cut policy of 75 basis points, the equity market has been 'lights out' as the S&P 500 has posted a 12-month forward return of ~23%, on average."
- Raymond James
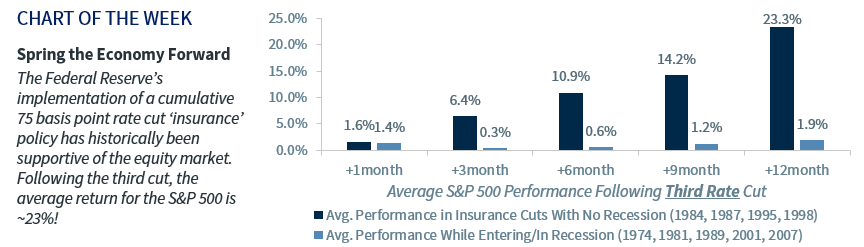
(H/T G. O'Brien)
That's the good news.
However, before you go jumping in with both feet, there are a couple of points to be made.
Concerning the chart above, you have to decide whether the recent rate cuts by the Fed are "mid-cycle adjustments" or "cuts entering a recession." While most people only notice the tall black bars, given we are in the longest economic expansion in history, the short-blue bars may be important.
Again, since bear markets/recessions NEVER occur when everyone is expecting them, the breakout to new highs is exactly what is needed to "suck investors" back into the market at the potential peak. This is how bear markets have always begun in history.
On a shorter-term basis, whether you are bullish or bearish, the market is now more than 6% above its 200-dma. These more extreme price extensions tend to denote short-term tops to the market, and waiting for a pullback to add exposures has been prudent.
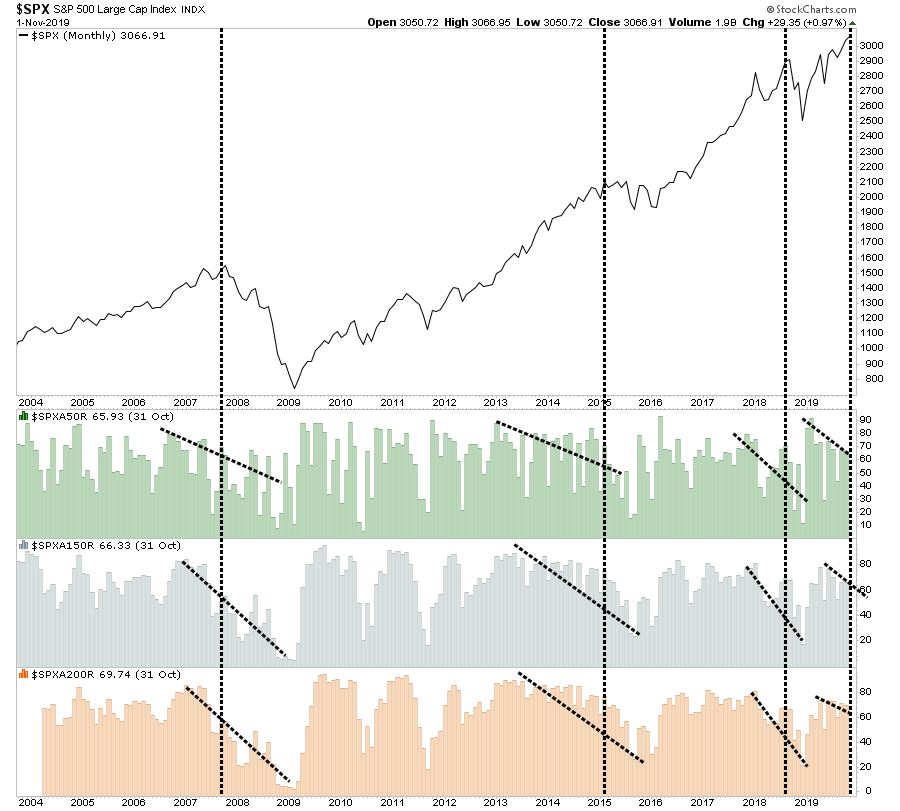
The other concern is the weakness in overall participation in the market. Despite the markets pushing to all-time highs, the number of stocks trading above their respective 50-, 150-, and 200-dma's remain in downtrends. These negative divergences have preceded short to intermediate-term corrections in the past.
How To Play It
As we have been noting over the last month, with the Fed's more accommodative positioning, we continue to maintain a long-equity bias in our portfolios currently. We have reduced our hedges, along with some of our more defensive positioning. We are also adding opportunistically to our equity allocations, even as we carry a slightly higher than normal level of cash along with our fixed income positioning.
We also realize that "all good things do come to an end." While we are currently "riding the bull," we are simply waiting for the "8-second buzzer" to prepare for our dismount. (That's a Texas rodeo thing if you don't know the reference.)
Therefore, make sure you have stop-losses in place on all positions and be prepared to execute accordingly. The worst thing investors consistently do over time is to turn a "winner" into a "loser" before they eventually sell. (And they always sell.)
While you will certainly reduce your tax liability with this method, it is not a strategy by which you will increase your wealth. Being "rich on paper" and having "cash in the bank" are two ENTIRELY different things.
The Fed Gives Up On Inflation
On Wednesday, the Fed cut rates for the third time this year, which was widely expected by the market.
What was not expected was the following statement.
"I think we would need to see a really significant move up in inflation that's persistent before we even consider raising rates to address inflation concerns."
- Jerome Powell 10/30/2019
The statement did not receive a lot of notoriety from the press, but this was the single most important statement from Federal Reserve Chairman Jerome Powell so far. In fact, we cannot remember a time in the last 30 years when a Fed Chairman has so clearly articulated such a strong desire for more inflation.
Why do we say that? Let's dissect the bolded words in the quote for further clarification.
- "really significant" - Powell is not only saying that they will allow a significant move up in inflation but going one better by adding the word significant.
- "persistent" - Unlike the prior few Fed Chairman who claimed to be vigilant towards inflation, Powell is clearly telling us that he will not react to inflation that is not only well beyond a "really significant" leap from current levels, but a rate that lasts for a period of time.
- "even consider" - If inflation is not only a really significant increase from current levels and stays at such levels for a while, they will only consider raising rates to fight inflation.
We are stunned by the choice of words Powell used to describe the Fed's view on inflation. We are even more shocked that the markets or media are not making more of it.
Maybe, they are failing to focus on the three bolded sections. In fact, what they probably think they heard was: I think we would need to see a move up in inflation before we consider raising rates to address inflation concerns. Such a statement would have been more in line with traditional "Fed-speak."
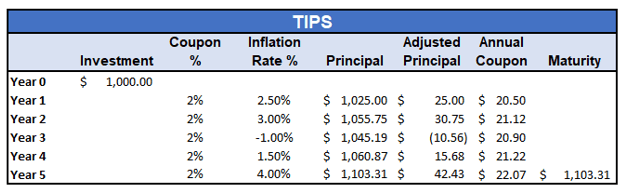
We have published an article for our RIAPro subscribers, which discusses our views on using Treasury Inflation-Protected Securities (TIPS), a hedge against Jerome Powell and the Fed getting inflation, or worse, failing and fostering deflation.
There is another far more insidious message in Chairman Powell's statement which should not be dismissed.
The Fed just acknowledged they are caught in a "liquidity trap."
What Is A Liquidity Trap
What Is A Liquidity Trap
Here is the definition:
"A liquidity trap is a situation described in Keynesian economics in which injections of cash into the private banking system by a central bank fail to lower interest rates and hence fail to stimulate economic growth. A liquidity trap is caused when people hoard cash because they expect an adverse event such as deflation, insufficient aggregate demand, or war. Signature characteristics of a liquidity trap are short-term interest rates that are near zero and fluctuations in the monetary base that fail to translate into fluctuations in general price levels."
Let's take a moment to analyze that definition by breaking it down into its overriding assumptions.
- Are the central banks globally injecting liquidity into the financial system? Yes.
- Has the increase in liquidity into the private banking system lowered interest rates? Yes.
The chart below shows the increase in the Federal Reserve's balance sheet, since they are the "buyer" of bonds, which in turn increases the excess reserve accounts of the major banks, as compared to the 10-year Treasury rate.
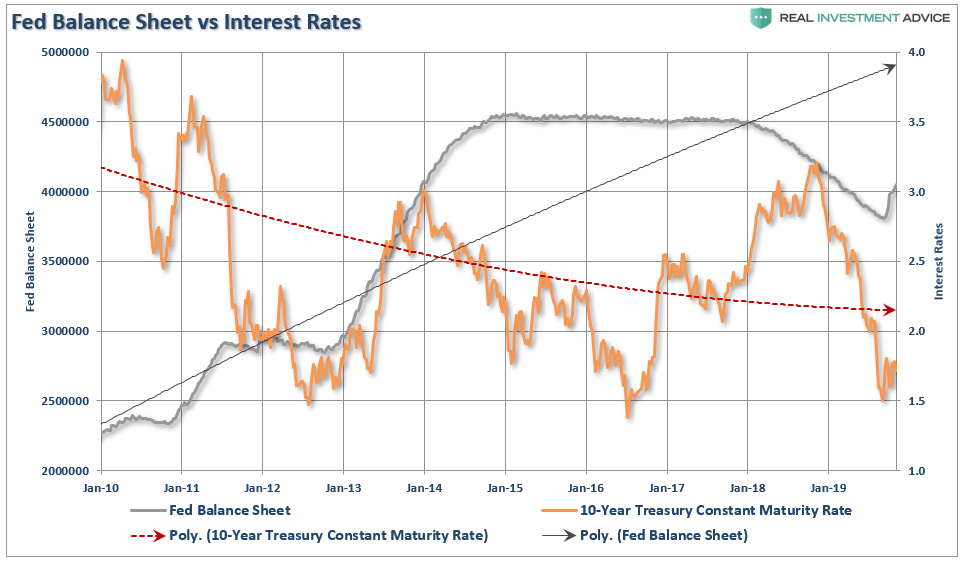
Of course, that money didn't flow into the U.S. economy, it went into financial assets.
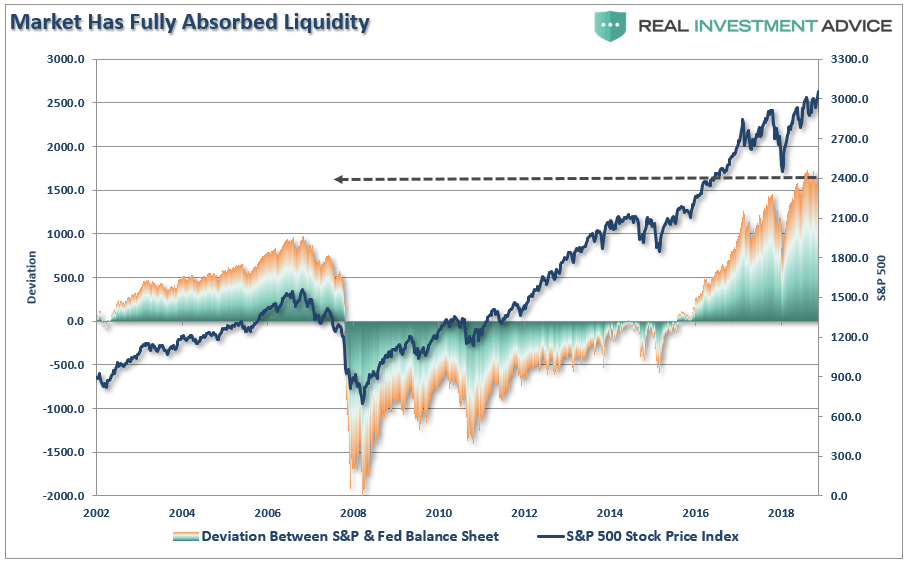
With the markets having absorbed the current levels of accommodation, it is not surprising to see the markets demanding more. (The chart below compares the deviation between the S&P 500 and the Fed's balance sheet. That deviation is the highest on record.)
While, in the Fed's defense, it may be clear the Fed's monetary interventions have suppressed interest rates, I would argue their liquidity-driven inducements have not done much to support durable economic growth.
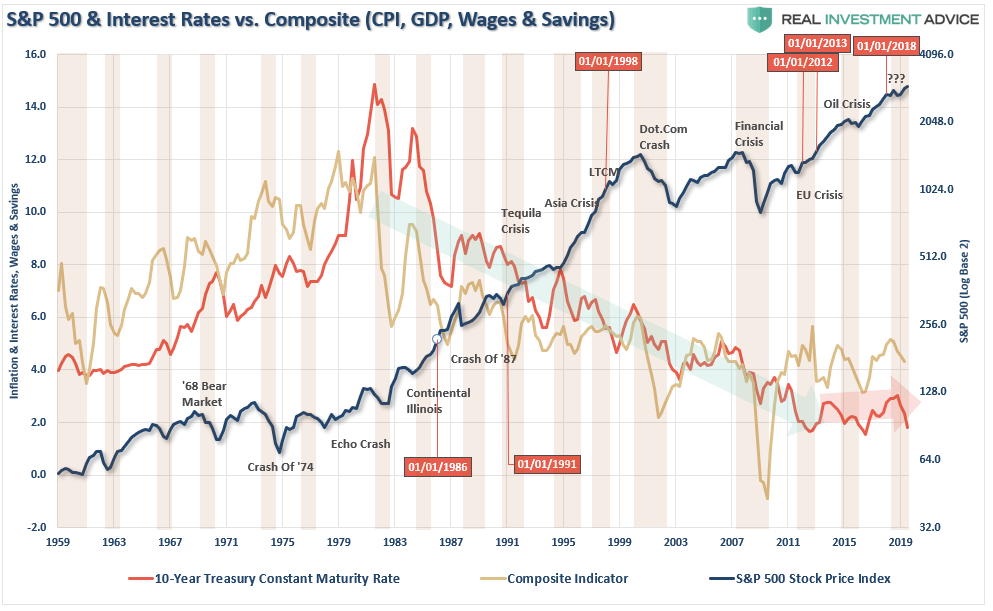
Interest rates have not been falling just since the monetary interventions began - it began four decades ago as the economy began a shift to consumer credit leveraged service society.
The chart below shows the correlation between the decline of GDP, Interest Rates, Savings, and Inflation.
Interest rates have not been falling just since the monetary interventions began - it began four decades ago as the economy began a shift to consumer credit leveraged service society.
The chart below shows the correlation between the decline of GDP, Interest Rates, Savings, and Inflation.
In reality, the ongoing decline in economic activity has been the result of declining productivity, stagnant wage growth, demographic trends, and massive surges in consumer, corporate and, government debt.
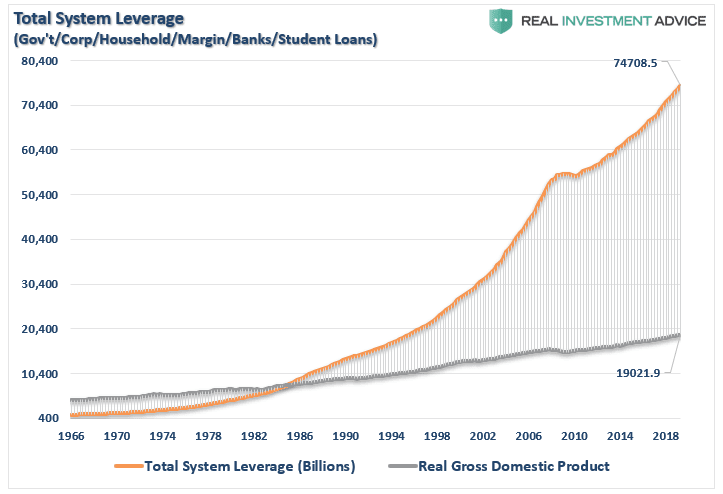
For these reasons, it is difficult to attribute much of the decline in interest rates and inflation to monetary policies when the long-term trend was clearly intact long before these programs began.
While an argument can be made that the early initial rounds of QE contributed to the bounce in economic activity, there were several other more important supports during the latest economic cycle.
- Economic growth ALWAYS surges after recessionary weakness. This is due to the pent up demand that was built up during the recession and is unleashed back into the economy when confidence improves.
- There were multiple bailouts in 2009 from "cash for houses", "cash for clunkers", to direct bailouts of the banking system and the economy, etc., which greatly supported the post-recessionary boost.
- Several natural disasters from the "Japanese Trifecta" which shut down manufacturing temporarily, to massive hurricanes and wildfires, provided a series of one-time boosts to economic growth just as weakness was appearing.
- A massive surge in government spending which directly feeds the economy.
The Fed's interventions from 2010 forward, as the Fed became "the only game in town," seems to have had little effect other than a massive inflation in asset prices.
The evidence suggests the Federal Reserve has been experiencing a diminishing rate of return from their monetary policies.
Welcome To The U.S. Of Japan
The evidence suggests the Federal Reserve has been experiencing a diminishing rate of return from their monetary policies.
Welcome To The U.S. Of Japan
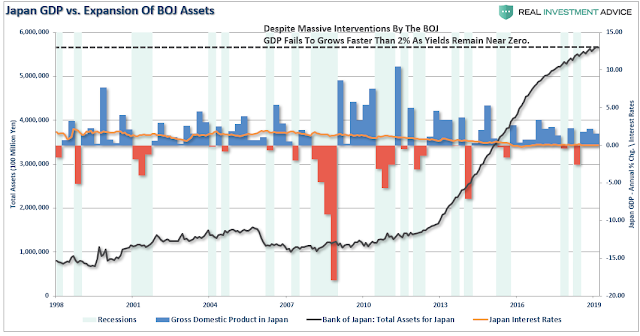
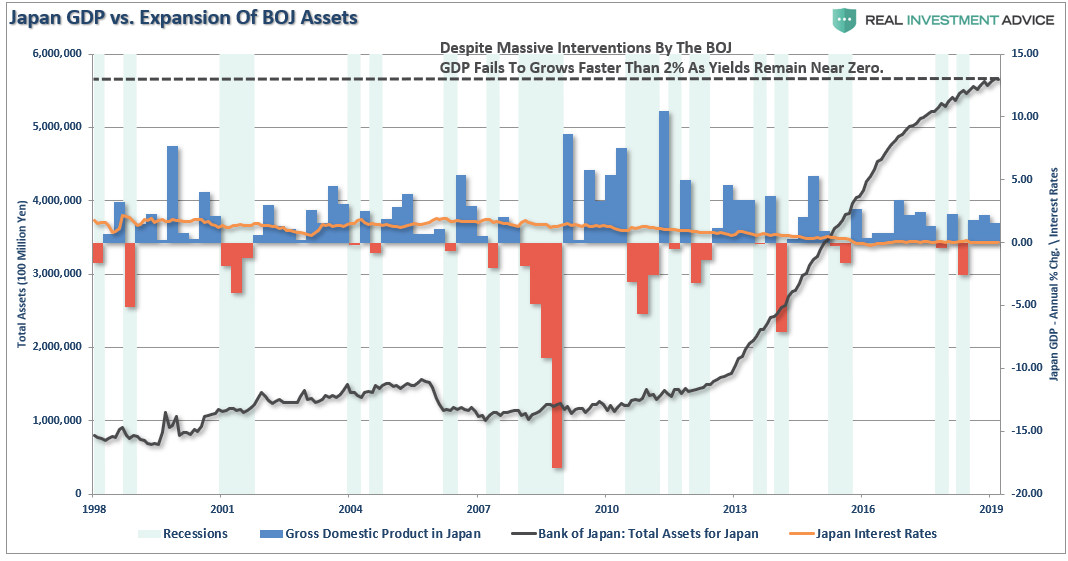
The Federal Reserve is caught in the same "liquidity trap" that has been the history of Japan for the last three decades. With an aging demographic, which will continue to strain the financial system, increasing levels of indebtedness, and unproductive fiscal policy to combat the issues restraining economic growth, it is unlikely monetary interventions will do anything other than simply continuing the boom/bust cycles in financial assets.
The chart below shows the 10-year Japanese Government Bond yield as compared to their quarterly economic growth rates and the BOJ's balance sheet. Low interest rates, and massive QE programs, have failed to spur sustainable economic activity over the last 20 years.
Currently, 2-, 5-, and 10-year Japanese Government Bonds all have negative real yields.
The reason you know the Fed is caught in a "liquidity trap" is because they are being forced to lower rates due to economic weakness.
It is the only "trick" they know.
Unfortunately, such action will likely have little, or no effect, this time due to the current stage of the economic cycle.
If interest rates rise sharply, it is effectively "game over" as borrowing costs surge, deficits balloon, housing falls, revenues weaken and consumer demand wanes. It is the worst thing that can happen to an economy that is currently remaining on life support.
The U.S., like Japan, is clearly caught in an on-going "liquidity trap" where maintaining ultra-low interest rates are the key to sustaining an economic pulse. The unintended consequence of such actions, as we are witnessing in the U.S. currently, is the ongoing battle with deflationary pressures.
The lower interest rates go - the less economic return that can be generated. An ultra-low interest rate environment, contrary to mainstream thought, has a negative impact on making productive investments and risk begins to outweigh the potential return.
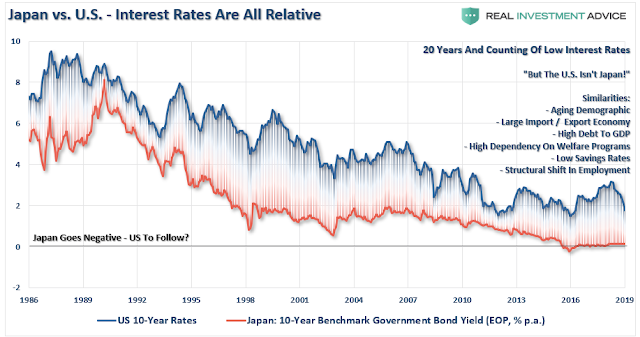
Most importantly, while there are many calling for an end of the "Great Bond Bull Market," this is unlikely the case. As shown in the chart below, interest rates are relative globally. Rates can't rise in one country while a majority of economies are pushing negative rates. As has been the case over the last 30 years, so goes Japan, so goes the U.S.

Simply pulling forward future consumption through monetary policy continues to leave an ever-growing void in the future that must be filled. Eventually, the void will be too great to fill.
But hey, let's just keep doing the same thing over and over again, which hasn't worked for anyone as of yet, and continue to hope for a different result.
What's the worst that could happen?
See you next week.
THE REAL 401k PLAN MANAGER
A Conservative Strategy For Long-Term Investors
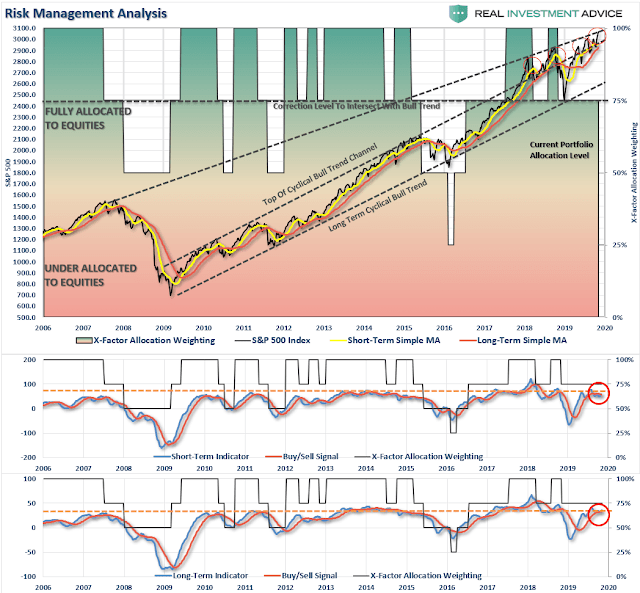
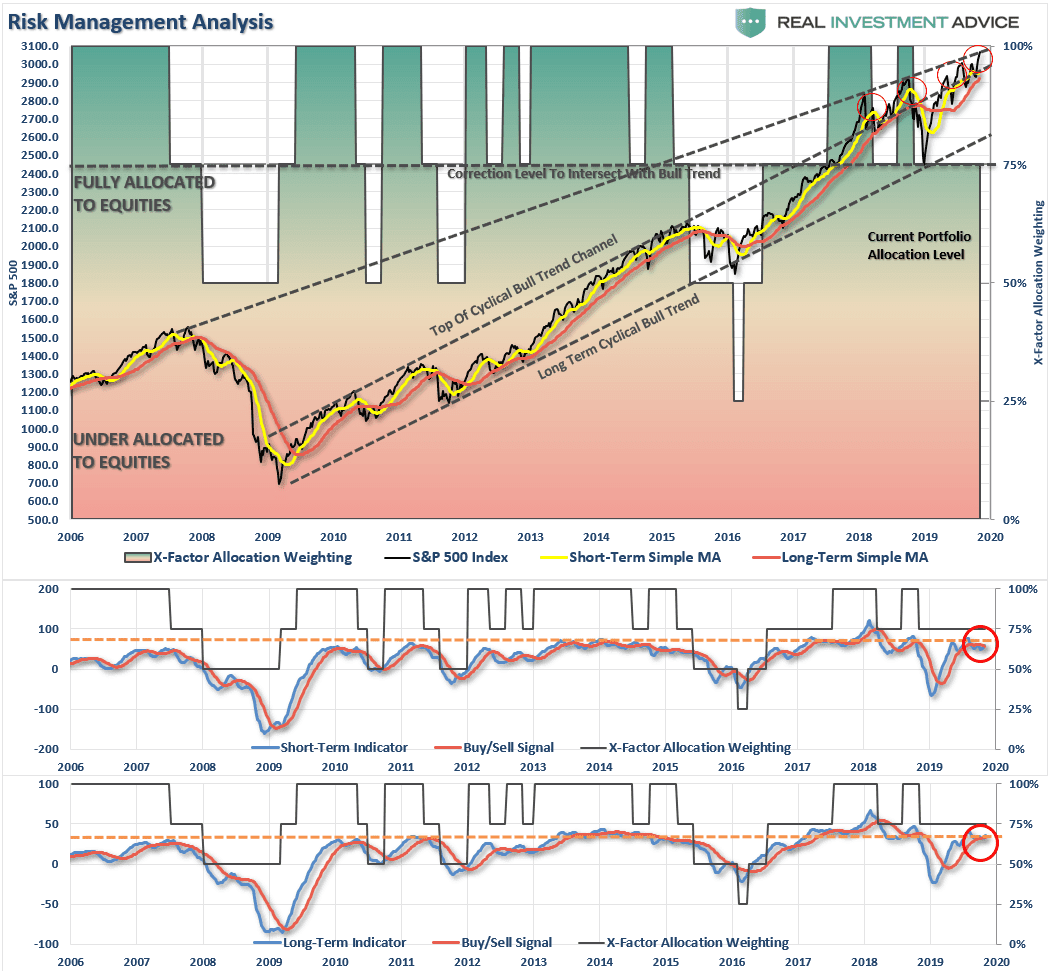
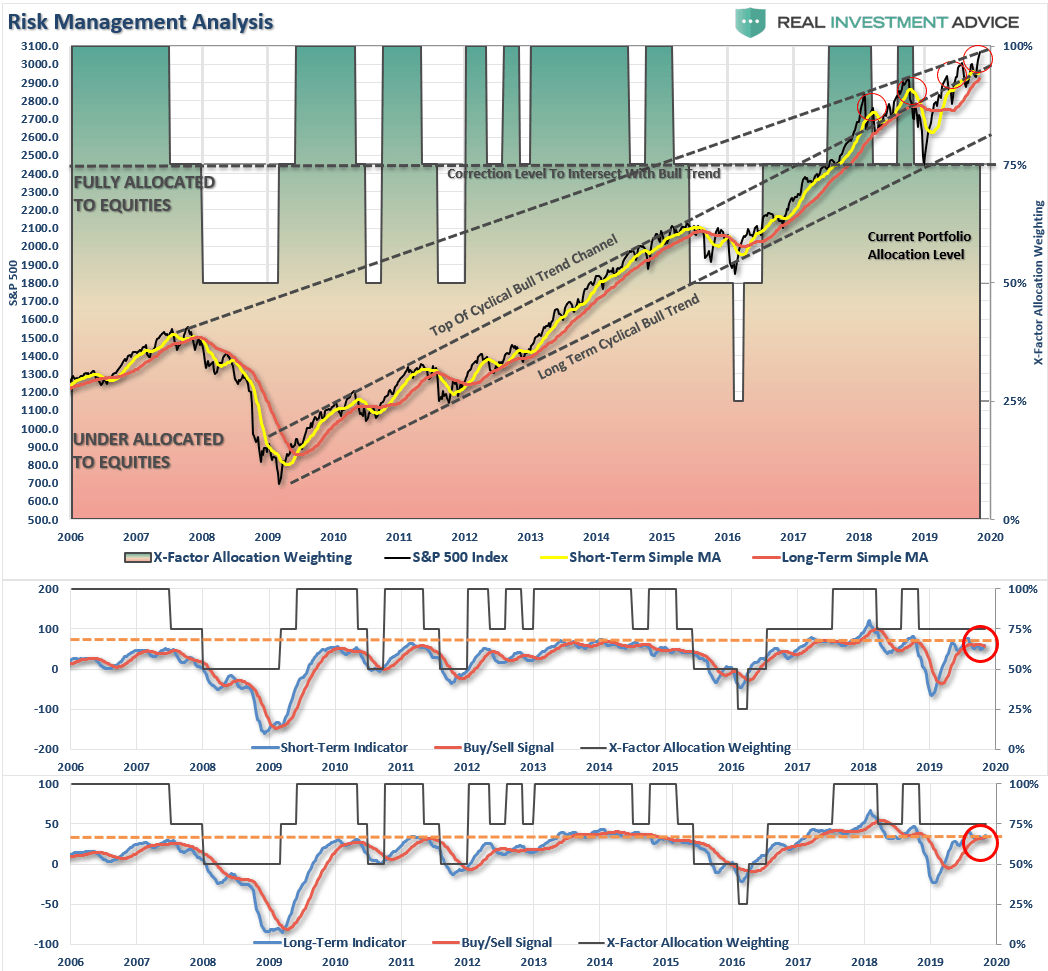
There are 4 steps to allocation changes based on 25% reduction increments. As noted in the chart above, a 100% allocation level is equal to 60% stocks.
I never advocate being 100% out of the market as it is far too difficult to reverse course when the market changes from a negative to a positive trend.
Emotions keep us from taking the correct action.

Given the "bulls" have the upper-hand heading into the end of the year, we are increasing our equity exposure slowly. Given the markets tend to pull back just before Thanksgiving, and during the second week of December, we will have a better opportunity increase allocations if we are patient.
We need to see a bit of pullback to reduce the rather excessive extension of the market above the 200-dma, but a pullback that doesn't break back below the previous highs. Such action will confirm the breakout and suggest our target of 3,300 is attainable.
However, please direct your attention to the chart above.
The market is once again pushing above its cyclical bullish trendline and testing the cycle trend highs from 2007. This has been a point of failure for the markets each time previously, so some caution is advised until a breakout is confirmed.
- If you are overweight equities - Hold current positions.
- If you are underweight equities - rebalance portfolios to target weights
- If at target weight equities, hold positioning and look for a pullback to increase exposure.
Understand this increase could well be short-lived. The markets have been in a very long consolidation process and the breakout to the upside is indeed bullish. However, we must counter-balance that view with the simple reality we are VERY long in the current economic and market cycle which is where "unexpected" events have destroyed capital in the past.
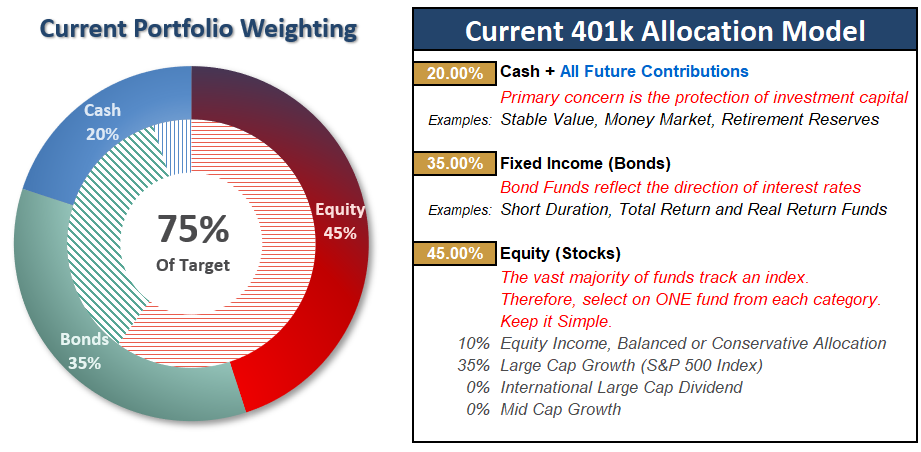
Current 401-k Allocation Model
The 401k plan allocation plan below follows the K.I.S.S. principle. By keeping the allocation extremely simplified it allows for better control of the allocation and a closer tracking to the benchmark objective over time. (If you want to make it more complicated you can, however, statistics show that simply adding more funds does not increase performance to any great degree.)
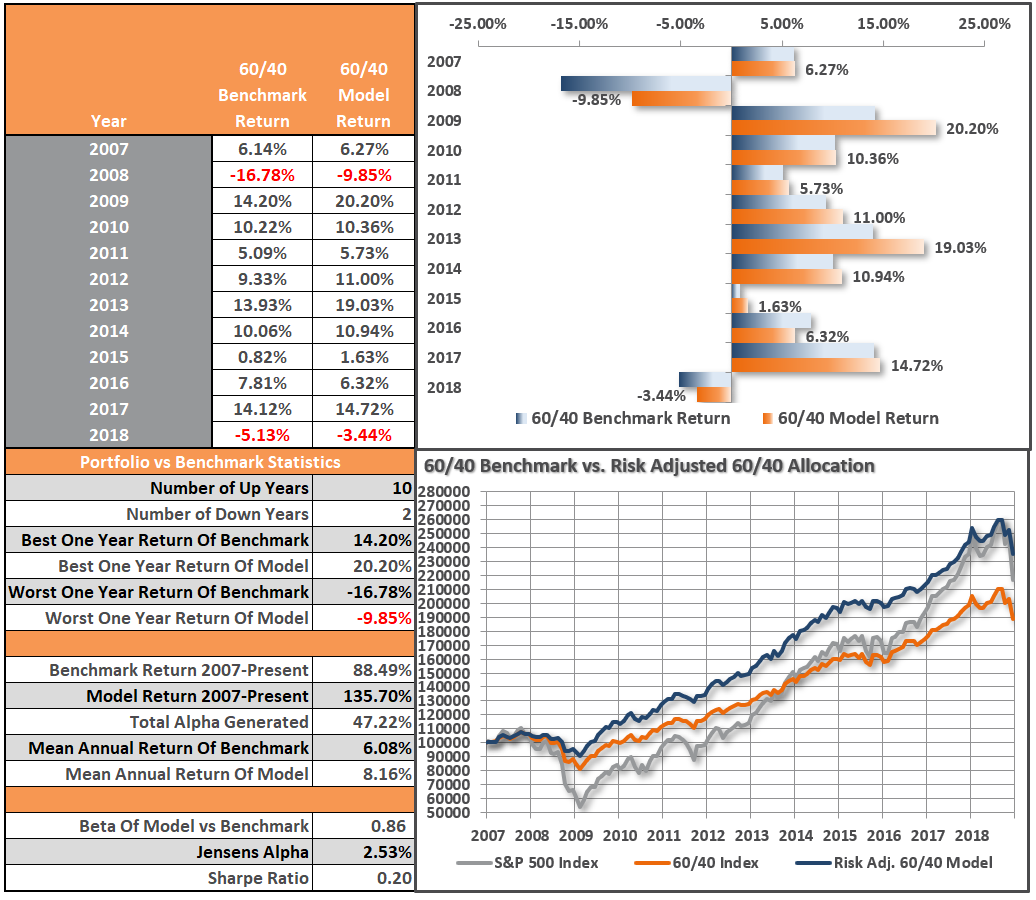
Model performance is based on a two-asset model of stocks and bonds relative to the weighting changes made each week in the newsletter.
This is strictly for informational and educational purposes only and should not be relied upon for any reason. Past performance is not a guarantee of future results. Use at your own risk and peril.
0 comments:
Publicar un comentario