by: Victor Dergunov
Summary
- It's been quite some time since the U.S. has experienced a recession.
- Unfortunately, investors may not have to wait much longer, as the S&P 500 and stocks in general are likely in the early stages of a bear market already.
- Inverting yields, worsening economic data, U.S./China trade tensions, high stock valuations, increased demand for safe-haven assets, and bearish sector rotation are clear red flags that a recession is approaching.
- Moreover, the S&P 500's technical image appears to be deteriorating, and if the SPX goes below 2,725 we are likely in a bear market already.
.

Oh Yes! The Recession Is Coming
It’s been quite some time since the S&P 500 (SP500) has been in a bear market, and the U.S. has not experienced a recession in over 10 years now. In fact, we are now in the longest economic expansion in U.S. history, even surpassing the 1990’s bull market that eventually led markets to the pinnacle of the dotcom bubble.
S&P 500 Long-Term Chart
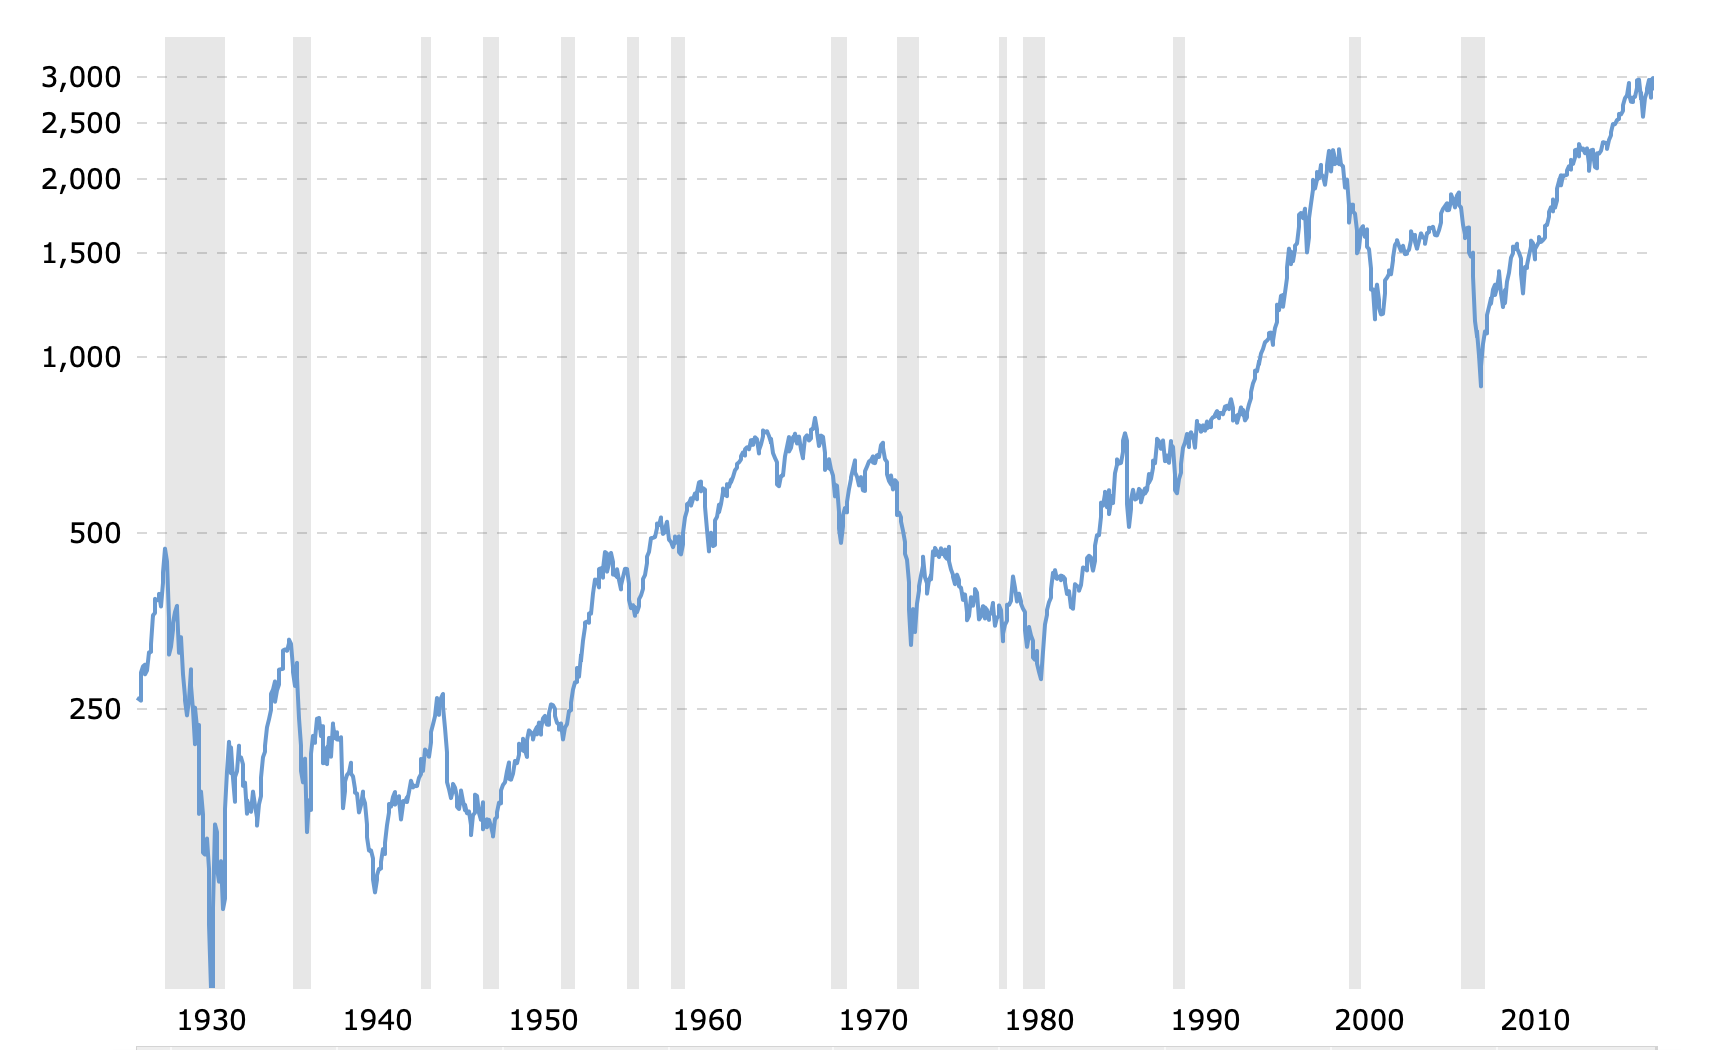 Source:MacroTrends.com
Unfortunately, it appears that market participants may not have to wait much longer, as there are clear recessionary clouds on the horizon. Inverting yields, negative interest rates, weakening economic data, rising inflation, unintended consequences from the U.S./China trade war, high stock valuations, and other detrimental economic factors may be too much for the Fed and for the U.S. economy to handle.
Therefore, unless several key constructive economic and monetary factors materialize relatively quickly, a recession coupled with a grizzly bear market in the S&P 500 and in stocks in general seems extremely likely within the next 6-18 months. Furthermore, bear markets typically begin around 6 months before an official recession is recognized, thus we may already be in the early stages of a bear market in stocks.
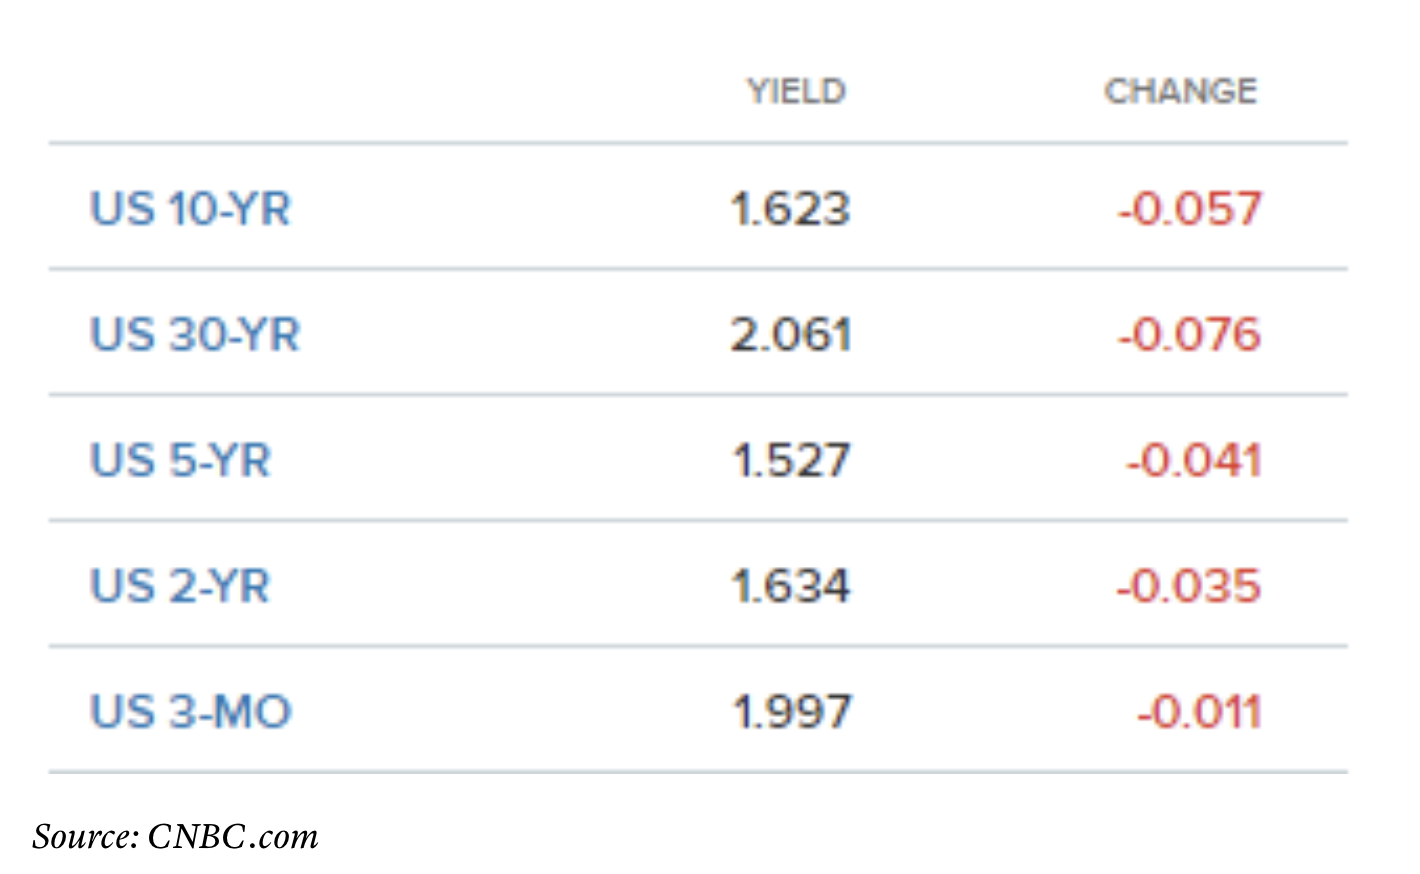
Yields Inverting at an Unprecedented Level
Treasury yields are not just tightening, they are inverting, and they are inverting at an unprecedented level. In fact, the 2-year just topped the 10-year, the 3-month is yielding more than the 30-year, and the 30-year Treasury is at an all-time low, and is likely about to break below 2%.
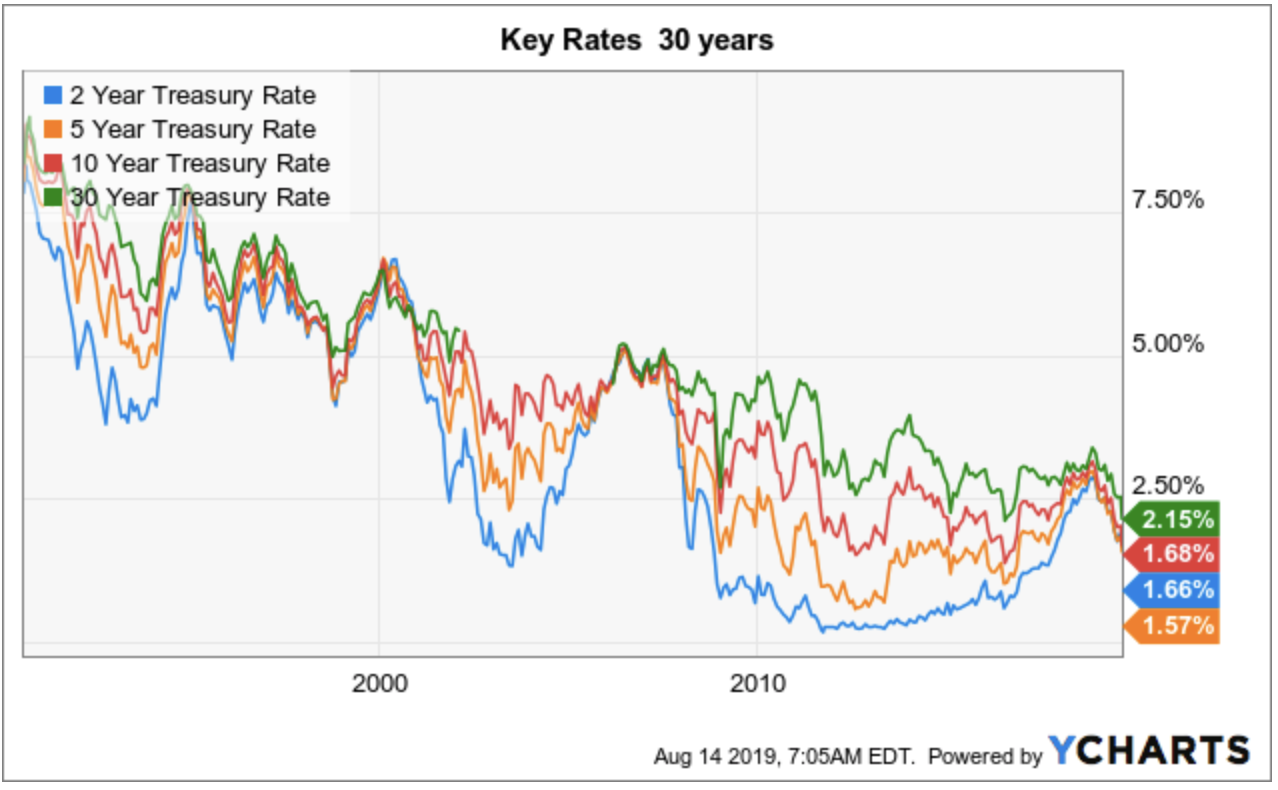
Key Rates
U.S 30-Year Treasury Long-term Chart
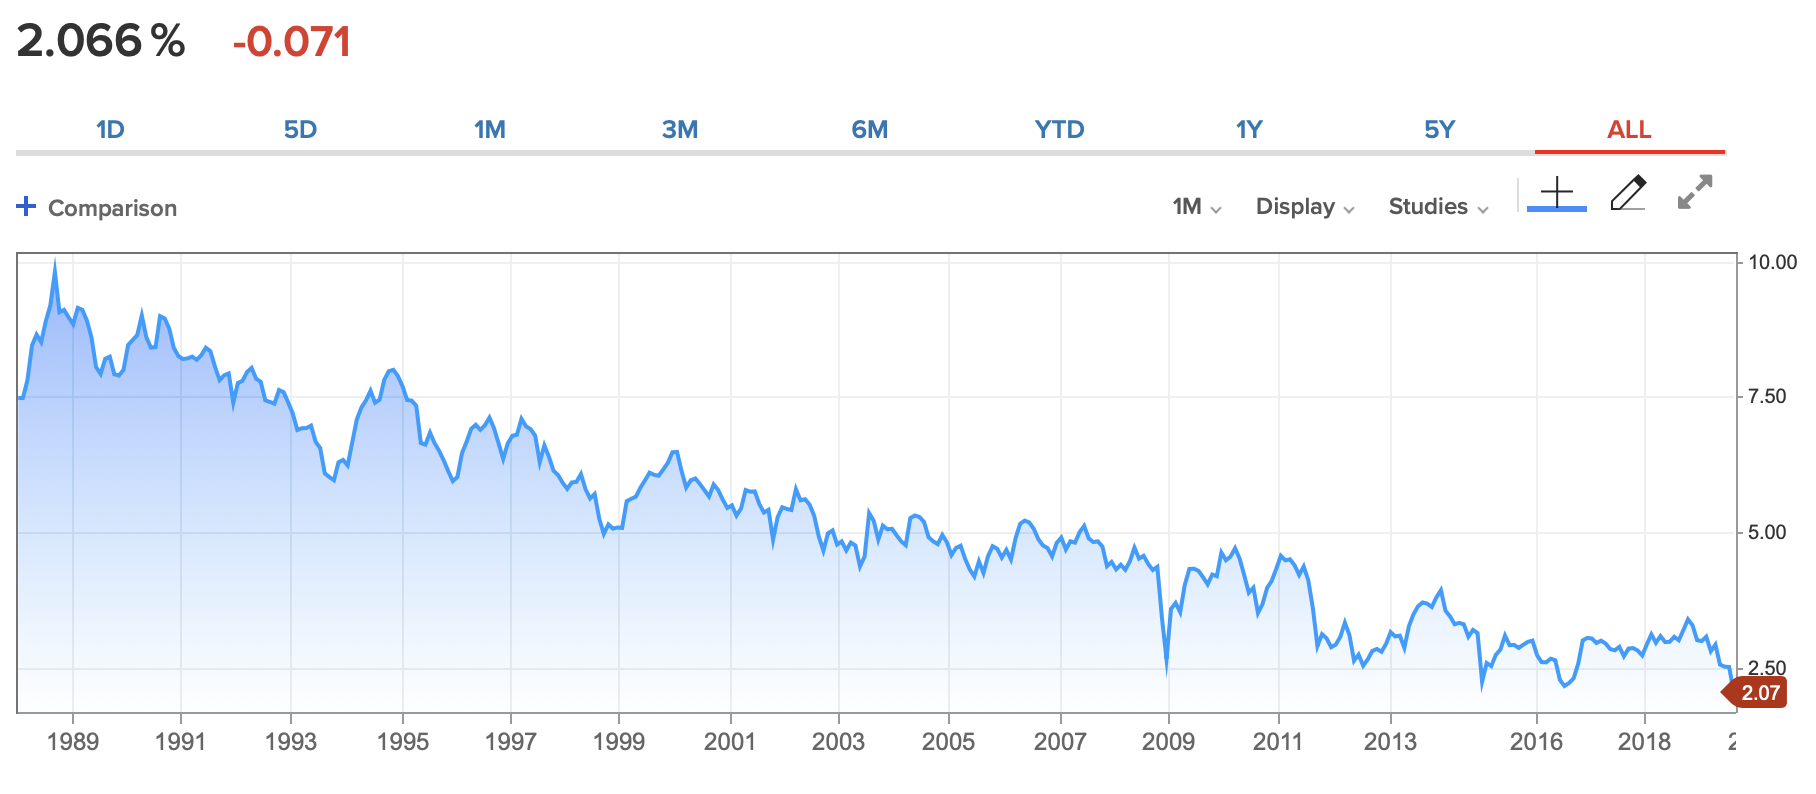
Source: CNBC.com
Why this is happening
One of the reasons is that the Fed is embarking on a new easing path, that will likely be a multi-year process. Bond investors understand that the Fed will bring longer term rates lower, and are rushing in to lock in any kind of yield they can before rates go even lower, or negative.
The other reason is that demand for longer-term treasuries is picking up because more market participants are expecting a recession to materialize in the near future. Thus, they are moving capital into “safe-haven” assets like bonds.
Let’s look at prior instances throughout recent history when yields have inverted.
If we look at a 30-year chart we can see a clear correlation between yield curve inversions and recessions. Most recently we saw this phenomenon occur around the 2000 crash, right before the great recession of 2008, and now. If we go back further throughout recent history, we can see bond inversions occurring prior to recessions well before 2000 as well.
Also, I want to point out that overall rates are on a never-ending slope lower. In 2000 the rate inversion occurred around 6.25%, in 2007 it occurred at around 5%, and this most recent inversion is occurring at about 2.5%.
This indicates that due to the enormous amount of consumer and government debt in the U.S. the economy simply cannot function (expand) in a “normalized” rate environment. This also implies that this trend will likely continue and the “new normal economic environment” in the U.S. will likely resemble something that we see in Japan.
Extremely low, or negative rates, possibly on a prolonged or permanent basis, increased central bank intervention in the form of more QE, possibly even corporate bond, stock and ETF purchases, etc.
If you would like to read a detailed article about America’s impending debt crisis and how it correlates with what we are seeing occur in markets now, I strongly suggest you read my “America’s Impending Debt Crisis” article here. The “new normal economic reality” in the U.S. may end up looking a lot like Japan’s economic situation in recent decades.
Negative Yields in the U.S. a Real Reality
There is now over $15 trillion in negative yielding government bonds around the globe. This is unprecedented, and once again points to that due to enormous amounts of government and consumer debt developed economies cannot expand without bringing key rates down to below zero.
 Image Source: CNBC.com
Moreover, Alan Greenspan recently said that “there is no barrier” to negative yields in the U.S.
This is a global trend now, and the U.S. will not only get sucked into it, but in time may become the leader in zero or negative rate policy.
Weakening Economic Data
Another troubling factor that is pointing to an upcoming recession is the weakening economic data in the U.S. (I will be discussing data primarily in the U.S. despite weakling data coming out of many nations, implying that a global recession may be on the horizon, not one just in the U.S.)
Just over the past few weeks we’ve seen ISM manufacturing employment, and ISM manufacturing PMI for July come in substantially worse than expected. ISM manufacturing employment came in at just 51.7 vs the expected 53.4 figure and ISM manufacturing PMI came in at 51.2, well below the expected 52 figure.
At the same time, inflation is on the rise, as average hourly earnings increased by 0.3% MoM in July vs the expected 0.2% increase, and average hourly earnings increased by 3.2% YoY vs the expected 3.1% number.
Now, you may say Victor, this is good news, it appears that American workers are earning more than they did a year ago, so this is good for the economy. Yet, if we look at core CPI numbers, we see a similar trend, as core CPI MoM came in at 0.3% vs the expected 0.2%, and YoY core CPI increased by 2.2%, vs the expected 2.1%.
In other words, prices are rising, inflation is increasing, and wage growth is unlikely to keep up with the rise in inflation in the current and upcoming economic environment. This suggests that prices on goods will continue to rise at a faster pace than wage growth, ultimately putting pressure on consumer confidence and spending.
As the U.S. economy is about 70% consumer based, this trend could reflect very poorly on GDP growth and will likely help push the U.S. into a recession within the next 6-18 months.
In fact, we are already seeing this occur in the consumer confidence index CCI as it is down to about 100.4 from its peak of around 100.9 at the start of 2018.
CCI 5-Year Chart
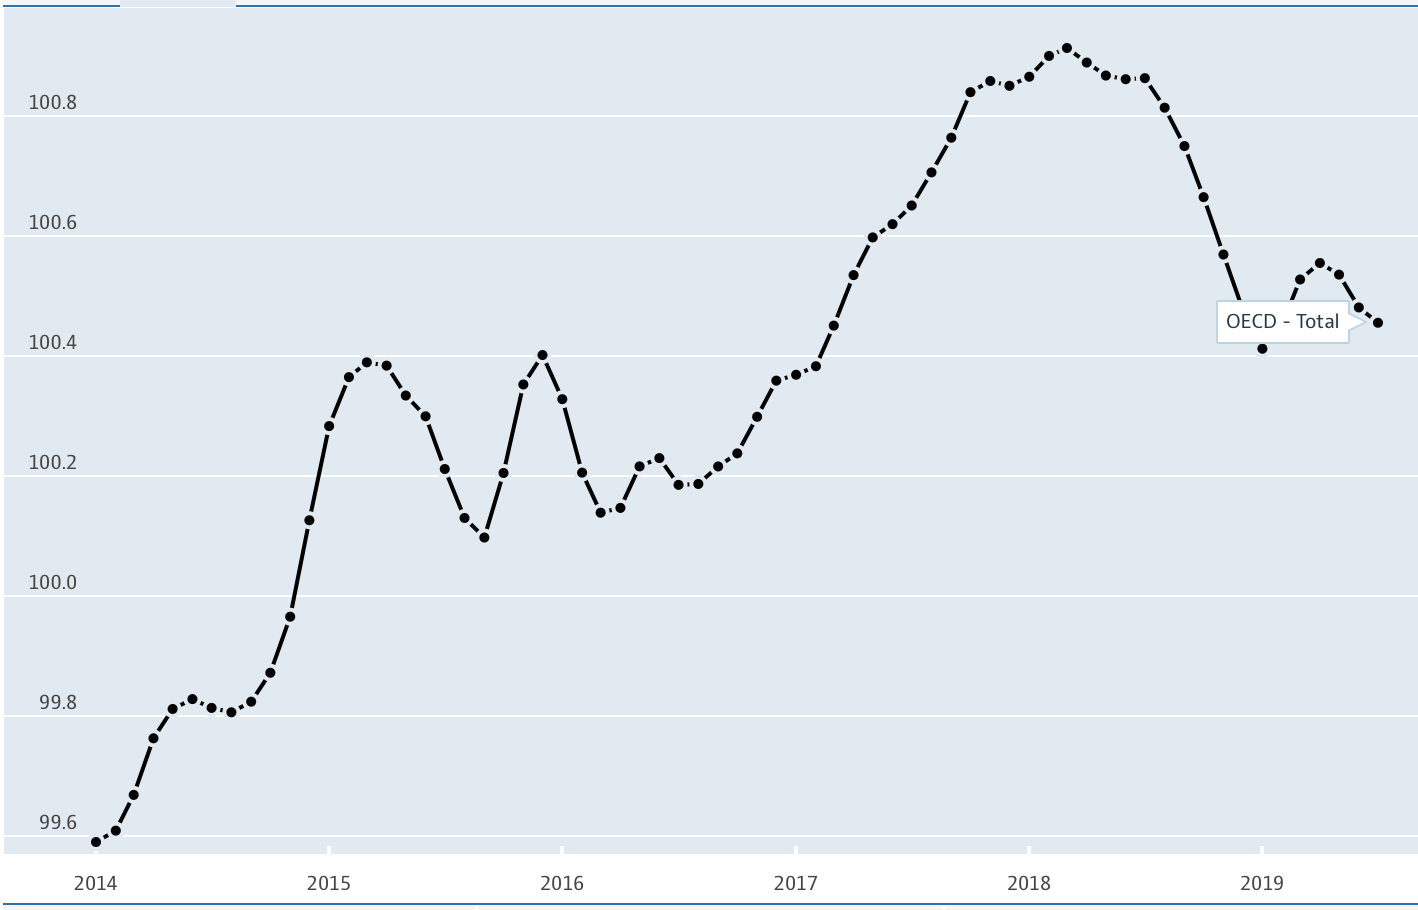 Image Source: OECD.com
You know what else is troubling about the current trend in consumer confidence?
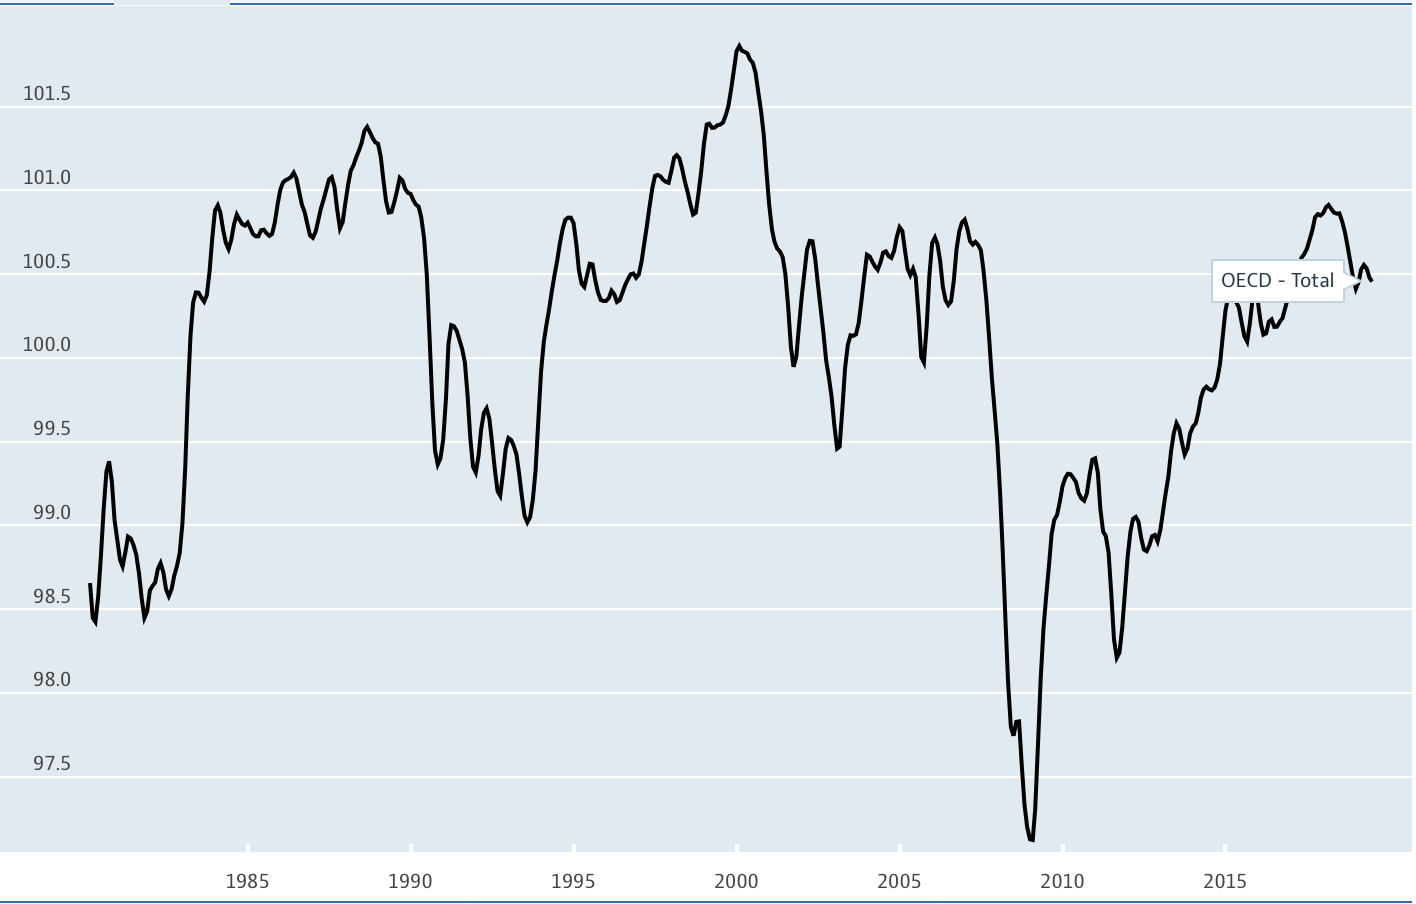
It is that just about every prior peak has coincided with a recession. The CCI peaked in the late 1980s right around the time of Black Monday in 1987. Next we saw a major peak right around the time the dotcom bubble burst in 2000, we saw it peak around 2007, right before the great recession, and we may have seen it peak in early 2018, suggesting that a recession is likely a lot closer than many market participants anticipate.
CCI Long-Term Chart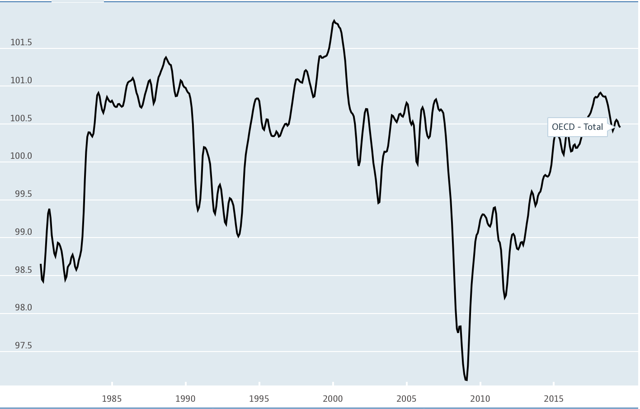
Other Concerning Leading Indicators
An Apparent Problem in Housing
Now, let’s move on to housing. New home sales for June came in lower than expected, 646K vs 660K.
Existing home sales also missed estimates for June, coming in at 5.27 million vs an expected 5.35 million.
Existing home sales fell by 1.7% MoM instead of an expected drop of just 0.2%.
Building permits were disastrous in June, 1.22 million, vs an expected 1.3 million, down by 6.1% MoM, vs an expected drop of just 0.1%.
The recent housing data is troubling, as it indicates a substantial slowdown in the residential real estate sector, a key forward looking indicator of the overall U.S. economy.
Freight and Trucking: Another Troubling Sign Of a Slowdown
I would also like to draw your attention to the apparentslowdown in the freight/trucking industry. The trucking industry is experiencing excess capacity and lower volumes. Now, this is likely in part due to higher tariffs on Chinese goods, and the situation may worsen if trade relations persist to deteriorate. Also, it’s not just trucking, similar phenomena can be observed in the shipping and in the railroad industry as well.
Unemployment Rate: Another Red Flag
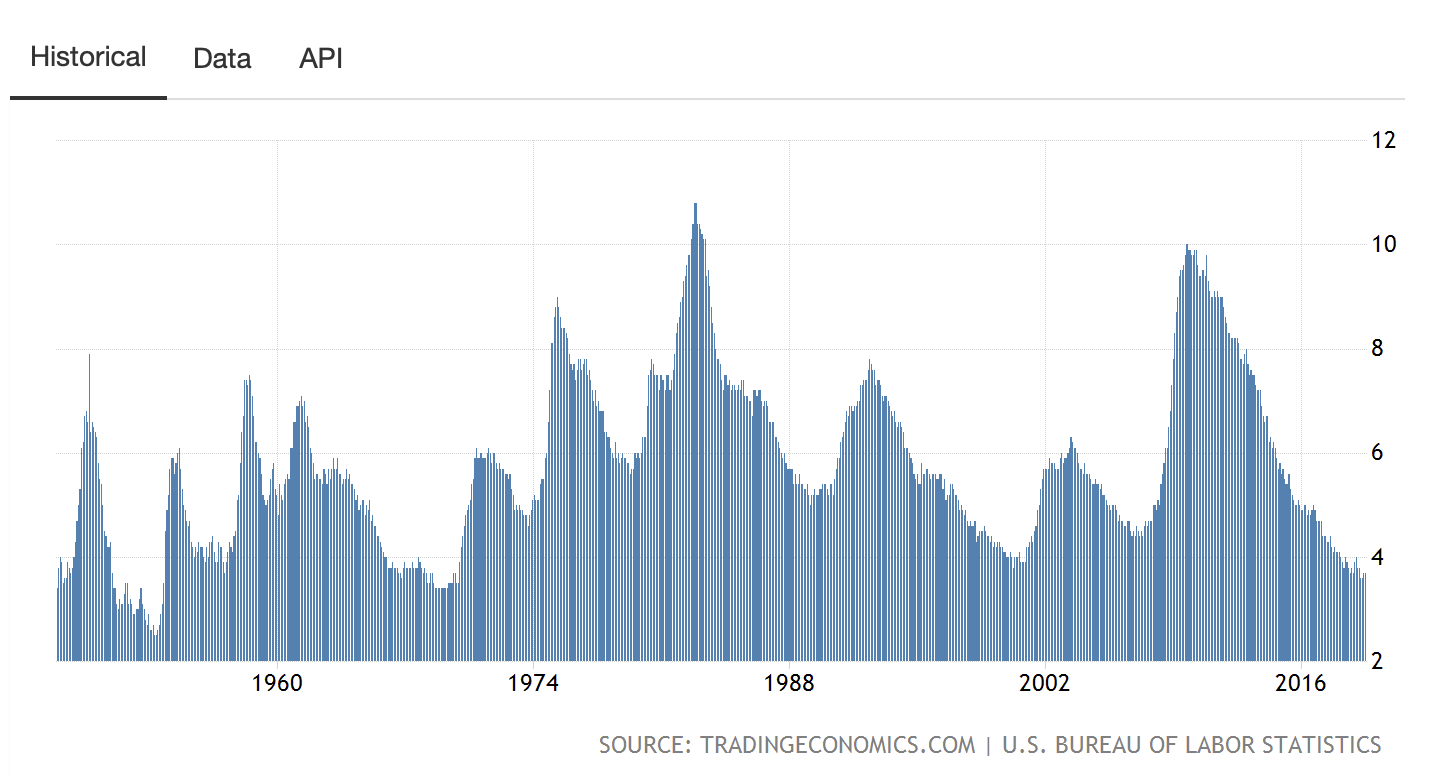
Let’s look at unemployment figures next. So, we keep hearing how the economy is doing great because unemployment is at or near a 40-year low, etc. This is true, the “official” unemployment numbers are the lowest we’ve seen in decades. However, if we take a closer look, it appears that the unemployment rate may have bottomed and is now starting to tick back up again.
U.S. Unemployment Rate 5-Year Chart
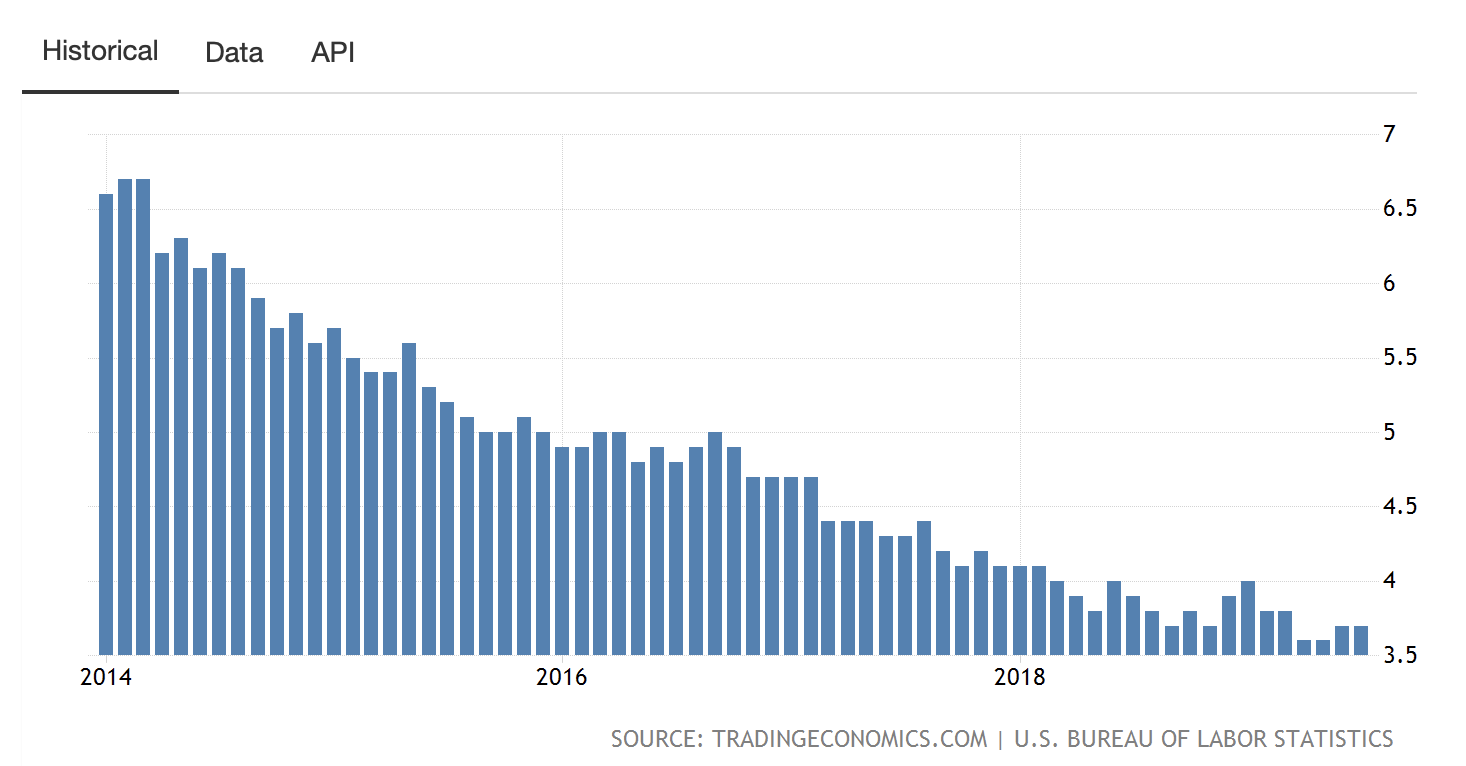 Source: TradingEconomics.com
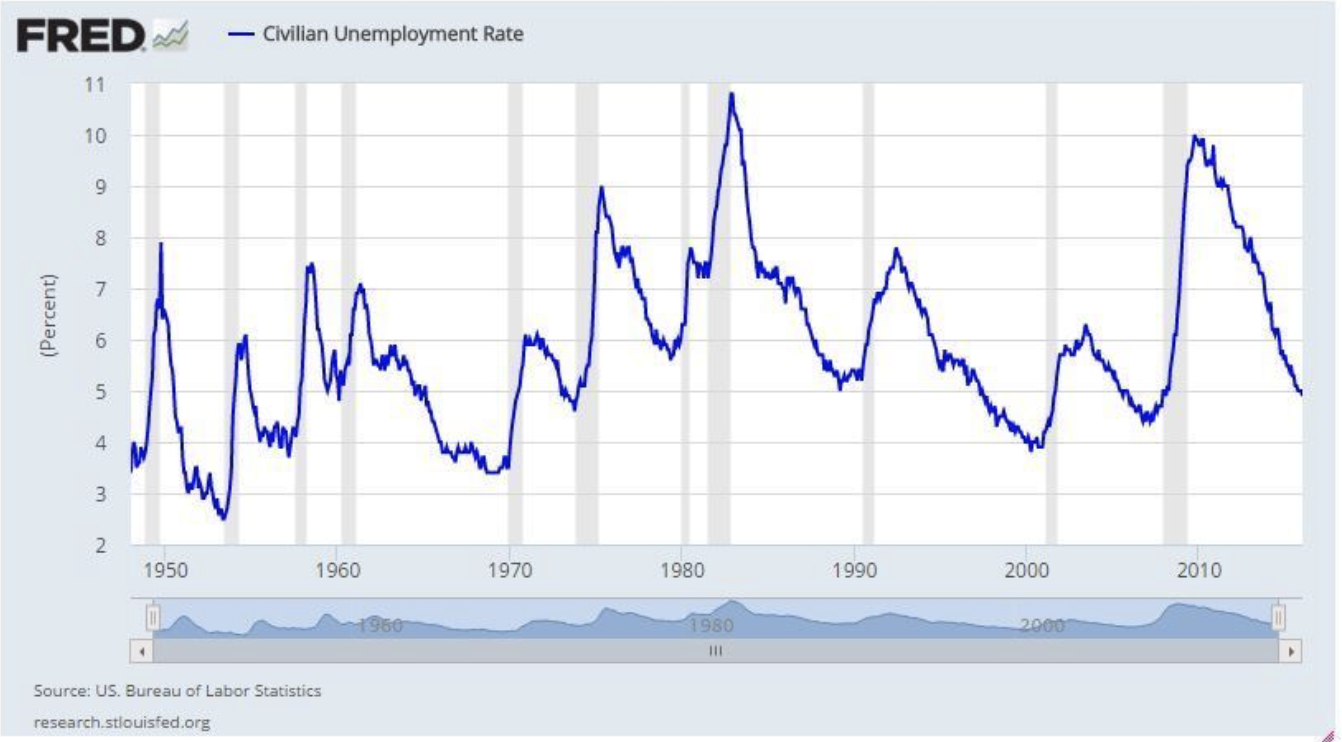
Moreover, if we take an even closer look, we will notice that just about every major bottom in the unemployment rate has preceded a recession. Just look at recent history; the unemployment rate bottoms and a recession begins in 1970, it bottoms and a recession begins in the late 80s, the unemployment rate bottoms again around 1999, and the dotcom bubble explodes, it bottoms around 2007/2008 and the great recession begins.
U.S. Unemployment Rate Long-Term Chart
Unemployment Rate Bottoms Correlations With Recessions 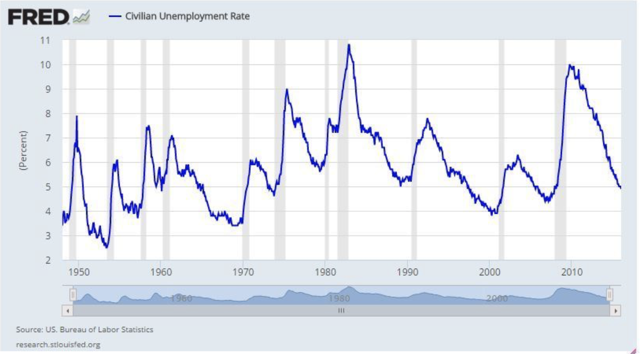 Source: Fred.com
 Source: Fred.com
We’ve seen the unemployment rate bottom at 3.6%, a multi-decade low, now it has ticked up to 3.7% for the last two months, and if this trend continues, why should this time be any different? The bottoming of unemployment is a great counter indicator and right now it is signaling that a recession is likely approaching, and is likely to arrive much sooner that many investors believe.
Corporate Profits May be Peaking
As we look at a chart of corporate profits we see a steady rise from when the Trump Administration took over in 2016. This was in part due to infrastructure spending projects as well as huge corporate tax cuts President Trump awarded corporate America, bringing down the corporate tax rate from 35% down to 21%.
However, much of the capital received from these giant tax cuts went to corporate buybacks, and not into long-term infrastructure growth projects as “intended”. Thus, the tax cuts had a very limited and transitory effect on overall growth in the U.S. economy. Instead, much of the excess capital went toward buying back shares, which made stock prices appreciate.
Now we may begin to see “hangover effect”, as the economy slows and corporate profits decline, the U.S. corporate sector may enter an earnings recession very soon.
U.S. Corporate Profits Since Trump Took Office

In fact, we saw a large QoQ decline in Q1, and while Q2 may provide slight YoY growth, corporate profits are likely to slide further due to China/U.S. trade tensions, and an overall economic slowdown around the globe.
Bearish Small-cap Performance
Another troubling factor suggestive of a bear market is the massive underperformance in the Russell 2000 index. Typically, small caps should be leading the way in a bull market but they are not. In fact, they are doing the opposite.
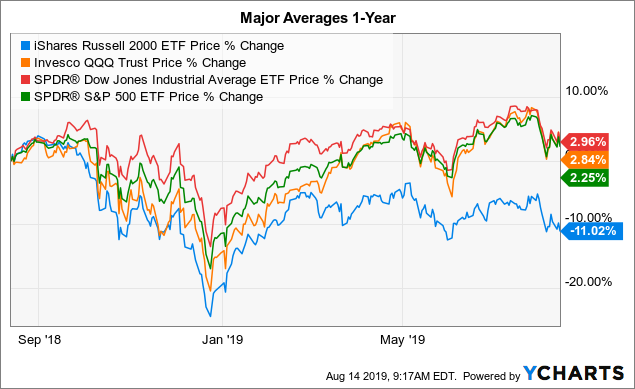 Data by YCharts
If we look at the Russell 2000 Index (IWM) performance vs other major market averages like the Nasdaq 100 (QQQ), DJIA (DIA), and SPX (SPY), we see a drastic underperformance on the Russell 2000’s part. While the three major averages are up between 2-3% over the past year, the small-cap index is lagging substantially, down by 11%.
Most companies in this index are smaller companies with mostly exposure to the U.S. market, which does not show a lot of faith in the future growth of the U.S. economy. The other major averages are comprised of multinational companies, but as economic growth around the globe continues to slow we are likely to see these averages crumble as well.
Bearish Sector Rotation
One of my favorite elements to observe is sector rotation, as it shows where investors expect the economy is headed. Much like with high demand for bonds, gold, and other “safe-haven” assets, investors tend to pile into “defensive sectors” like utilities, consumer staples, real estate, and healthcare. These are less cyclical sectors, their stocks typically pay decent and relatively stable dividends, and they usually hold up better than cyclical sectors during a bear market/recession.
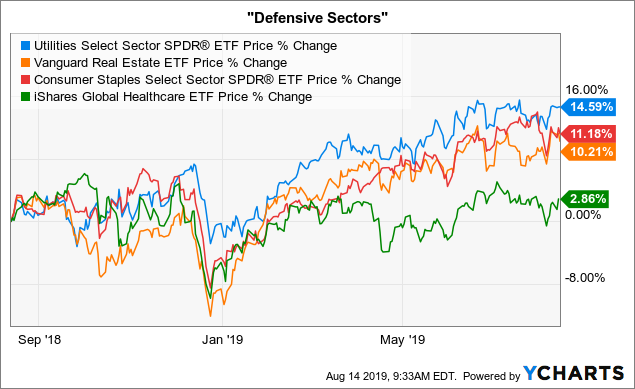 Data by YCharts
We see that outside of healthcare, the three of the most defensive sectors of the economy are up by double digits over the past year, substantially outperforming all major averages.
Additionally, utilities and real estate are at or near all-time highs, while consumer staples are not far behind.
Now, let’s see what is happening with the more cyclical sectors
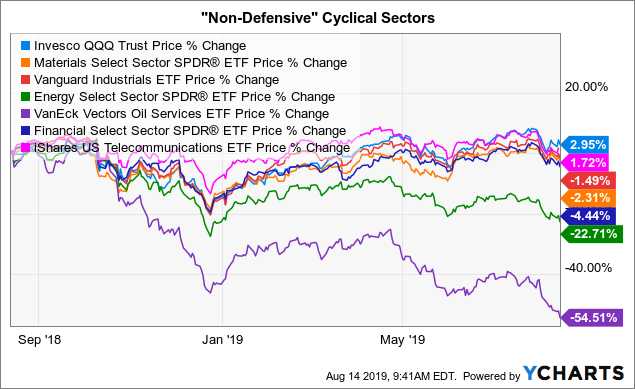
On the other hand, if we look at the more cyclical sectors they are mostly in the red for the year.
Except for technology and telecom services, all other sectors are down over the past year, with energy and oil services names leading the way. This further shows that investors have been rotating away from more economically sensitive, cyclical names and into safe-haven sectors like utilities, real estate, and staples.
However, there is one big problem. The “safe-haven” names have become drastically overbought and now appear to be dramatically overvalued. Let’s take utilities for example; these are now trading at around 23.54 times this year’s earnings estimates. This is quite expensive on a historical basis as these are low growth companies that typically trade in the 10-15 P/E ratio range. One could argue that they are overvalued by 50% or more right now.
Let’s look at real estate. Real estate is another sector that doesn’t typically trade at a high P/E ratio, yet it is currently trading at over 28 times this year’s EPS estimates. Consumer staples are trading at over 27 times this year’s EPS estimates. Healthcare is trading at 29 times this year’s EPS estimates.
The point is that investors have piled into these “safe” names, but have bid up their stock prices so high that they are trading at valuations you would typically see in rapidly growing tech stocks, not sluggish safety names. Therefore, they appear to be grossly overvalued now, and when the recession comes, multiples along with stock prices will likely contract considerably, possibly by 50% or more.
By the Way, Other Sectors aren’t Cheap Either
Materials are trading at about 20 times this year’s EPS estimates. Information technology is trading at about 29 times this year’s EPS estimates. Industrials are trading at 26 times this year’s EPS estimates. Consumer discretionary names are trading at about 25 times this year’s EPS estimates, and communication services are trading at around 27 times this year’s EPS estimates.
The only two major sectors trading at reasonable multiples in my view are financials, at about 10.5 times this year’s EPS estimates, and energy, at around 12 times this year’s EPS estimates. However, there is good reason for these sectors to be trading at a discount.
Banks are in a tough predicament with rates going lower, the economy slowing, and the possibility for higher default rates, and energy stocks are extremely cyclical and largely depend on the price of oil which is in a bear market right now, down by about 27% from the highs reached last October.
There are no major bright spots as far as stocks are concerned going forward in my view. Sure, the Fed may be able to pull a rabbit out of its hat and inflate stock prices slightly higher from here, but this will be temporary and transitory, as a recession will occur eventually regardless of what the Fed does. Also, the Fed may be behind the curve already, as it typically has been in the past (perhaps most notably in the 2007-2009 crisis).
The Fed Cannot Fix Everything
The bottom line is that the Fed is not a group of magicians. Yes, the Fed can lower rates to try to stimulate economic growth, and they can implement more QE to try and delay the inevitable recession, but in the end these measures (if they work, and that is a big if), they will only inflate an even bigger bubble.

Therefore, the Fed cannot fix everything; they can perhaps engineer a “softer landing”, but the recession is likely to materialize regardless of what the Fed does over the next 6-18 months.
Trade War is Weighing on Growth
The Trade War is not likely going away any time soon, it is likely being “postponed” with the recent announcement of pushing back tariffs on some Chinese goods until December 15th.
Please notice that China has not made any concessions on its part.

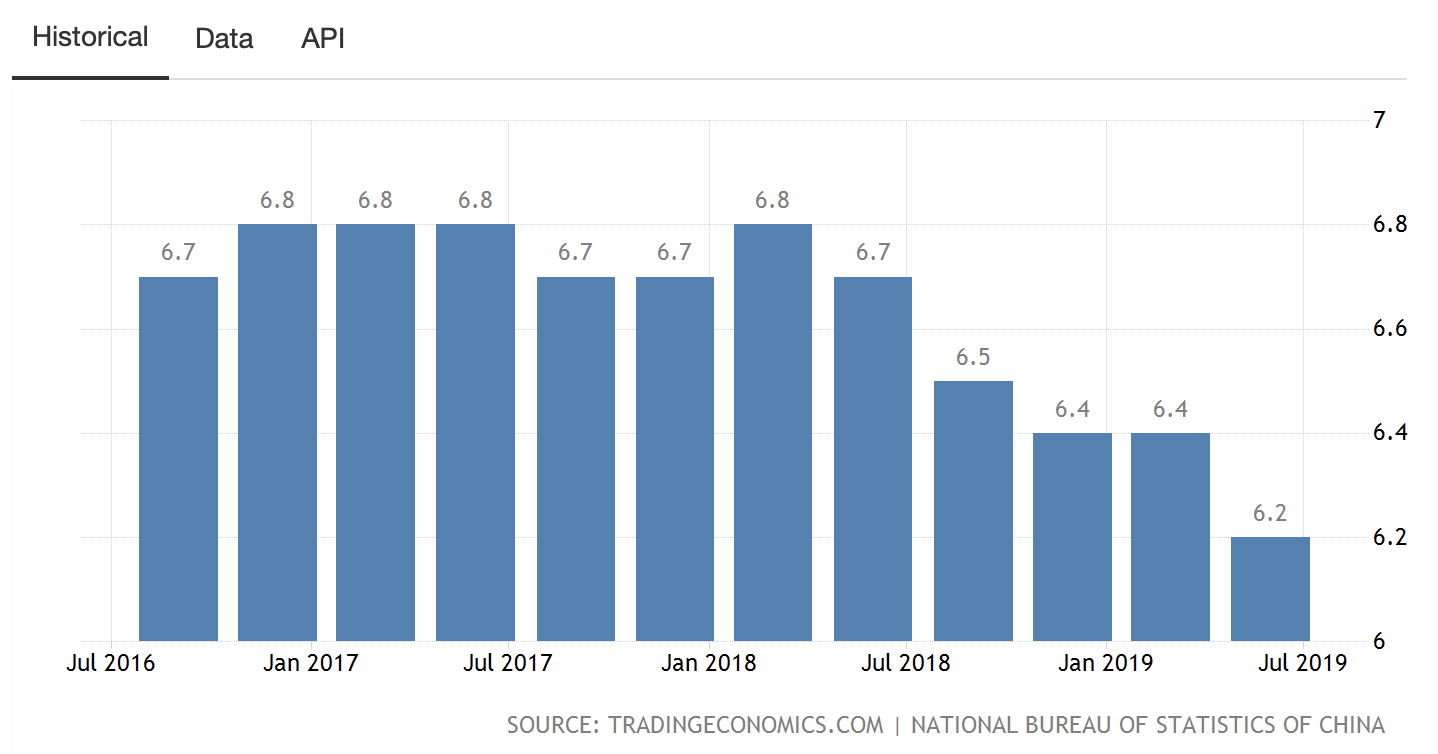
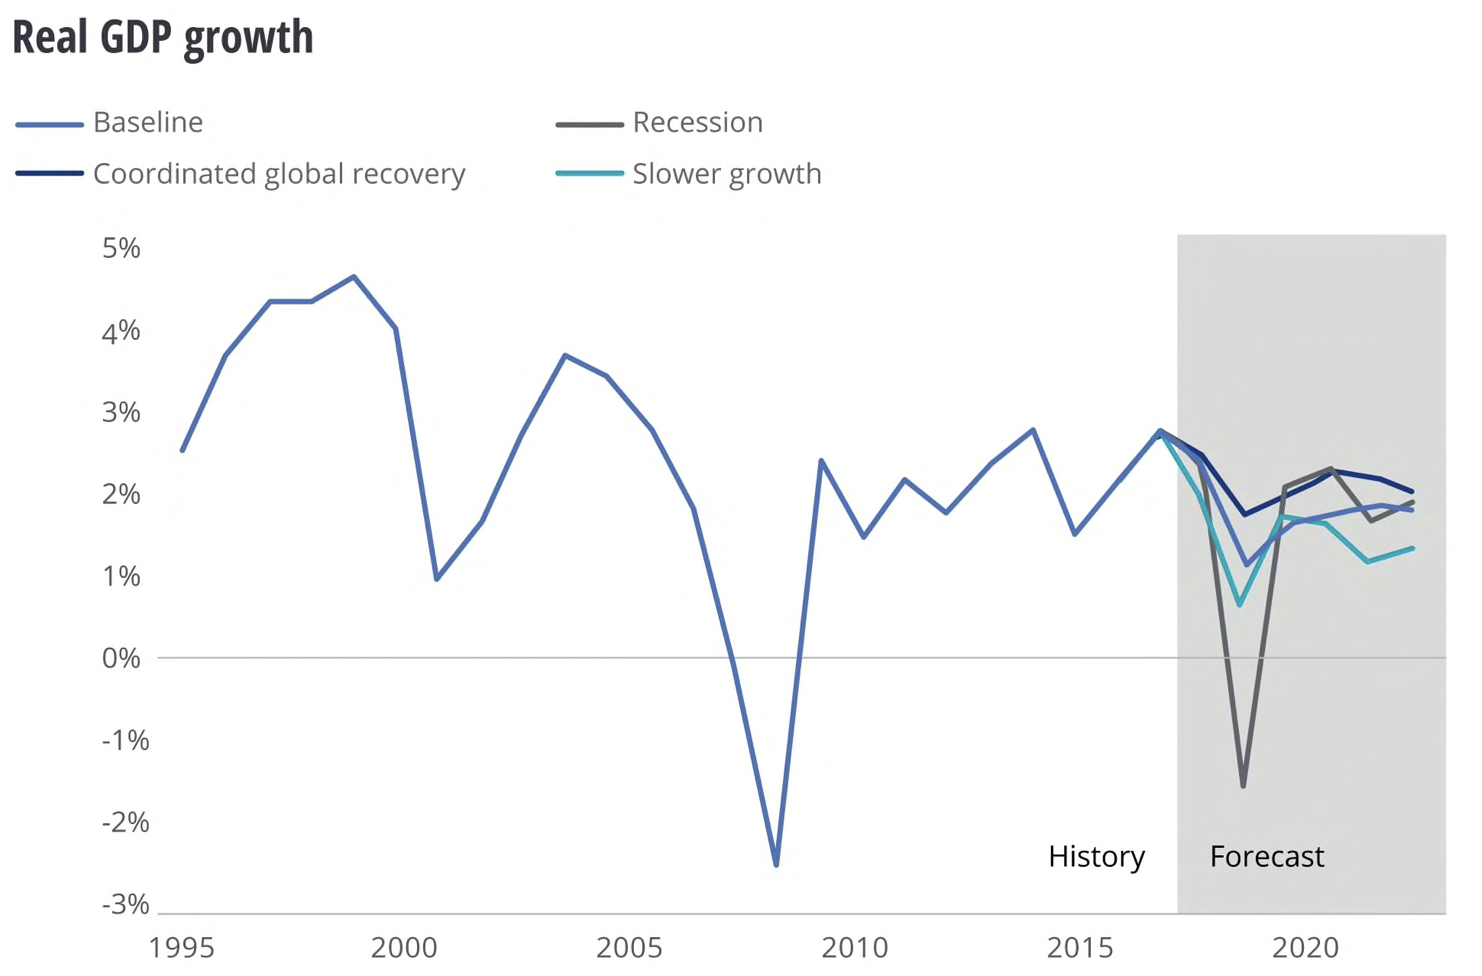
This is because China is in a more powerful position right now. Its economy is growing at over 6% GDP, and the U.S. is projected to deliver under 2% (baseline), around 1% in a slower growth environment, and negative 1-2% in a recessionary scenario. I believe U.S. GDP YoY growth could go negative as early as Q1 2020, which may imply the S&P 500 and stocks in general are in a bear market already.
China GDP Growth YoY
U.S. YoY GDP Growth and Projections
Valuations are Very Rich
I spoke about sector valuations being expensive before. Please, also keep in mind that in a slower or recessionary economic environment these valuations will only become more expensive.
In fact, it appears that the Shiller P/E ratio may have peaked in 2018 at around 34. Shiller P/E Ratio Long-Term Chart
 Source: StockCharts.com
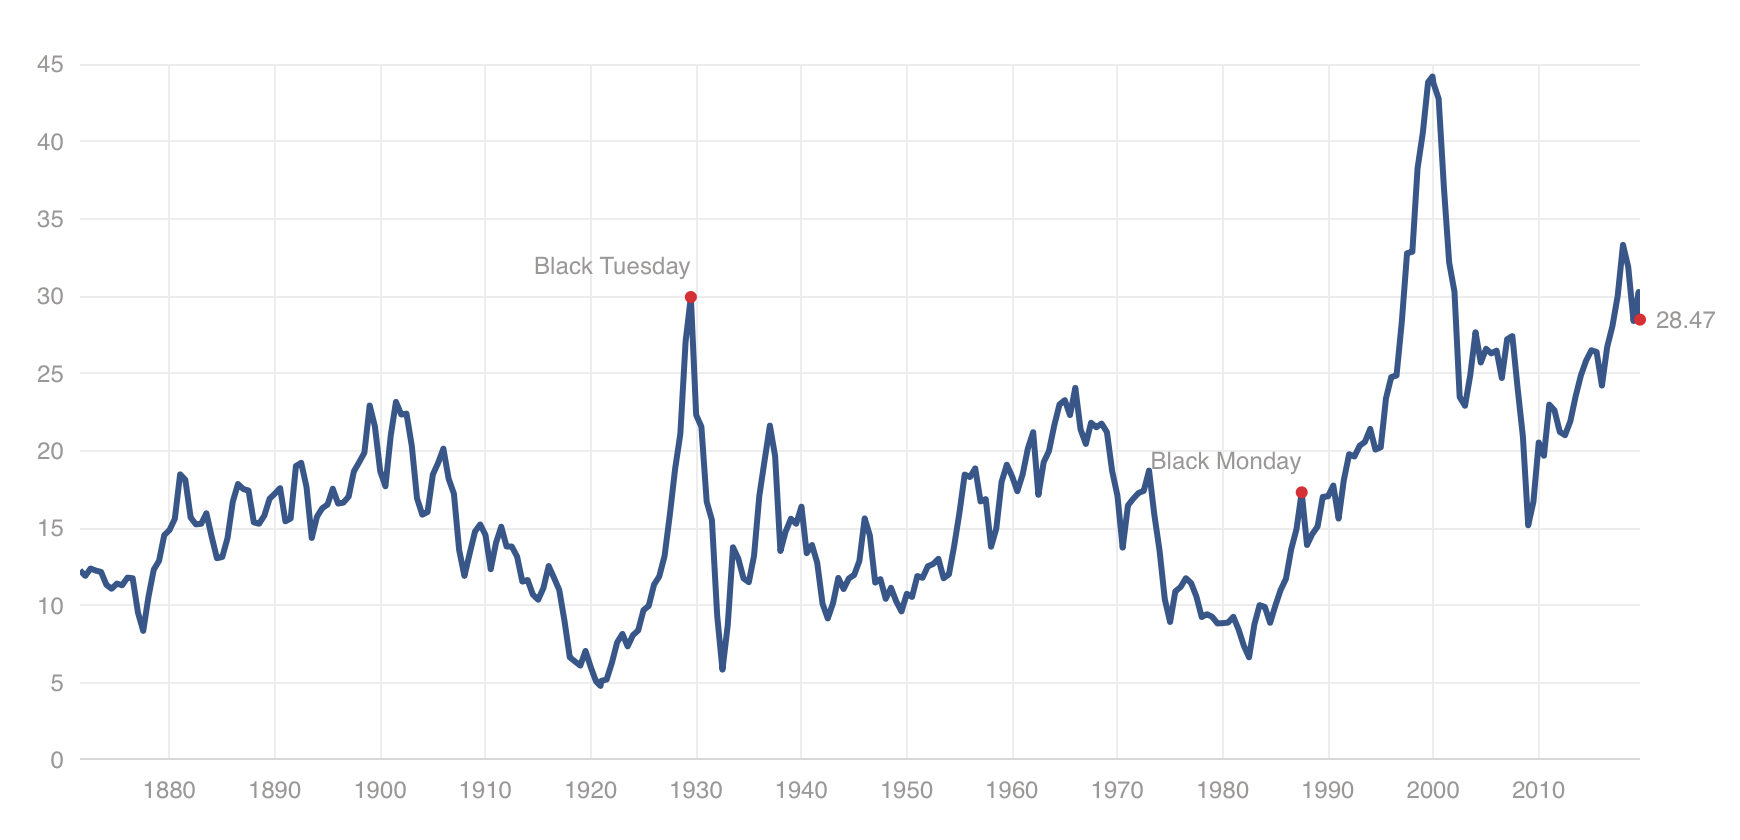
Now it is trading at around 28.5, which is still extremely high by historical standards. The median for the Shiller P/E ratio is about 15.74, which implies the S&P 500 may be overvalued by roughly 80% right now. Also, for the SPX to get back to its historic median, the S&P 500 would need to decline by roughly 45% from current levels.
Such a decline could bring the S&P 500 down to about the 1,562. Yes, I know, this seems almost unrealistic, but if history is any guide, it is very plausible, and it could even overshoot to the downside in a worst-case scenario possibly bringing the SPX below 1,500 in a grizzly bear market mauling.

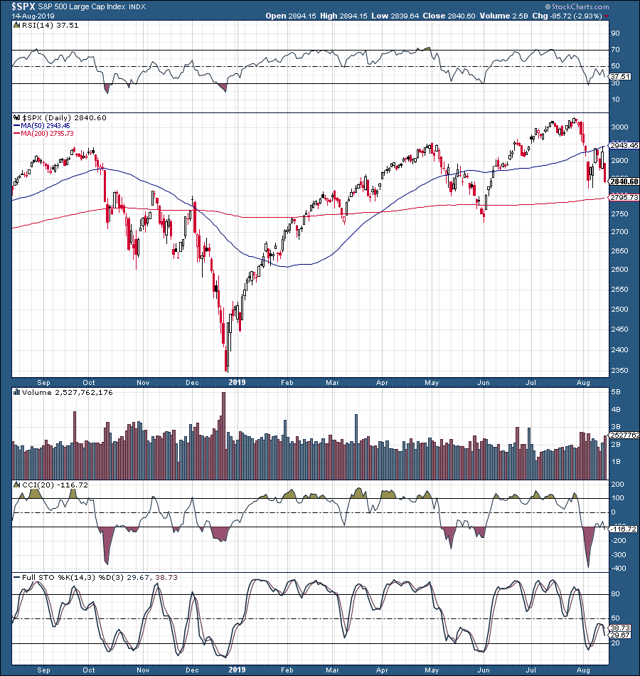
Technical View
I typically discuss detailed technical conditions with members of my Marketplace service, but I think it is important for everyone to get a quick technical glimpse into what is going on with the S&P 500 right now.
Let’s look at the SPX chart
 Source: StockCharts.com
Things do not look good to put it lightly. We see a very bearish head and shoulders pattern developing. The neckline is around the key support level of 2,725. If the S&P 500 breaks down below this level then there is a very high probability that we are in the early stages of a bear market, and not just another correction.
Moreover, we are seeing relatively “orderly” declines, no major panic selling, relatively low volume, etc. This is not good, as it implies that institutions are likely starting to systematically reduce stock positions, don’t want to spook markets, and want to do it in an orderly way to avoid panic, and reduce their exposure to large losses.
In other words, this may be the time when institutions begin to get out of stocks, but want to do it in a way to limit their losses by selling to retail and other investors that usually arrive in the later end of a bull market cycle.
The Bottom Line: Simply Too Many Red Flags to Ignore
The signs are clear, and most are pointing towards the materialization of a recession and a bear market in the U.S. Since bear markets typically precede recessions by about 6 months, we could be in a bear market already.
Signs of the upcoming recession include but are not limited to:
- Inverting yields in the U.S.
- Record negative yielding debt around the globe.
- Longer-term treasuries at or near all-time lows.
- Increased demand for “safe-haven” assets (gold, treasuries/bonds, defensive sectors, etc.).
- Bearish sector performance/rotation.
- Significant underperformance in small-caps (Russell 2000).
- Worsening economic data; especially in housing, manufacturing, fright/trucking/railroad sectors.
- Record low, but rising unemployment rate.
- Worsening consumer confidence.
- Worsening corporate profits.
- Extreme amounts of consumer, government, and corporate debt.
- Prolonged Trade War tensions that will likely cause corporate profits to decline further and will make Chinese made goods more expensive for U.S. consumers.
- Signs of higher inflation.
- The Fed may be behind the curve.
- Expensive valuations in the SPX and in most stocks/sectors in general.
- A very troubling technical image.
These negative developments imply that the U.S. economy is slowing substantially, and is likely to slow down more rapidly than is currently anticipated. In fact, a recession within the next 6-18 months seems extremely likely in my view. As bear markets typically precede recessions by about 6 months or so, the S&P 500 and stocks in general are likely in the early stages of a bear market right now.
0 comments:
Publicar un comentario