When Will This Stock Market Bubble Burst?
by: Thomas Sobon
Summary
- This will be the first of two or more articles I plan to write about stock market matters. My last article was written more than a year ago.
- Since then I kept abreast of stock market developments while writing short stories and poetry. I haven't won any major writing contests yet. The prizes are great; completion is robust.
- The stock market is at-or-near record high price levels. I think that is not sustainable. The partisan political situation in this country stinks and the stench just gets worse.
- I think the stock market could crash before long. In this article, I will write about past stock market crashes and use that as prologue for my next article.
- Since I am mainly a market technician, any future articles will concentrate on technical analysis with fundamental analysis and political considerations included as needed.
Introduction
As far as I am concerned, fundamental analysis by itself is the way to go wrong with confidence.
I was a true believer in such analysis when I first got out of college and was employed as a securities analyst more than 50 years ago. But after paying my dues while attending the School of Hard Knocks, I wised up and learned how important technical analysis could be. Currently, my investment decisions are based largely on technical market considerations with some allowance being made for fundamental analysis on ad hoc bases.
I finalized development of my Sobon Oscillator a couple of years ago. Its data base covers 480 stocks, the prices of which are updated daily. I will show two of five charts that I use to track the general market near the end of this article and make some comments about them. The oscillator is based wholly upon technical stock market analysis and I use it to identify trends and reversals in the stock market on real time bases for my personal use.
But market analysis also involves so-called fundamental analysis. Being a one-man shop, I have my limitations and get some input from others such as those whose articles I read on Seeking Alpha. I know that when I accept good advice, I increase my own ability.
So I benefit by reading articles by astute analysts (such as contributors to Seeking Alpha like Lawrence Fuller, Eric Parnell, Jeff Snider, Kevin Wilson and DoctoRx) to be informed about fundamental developments as such relate to the macro economy and the stock market or individual stocks. The conclusions I draw are always my own and they should not reflect poorly on any of the authors cited above.
I believe that there are bubbles in the stock and bond markets at this time and crashes in such are possible (and may even be probable) during nearby years but the exact timing is never important to me unless I can predict it. But I think that it's a question of when not if a crash occurs. And being a market technician I don't have to predict the when because technical analysis is trend following with the emphasis placed on reversal patterns. So on an ex anti basis it is not necessary for me to try to forecast the top.
And, an ex post basis works just as well because I don't need a crystal ball or lucky rabbit's foot to call the top. If I'm bullish on the market, I want to have a well-defined bottom behind me. But if I'm bearish, I want a well-defined top behind me. So all I have to do is stay with the trend until I can call a reversal. It's as simple as that. But the difficulty is doing the work that should be done effectively. That's why I developed my oscillator.
When the top for the market occurs, I should be able to define it within 10 days after its occurrence on a tentative basis, and within 25 days on a durable basis. I plan to write a follow-up article to this one when I make a determination that a top reversal is occurring and I will write an article and document and explain my rationale at that time. And I will also go out on a limb by making forecasts about the direction and price targets that I think probable at that time.
Without discussing in detail in this article, I will may make comments about the ill-conceived monetary policies of the Fed, the partisan politics of the do-nothing Congress, the short-sighted practices of corporations (instead of investing money in capital assets, they increase executive pay and engage in stock buyback programs), the manipulative practices of high-frequency traders, and the political situation extant.
I will expose enough of my technical analysis to show up-to-date technical stock market trends that are extant; but I will not make any predictions about a possible top in the market at this time. Such comments will be made in my follow-up to this article. There are many charts, tables and screens in my workbook that I could display and I will display them as needed on an ad hoc basis in future articles. In this article, I will show two charts.
In this article, I will conclude that another stock market crash may occur in the not too distant future. It may not be as devastating as the infamous crash in Holland in the 1630s, which was the granddaddy of all market crashes. But knowing about the magnitude of the insanity that prevailed at that time can provide insight into (1) all of the other crashes that occurred since then and (2) the current bond and stock market situations extant right here in the good old USA.
Every self-respecting investor should be knowledgeable about the historical sweep of stock market crashes. Because if he hasn't learned the lessons that history has to teach, then how can he avoid similar calamities that may occur during the future?
Beginning with the Holland tulip craze in the 16th Century, stock market crashes having varying degrees of severity occurred somewhere in the world every 10 to 50 years. Afterwards, reforms were imposed by governing bodies so something like that could not possibly happen again for as long as the sun shall rise (or 90 days, whichever came first). The root cause of each crash was usually fraud, excessive speculation or financial shenanigans in capital markets. So let's start by considering the granddaddy of all stock market crashes up until now.
The Holland Tulip Craze In The 17th Century
In the 1630s, Holland's war with Spain ended and the nation was developing its peace time economy. Amsterdam merchants were at the center of a very lucrative East Indies trade. They flaunted their success by erecting grand estates surrounded by flower gardens. Beautiful rare tulip bulbs exhibited colors that were much more intense than those found in ordinary varieties. It took about seven years to grow one from seed. The mother bulb only lasted a few years. And wealthy individuals were willing to pay high prices for choice bulbs.
Owning beautiful rare tulip bulbs became a status symbol. Florists proliferated. Professional tulip traders came into being. They courted flower lovers and speculators alike. Prices shot up. And suddenly everybody in Holland wanted to own tulips for their beauty or speculative purposes.
In 1634-35, confidence was high, speculative interest continued to wax, and bulbs began to be traded on exchanges in big cities or in taverns located in small towns. Farmers even swapped fertile farms for a few choice bulbs. Some traders became wealthy. Many people believed the continent's riches would soon be concentrated on the shores of the Zuyder Zee. The madness even spread to England where tulip bulbs were traded on the London Stock Exchange, and, also to France, where special exchanges were established. The tulip craze reached its peak during the winter of 1637 when bulbs changed hands as often as ten times a day.
Then the inevitable happened: the tulip bulb market crashed when, at a routine bulb auction, no buyers showed up. Within days, panic spread across the country and the crash left many victims in its wake. At the height of the craze in 1637, an owner of a rare bulb turned down an offer for it that was twice the amount that Rembrandt would get for his masterpiece The Night Watch in 1642.
Conclusion #1. Zero bound and/or low interest rates seem to have had the same appeal to central bankers around the world in recent years that tulips had to Hollanders in the 17th Century. The stock market responded to the low interest rates much like the Hollanders responded to rising tulip prices. There was a bubble in the market for tulip bulbs then just like there is a bubble in the stock market today. We know how that boom ended. It remains to be seen how the boom extant will end.
Market Crashes during the Past Century
We ought to know about:
(1) the financial panic of 1907 when a group of speculators, financed by bankers (who else?) tried to corner the copper market and failed. With bankers involved, trouble loomed for investors.
(2) There was the Florida real estate bust of the 1920s. One enterprising developer sold 24 sub-divisions to out of state buyers on a two-acre plot of land. Others advertised extensively in northern newspapers and sold building lots that were under water. After the crash entire cities and towns in Florida were devastated.
(3) During the stock market crash of 1929, margin was 10%. An oil company (Cities Service) issued common stock and loaned the money to speculators at 20% interest. Afterwards, the Gross Domestic Product contracted from $102 billion in 1929 to only $34 billion in 1932. And the GDP did not recover to the 1929 level until the beginning of WWII.
(4) Don't forget what happened during the dot.com bust of 1999 in the USA when the investment community was more interested in subscriber growth and clicks than it was in earnings or dividends.
(5) Such was followed by the real estate debacle of 2007-2008 because of the ill-conceived lending practices of (you guessed it) the lousy bankers. Anytime the money center banks get directly involved in stock markets, it's just a matter of time before the inevitable happens. And they are heavily involved today; need I say more?
Conclusion #2. In the not too distant future, we may learn about another stock market crash as it occurs. I readily admit that such an eventuality is not predictable with a high degree of certainty regarding its timing by me or anybody else if you want to know what the market will do six months or more from now. But, I use technical analysis as a trading indicator. Therefore, I follow trends and look for reversals.
I don't have to anticipate the top for the market. I think I can do a better job than most stock market timers and I will show you some of what I do in two charts below. But history has valuable lessons to teach. And the main lesson to be learned never varies: By the iron law of nature, what is virtuous will endure and what isn't virtuous won't endure. So let's consider some other lessons in order to gain perspective about the stock market situation extant.
The Halcyon Days Of The 1960s May Be Long Gone But They Should Not Be Forgotten
It would be nice if nowadays, we had the kind of investment climate we had in the 1960s. The political parties put country ahead of party. The Fed was intelligently chaired by William Machesney Martin who cut interest rates in 1961 and sparked a recovery from the recession that began a few years earlier. (Bernanke and Yellen are pikers and also-rans when compared to Martin who ran the Fed during the terms of five Presidents. He chaired the Fed brilliantly from 1950 through 1969.)
There was good balance in the robust capital spending boom that ensued. The employment rate was high and per capita discretionary income grew steadily. Inflation was modest at about 2%.
Interest rates were steady at free market rates until the Fed increased them in 1969 because of inflationary pressures caused by heavy government borrowing needed to finance the Vietnam War.
In 1962, I could have hung the financial page on the wall of my office, thrown a dart, and picked a winner. As a securities analyst who worked for a major insurance company, I didn't do that (at least not when anybody was watching) when deciding which stocks I would recommend for purchase or sale. I sure as heck wouldn't throw a dart at the financial page today unless, of course, I was looking for a stock that I wanted to research for a possible short sale.
Re: Alexis de Tocqueville
Alexis de Tocqueville (1805-1859) was a Frenchman who was a political scientist, historian, and politician, and he was best known for his book Democracy in America, which was a perceptive analysis of the political and social system in the United States. He said that (1) America was great because America was good; and if America ever ceased to be good, she would no longer be great." He also said that (2) If a society is brought low because of the failure of its leader, we ought to ask why our society didn't breed a better leader.
Therein lays much food for thought: It maybe that if Alexis de Tocqueville was alive today he might say that America is no longer good so she is no longer great. I can't even imagine what he would say about the President who we have as this time..
Our current political system leaves much to be desired: The partisan bickering that goes on among politicians is worse now than it ever was during the past 100 years. There is a significant grass roots movement led by Tom Steyer who is spending many millions of dollars of his own money at this time to lead and finance a grass roots movement to impeach the President. Why didn't our society breed a better leader than we got?
That is a question we should be asking. It could be that political rottenness is pervasive in our country and collectively we are too stupid to know that. That is a frightening thought and I did not come to that conclusion easily. Could it that the land of the free and the home of the brave has now become the godless state of capitalism? So with that in mind, read carefully that which follows.
The Recalcitrant Days Since 2007-2008 Should Not Be Forgotten:
During the last decade we saw politicians putting party ahead of country and the partisanship battles just keep getting worse. And, we saw the extremist among the politicians act as if they are mercenaries for vested interest groups which some of them may have been. We also saw the Fed stumbling as it used an unproven QE theory about an economic stimulus that didn't really stimulate.
It was and still is nothing more than a bailout or rescue.
Interest rates are not determined by free market factors. If the Fed dared to let rates rise to free market levels during the near term future there could be no doubt that such would have a very significant adverse effect on the stock market. The Fed was more concerned about fighting deflation than inflation. That by itself tells us that the economy was and continues to be on life support provided by the Fed. There was little need for corporations to launch capital expansion programs despite low interest rates.
So they used much of their financial assets to boost executive pay and buy back stock instead of investing in capital assets. We had high under-employment and little growth in discretionary income. Such disturbing trends are continuing while nothing much is being done by Congress to remedy the situation. In fact, the tax bill being discussed looks like it will make things worse for the majority of people and not better.
A Comment By Jeff Snider:
I think that Jeff Snider is one of the most astute contributors to Seeking Alpha that there is.
About a year ago, he wrote this comment in one of his articles:
"We have wasted seven years waiting for nothing, a likelihood that should have been established back then. Though the Fed is a joke, it is still politically potent, especially playing a key role in how even politics accepts what is actually wrong. Until it is fully humiliated, we are stuck in this limbo where we know exactly what is wrong but can't do a damn thing about it. They targeted a monetary rate that nobody uses in order to project a story that nobody believes just so the media would write about an economic recovery that doesn't exist. The Fed is truly a joke and though it isn't funny it is for now the only one we can tell. Until enough people hear it, we are stuck in only bad scenarios."
I agree with all that Jeff wrote. The Fed is an institution that is well suited to be staffed by people who deserve to be institutionalized. Spokesmen for the Fed always say that their policies are data dependent but I think that all that they really do is look out for the Wall Street crowd.
Conclusion #3: We live in troubled times and they aren't likely to get much better in the months (or maybe even years) ahead. Therefore, slow real growth, if any, is indicated for the near-term future. And with things being in a state of confusion at the Fed and in Congress, it is anybody's guess (and therefore speculative) how things will turn out.
What Do The Wheelers And Dealers On Wall Street Care About The Consequences Of Their Actions?
In recent years, there has been a trend toward passive investment. So fund flows shifted away from mutual funds and into low-cost ETFs. But more significantly, there was rapid growth in high frequency trading. Such trading is used to front run the market. When Mary Jo White led the SEC a few years ago, she complained that the HFT operators could not be controlled and she gave up trying. Representative Peter DeFazio introduced a bill in Congress that would levy a three cent tax on each hundred dollars of stocks traded on exchanges.
The bill never got to the floor for a vote because of lobbying by Wall Street. If it had passed it might have ended high frequency trading. The biggest such trader is Citadel while Goldman Sacks and J.P. Morgan rank among the top ten. These traders don't care how they drive stock prices because they trade millions of shares each day for small profit margins. It is amazing that the dollar volume of trading in the S&P 600 small cap stock index each day is often more than twice the dollar volume in S&P 500 large cap stocks despite the fact that the latter is priced at higher prices than the former.
I think that a good part of the reason why the general market is priced at such high levels today relates to churning by the high frequency traders. Therefore, if they keep pushing stocks up and find that they are the last ones in when the market is making new highs, they will quickly become the first ones out. And then if the supply-demand balance turns bearish, the high frequency traders could likely lead the market lower. Once that starts, it could be every man for himself when many market participants decide to dump stocks on the market.
Think back about the way that the tulip crash started in Holland in 1637: The crash started when no buyers showed up at a routine auction! Ben Franklin said that experience keeps an expensive school but fools will learn in no other. That is why it is so important to learn about the lessons that history has to teach.
During the last nine years, the stock market responded bullishly to the quantitative easing policies of the Fed. In fact, some influential market participants relished the idea and even went so far as to say a Bernanke put and then a Yellen put was under the market so it was OK to throw caution to the wind.
And, since there was little downside risk in the market, it was OK to speculate and drive prices up to record highs. I doubt that the hocus pocus policies of the Fed can continue much longer before serious adverse consequences result.
What Kind Of Stock Market Environment Will We Have During The Near-Term Future Starting With The Next Trading Day?
That is the question I ask every day when I update my workbook and look for trends and reversal patterns. I will soon show two of five charts I use to track the general market. I also have many charts, tables and screens that I use to track sectors and use for stock selection.
Since the program I wrote is highly automated, it only takes about seven minutes to download the data that I need each day, update all of the charts (like these shown) and tables which include data for all 480 stocks, and the screens which I use for sector and stock selection each day.
I can construct a chart on any of the 480 stocks in my workbook in less than a minute. But if you knew how long it took me to learn how to start from scratch and write a complicated computer program and build the database and revise and refine again and again the procedures I used, you might say that I was insane to try to do what I did. And I would probably agree with you; because I told myself that many times in past years.
The top panel on the next chart shows the performance of 10 prominent ETFs (and three other indicators that were constructed by me) during the last 150 trading days. You can read the legend at the top and study the chart if you so choose.
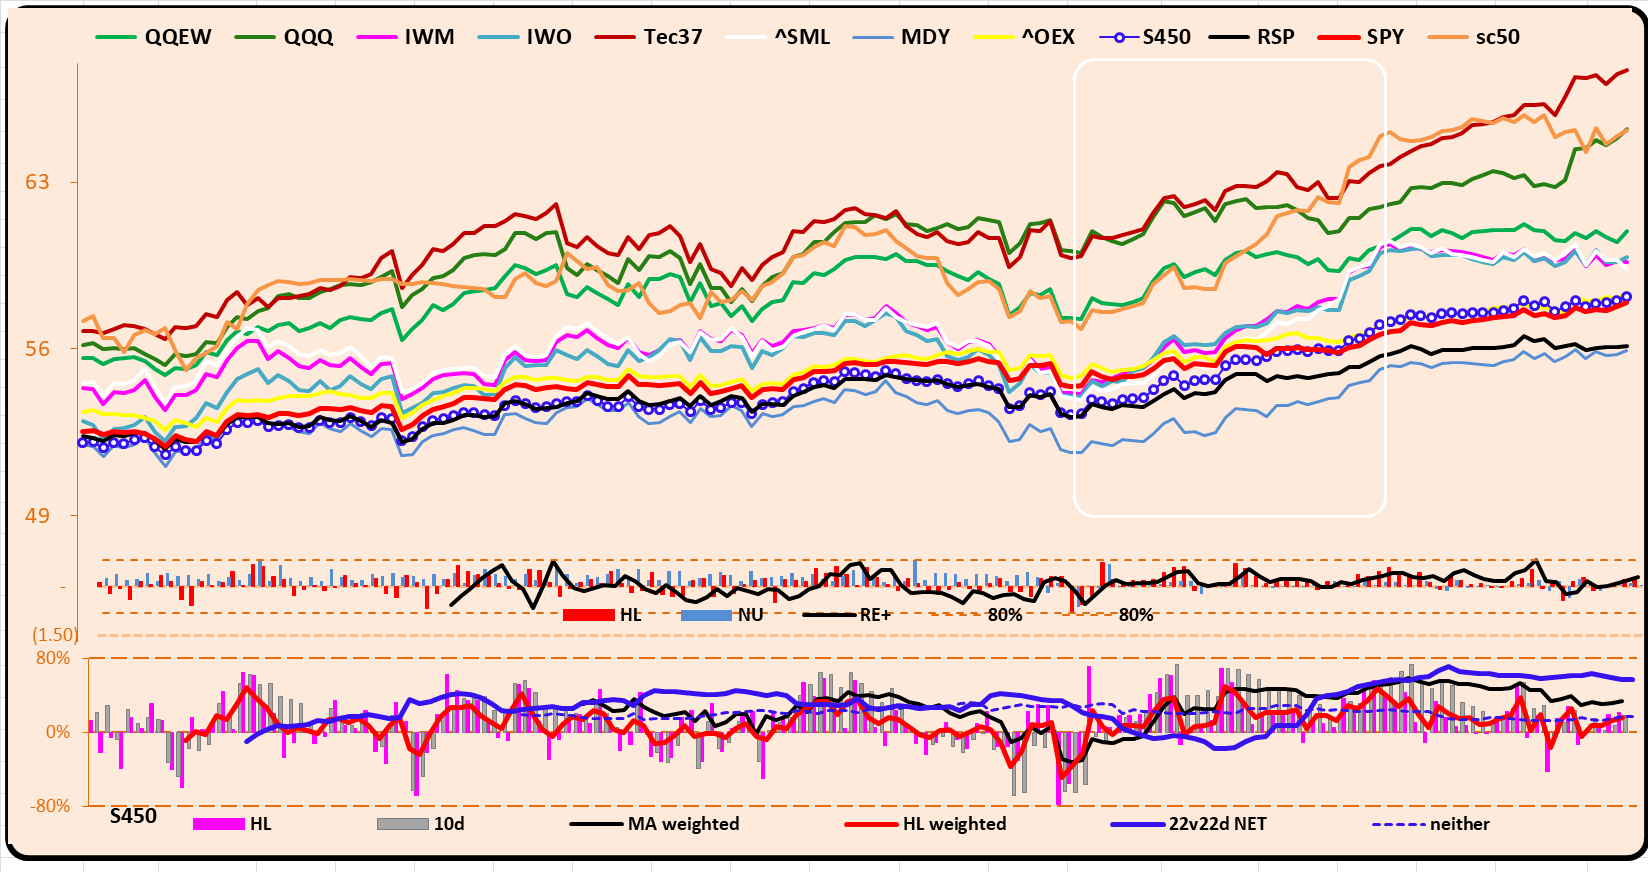
The dark blue line with the white dots shows my index of 450 stocks and it correlates well with the SPY500 index, outperforming or underperforming it from time to time. The two panels on the bottom are sensitive lead indicators that I watch closely. I am not going to take time explaining all that is going in this chart but I will be specific when I write my next article, which will be a follow-up to this article. But the bottom line conclusion is that the market has further to go on the upside unless some dramatic news announcement occurs that is decidedly bearish.
The next chart is the crown jewel of all the charts that I have in my workbook. It shows breadth indicators for 32 indicators that I use for market timing purposes. The time span covered is 30 days and I do have a chart exactly like it but its time span is 151 days. It would be almost unreadable if I showed it here because it would be five times as wide as this one and shrunk into the same size as this one. But it is handy at times when I want to back-test something.
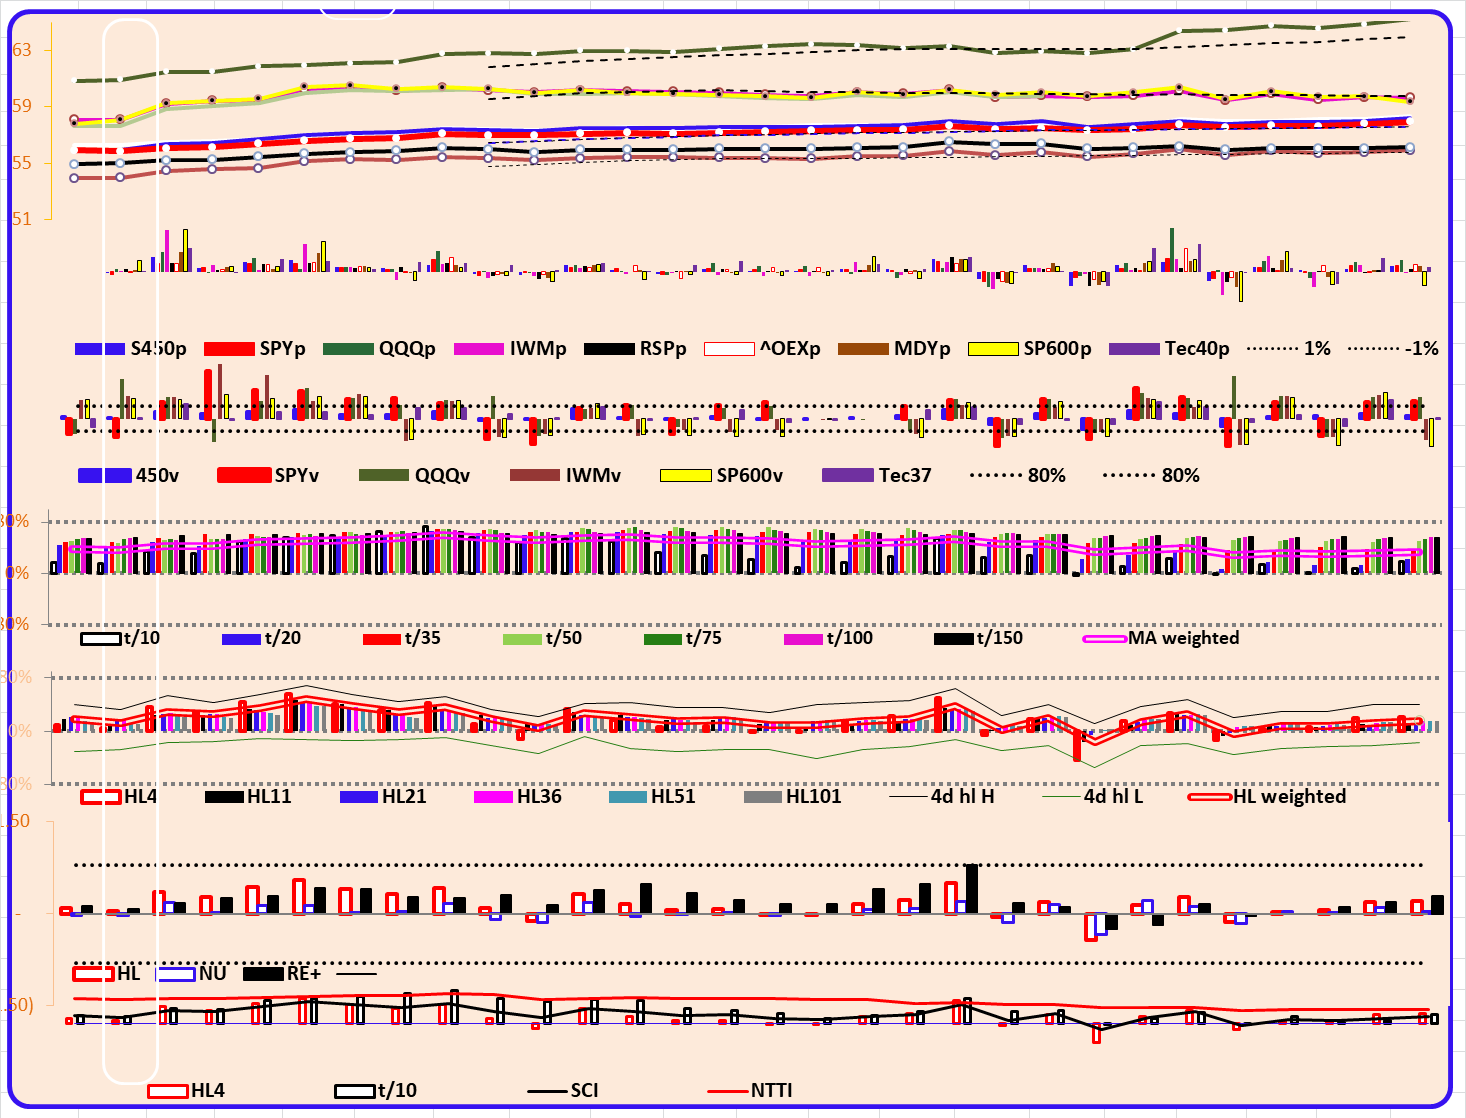
The first panel shows price lines for selected market averages. The second and third panels show day-to-day price changes and volume to trading for those averages, respectively. The fourth and fifth panels show breadth indicators for moving averages and for the stocks making highs or lows for various time spans ranging from 10 days up to 150 days, respectively. The bottom two panels are sensitive indicators that are experimental at this time so I won't make any comment about them.
Everything on this chart is proprietary with me.
I covered a lot of ground by writing what I wrote above and that will be prologue for my next article.
To do both in one article would have been a heavy lift for me (the writer) as well as anybody else who is a reader of what I wrote.
And with completion in the stock market being what it is, only a fool will tell others all that he knows. Because when everybody knows the tricks nobody watches the magician. The stock market is a godless capitalistic arena and traders try to gain an advantage in order to outperform the market as everybody tries to buy low and sell high. There is nothing wrong with that as long as the game is played fairly in accordance with well-sanctioned rules.
To say that the sanctioned rules are always ethical would be a stretch. Anybody who believes that could also believe in the tooth fairy. So each worldly wise participant tries to play the Little Jack Horner trick while trying to outfox the rest of the investment community. So the bulls and bears win when they are privy to information that others don't have. I worked hard during the past 20 years to get the information that I now get and try to use it to my advantage.
If and when I write my next article, I expect to state boldly what needs to be said to support an actionable recommendation that is well documented and convincingly presented. Earlier in this article, I wrote that this article would be prologue to the next article. I hate to use the crappy data dependent excuse that the Fed uses anytime a spokesman talks about the Fed's interest rate policies.
But I probably won't write my next article until I see that a trend reversal is beginning.
0 comments:
Publicar un comentario