The U.S. Dollar Trade Is Dead Now - What About Gold?
by: Simple Digressions

Summary
- In my opinion, if a bullish thesis about gold is correct, the current correction in gold prices could be over now.
- Although the last Commitments of Traders report is of poor predictive value, the signals delivered by a few other indicators (discussed in the article) support this scenario.
- The US dollar could be a significant risk factor for gold but the US dollar trade is dead now.
- As a result, the signals sent by the greenback are of small predictive value as well.
In my last report on the precious metals market, I made the following final conclusion:
In my opinion, the gold market has entered its correction phase. My short-term indicators support this thesis – for example, Money Managers are overly optimistic about gold and silver prices. Now the most important thing is the way the gold behaves above its strong support at $1,300 per ounce. If it holds above it, the gold bulls should feel comfortable. If it does not – a bullish thesis on gold would have to be verified”
The first part of this statement was fulfilled - last week gold and silver prices dropped substantially (2.1% and 4.1%, respectively). The second part of the statement is being tested now – gold prices hold around their strong support at $1,300 per ounce.
COT report
Unfortunately, the last Commitments of Traders report (COT report) is generally useless. The data disclosed in that report is dated September 19, one day ahead of the Fed announcement; so, by no means it clarifies the way the traders reacted to that event. However, looking at the latest developments, I think that the optimism among big traders speculating in gold/silver futures has dissipated. Interestingly, the first signs of a change of mood were disclosed in the last report (so, it has some value):

Source: the COT report
Note that last week Money Managers cut their long position in gold futures by 18.7 thousand contracts (the row marked in grey) – it was the first such a large cut since the beginning of the current bull stage in gold (July 2017).
Definitely, last week the gold market was in its correction mode. Now the question is:
Is the correction over now?
As usual, I have no idea but predicting the gold market (and other financial markets) has nothing to do with having the idea. Simply, it is just pure mental speculation about the future.
So… let me speculate.
Physical markets
This time I want to look at the US physical market. Or, better said, at something which is between the physical and paper market, namely SPDR Gold Trust (GLD) and iShares Gold Trust (IAU). Here are the appropriate charts:

Source: Simple Digressions
The charts show gold flows reported by GLD and IAU (the row marked in blue depicts monthly changes in gold prices). As a rule, when gold is in its bull stage both investment vehicles report gold flows. And vice versa.
This year, however, the pattern is more complicated. At least the one drawn by GLD. For example, in July gold prices went up by 2.3% but GLD reported outflows of gold (the largest outflow reported this year – 1.9 million ounces went out of GLD in July). Well, not everything goes strictly according to the rules.
However, this month both investment vehicles added large amounts of gold into their vaults (GLD: 1.3 million ounces and IAU: 0.2 million ounces, up to now). Note that these acquisitions were made at lower prices of gold. In other words, investors were increasing their holdings during a correction phase, which violates the general rule. To be honest, I am always trying to catch exceptions from the general rule because they deliver very helpful information about the state of the market. And this information is, in my opinion, as follows:
Investors are confident that the bull market in gold is going to last. A substantial drop in gold prices is considered as a buying opportunity. As long as gold prices are around their strong support at $1,300 per ounce, the investor’s confidence is well-grounded.
What is more, the exceptions discussed above are very rare. Hence, the message delivered by this exceptional event is even stronger.
Gold prices against 10-year treasury prices
As my readers know, one of my favorite short-term indicators is the relationship between gold prices and the US 10-year treasury notes prices. Here are the updated charts:
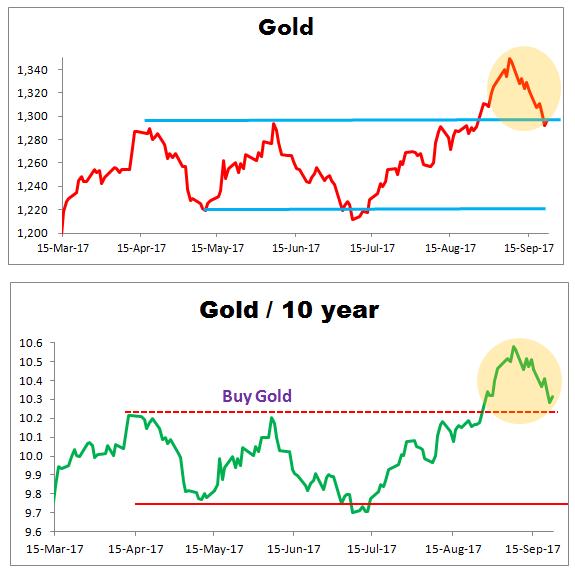
Source: Simple Digressions
Note that the current correction in gold prices (the upper panel of the chart and the area marked in yellow) brought the ratio to its support. The old resistance (the dotted, horizontal line on the lower panel of the chart) is the new support now; so, in the short term, I expect that gold prices should bounce off that level or enter a consolidation pattern.
US dollar is the biggest risk factor for the precious metals market
The US dollar is still in its bear market phase, which is good for gold. On the Fed announcement the greenback had strengthened significantly, but then the enthusiasm for taking long positions in the US currency dissipated. However, the actual situation will be disclosed when the next COT report is on.
Now I can say this – there is still excessive pessimism about the US dollar. For example, the last COT report reveals that big speculators increased their net short positions in US dollar index futures (the green circle on the chart below):
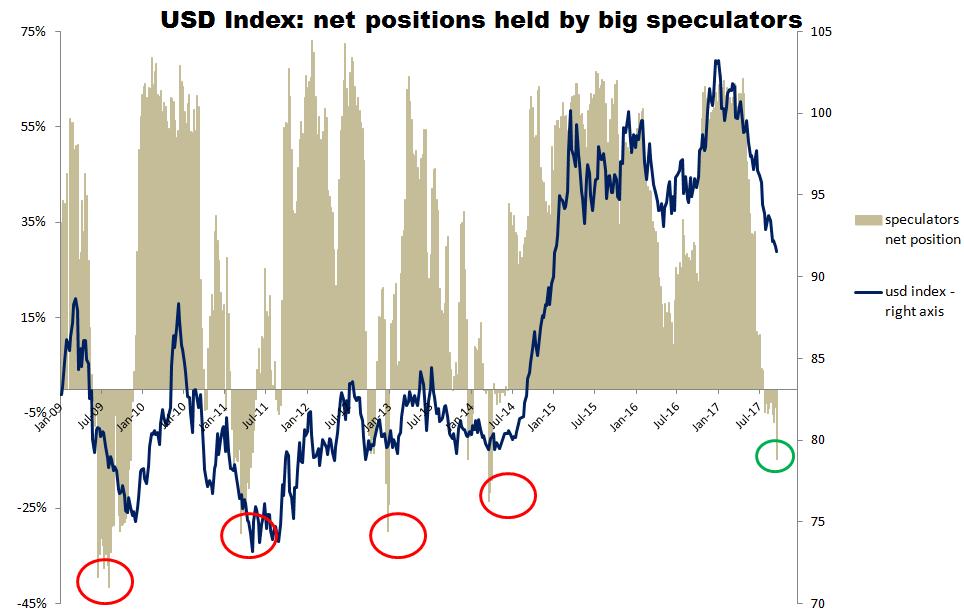
Source: Simple Digressions and the COT data
Note that whenever big traders were that negative about the greenback (red circles), the US currency was ahead of a major trend reversal.
Now, if the US dollar starts its bull market phase, the emerging bull cycle in gold could be endangered (according to the old rule that gold and the US dollar go in the opposite direction).
That is the theory but the problem is that the signals delivered by the COT report could be distorted. Look at this chart:
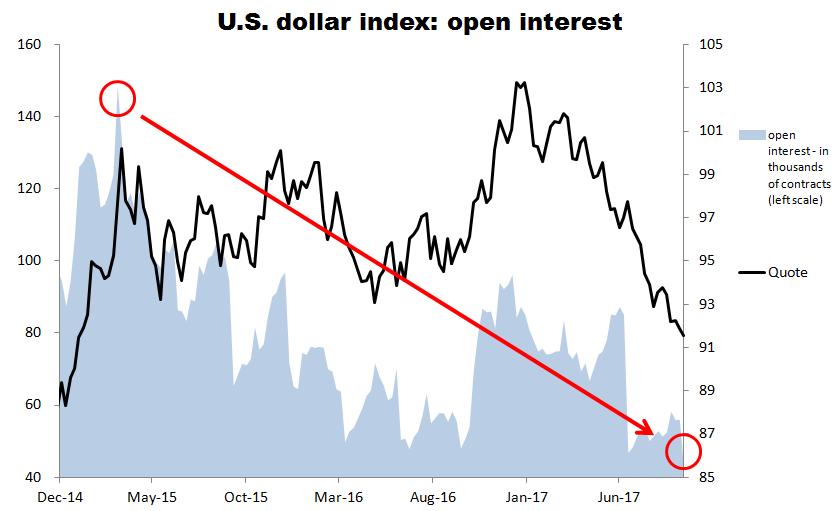
Source: Simple Digressions and the COT data
The chart shows the total open interest in US dollar index futures. Now this measure stands at one of the lowest levels in history – as of September 19, 2017, only 42.3 thousand contracts were in the game. Simply put, the US dollar trade is dead now. Generally, nobody wants to bet on the US dollar, no matter whether on the long or short side. As a result, the signals delivered by the dead market are of very low quality.
Summary
Last week’s COT report shows the state of the markets as of September 19, one day ahead of the Fed announcement. It means that the predictive value of this report is poor. However, assuming that gold is in its bull market stage, the current correction could be over. This thesis is supported by US investors accumulating gold bullion (using GLD and IAU) despite lower gold prices. Additionally, my favorite market indicator (the relationship between gold and US 10-year treasury notes prices) is very close to its strong technical support.
0 comments:
Publicar un comentario