Gold Moving Up, But Watch Out For Whipsaw
Mar. 23, 2015 3:04 AM ET

Summary
- The low I expected at $1140 has now played out and we should be targeting at least $1200 in the short term.
- Fed induced market volatility in February and March shows that we should remain alert to the potential for whipsaw.
- Gold movement up or down as we move into early April should set up a profitable swing trade in the opposite direction into the summer months.
If you remember, I was looking for gold to put in a low at an ideal price level of $1140, before starting a fed induced rally that should take us up to at least $1200 and possibly a good deal higher. On Wednesday we bottomed at $1141 and started a rally that took us up as high as $1188 before closing the week at $1182. So are we now in the throes of a rally up to test the January 2015 highs? Possibly, but bulls need to be careful this week as I feel there is potential for whipsaw in the gold price.
What's Up With The Fed?
In the February meeting and subsequent press conference, Janet Yellen indicated that the Federal Reserve is open to raising the base rate as soon as June 2015. Global markets went haywire, with stocks bond and commodities all declining pretty hard on the day. The only real winner was the US Dollar which broke out to new highs on the news, and pressured the gold price into a pretty sizeable drop.
This time around we had the reverse, whereby Aunty Janet soothed and caressed the Wall Street faithful by saying that the decision to raise the benchmark rate is 'data dependent' and just because they can raise the rate in June, doesn't mean they actually will decide to take that action. Everything rallied, with stocks, bonds and precious metals putting in decent gains. The US Dollar fell hard on the day, with the euro appreciating 3% against it within a few short hours.
So what's up with that? Is there indecision within the ranks? Can they just not make up their minds?
In my opinion the answer to that is a resounding no - the Fed are unanimously desperate to raise rates but were pressured into a more dovish announcement by various foreign central banks (and one particularly influential monetary maven) who are fully aware that a rate hike will hurt their own economies. At a press conference in India just a few days prior to the Fed meeting, IMF Chief Christine Lagarde said the following:
The danger is that vulnerabilities that build up during a period of very accommodative monetary policy can unwind suddenly when such policy is reversed, creating substantial market volatility.. We already got a taste of it during the taper tantrum ... I am afraid this may not be a one-off episode. This is so, because the timing of interest rate lift-off and the pace of subsequent rate increases can still surprise markets.The Fed want to raise rates. They are painted into a corner and should a financial crisis unfold in the near term they would be unable to take any real action to restore confidence to the markets. Despite the massive cash injections via their QE programs inflation is still anemic at best, and although QE is not seen as an outright failure, it is certainly not lauded as a runaway success. Markets are all about confidence - the confidence you need to put your hard-earned money at risk - and with rates at current low levels, and QE not really having the effect intended, they need to restock the medicine bag should markets need a shot in the arm.
Emerging market economies do not want the Fed to raise rates. Many have issued bonds denominated in US Dollars and are already suffering in light of dollar strength which makes repayments more costly. We saw what happened when the Fed hinted at a rate hike - bonds dropped hard while the US Dollar soared higher - and we can expect the same thing to happen when they finally do take action.
Christine Lagarde is essentially warning these markets that they need to prepare for volatility ahead, and at the same time lobbying the Fed not to take action too soon.
Given the market reaction to the possibility of a US rate increase we have seen in February and March, it is fair to assume that this is a hot topic and is likely to result in some market gyration as and when it is being discussed. When asked on Friday about the possibility of a correction in markets, former Dallas Fed President Richard W. Fischer said:
Are we vulnerable in my personal opinion to a significant equity market correction? I do believe we are, and the reason for that is people have gotten lazy. They've depended totally on the Fed…
Yes, we have… conditioned the markets.This coming week we have a number of Fed board members attending public functions and some making public speeches, with Janet Yellen speaking in San Francisco on March 27th. Market participants therefore need to stay flexible and alert for whipsaw in gold and other markets, as one wrong word is likely to result in a big move. The merest hint of the Fed 'no longer having our back' could send markets into a temporary tailspin.
Data Points
Has the US Dollar Topped?
I have been asked this question quite a bit recently, and I have read many articles this weekend that point to a coming correction in the dollar, some even suggesting that we have just put in a major high. Those with that opinion are likely to be correct - but only for about 3 weeks! I keep saying it but it's worth repeating: The US Dollar is going much higher, and much quicker than you expect.
When I wrote my fist article for Seeking Alpha in mid-December last year The US Dollar index (DXY) had a value of 87.50 and there were calls for a correction even then, with many writers/analysts stating that the move was 'parabolic'. It is has since appreciated by close to 15%, and we are only now approaching what may be a temporary stopping point at 103.
The chart I included last week is still very much applicable, but this week I have zoomed in a little to the daily timeframe. We can see that the pullback this week found support at the 23.6% fib retracement level of the previous wave, and has since bounced a little.
(click to enlarge)
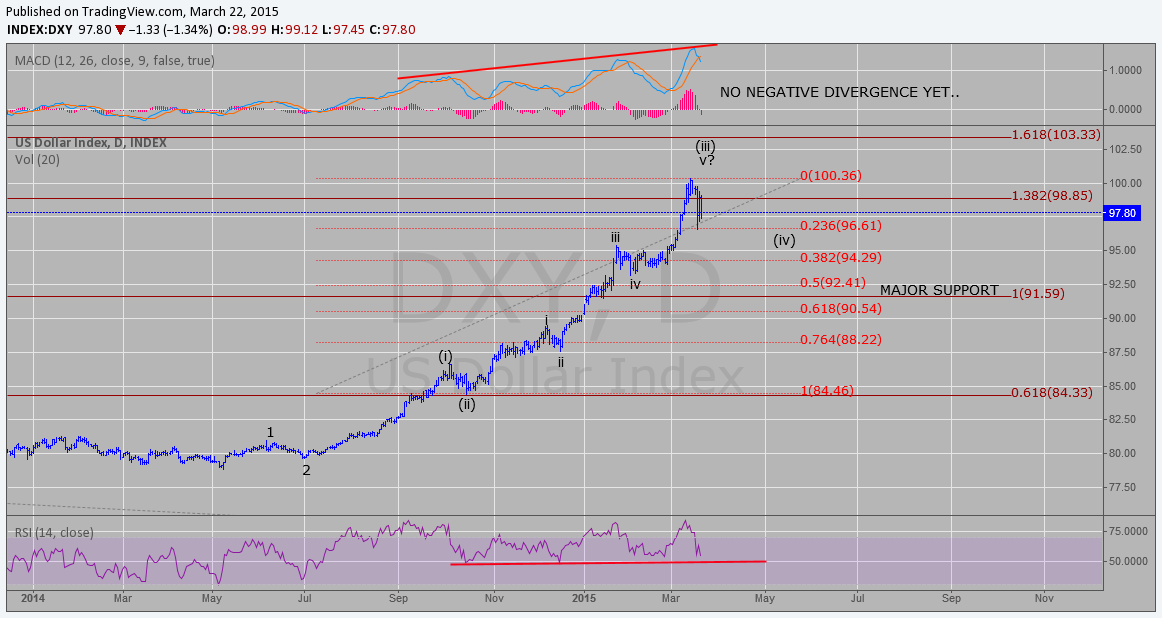
There is a chance that we have already made the low before resuming our ascent to 103, but I can't rule out the chance of a move that retests this low and possibly drops further to the 38.2% retracement at 94.29 before heading higher.
Once we do hit 103, and assuming that we don't just blast through it, major support for the rise to date comes in at 91.59 and would be a great price to enter long with a stop just below. I will be adding to my long positions at that point if we get there, but with a move this bullish don't be surprised if we hold support higher towards that 94/95 region - traders will be looking to buy dips.
Commitment of Traders Report
The latest COT figures are below:
| COMMERCIAL | LARGE SPEC | SMALL SPEC | |||
| LONG | SHORT | LONG | SHORT | LONG | SHORT |
| 180,464 | 236,954 | 162,268 | 109,175 | 40,446 | 37,049 |
| CHANGE | CHANGE | CHANGE | CHANGE | CHANGE | CHANGE |
| +25,886 | -6,966 | -9,553 | +19,246 | -816 | +3,237 |
Last week I noted that the Large and Small Speculator categories were piling on the short contracts at what could be precisely the wrong time, and with the rally from $1141 now having taken place you can see exactly why.
The report comes out each Friday but includes data up to and including the preceding Tuesday, so this week's report gives you the number of contracts bought and sold between March 10th & 17th. The highest gold price for the week (actually on the 10th) was roughly $1170, so each and every short contract detailed in this report was purchased at a price lower than the price gold trades at today.
You can imagine the scramble to sell these contracts as gold moved up from $1141, and of course it is possible that they were all sold without incurring a loss, but I would imagine next week's report won't show that to be true, and some of these contracts will remain on their books and underwater.
The Commercials added 25,000+ long contracts during the period, and even if these were all purchased at the highest gold price in the week (very doubtful), they are all nicely in profit and looking good for gains ahead. You have to hand it to the Commercials - they are almost Zen-like in their trading; always one step ahead.
Overall the report is bullish for gold, but just bear in mind that we have the potential for whipsaw this week and next, and we may see changes now that the rally has blasted off and the Commercials can take profits.
GOFO
As of March 15th detailed in his supply and demand report, Keith Weiner of Monetary Metals indicates that backwardation (scarcity of physical metal for sale and/or greater demand for physical metal than current supply allows) remains in place for the April contract and has increased from last week. The June contract is also close to going negative, meaning that there should be a bid underneath the gold price as no shortage of buyers wait in the wings to make purchases.
The data is a week old, but the important point is to note that backwardation has increased since the last report was given. With the pop in the gold price this week it will be interesting to see if any great changes appear when figures are next detailed - should it remain in place or increase I would view this as very bullish for gold prices over the next few weeks.
Gold Miners
The gold mining majors (NYSEARCA:GDX) and the juniors (NYSEARCA:GDXJ) all performed well this week given the rise in the gold price. I have included a chart for the majors below:
(click to enlarge)
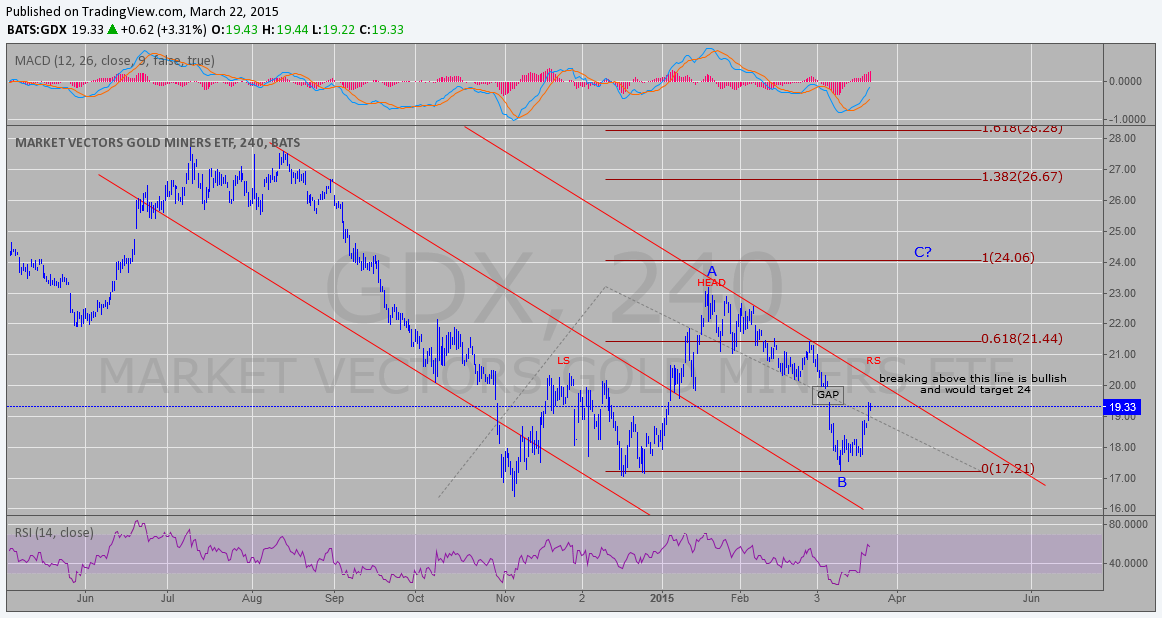
As we can see, we held the December 2014 low and have started to move higher, but we are now approaching a possible area of resistance and you should be on the lookout for a pullback from this zone. There is a gap in the price at 19.50-20, and declining trend line resistance stands at just over 20.
I have detailed the options on the chart via red and blue markings. The red count says we fill the gap, but fail to take out the trend-line resistance and create what would be a head and shoulders technical pattern which if it triggers targets new lows. The blue count says we are now in a C wave higher, and if we break strongly through the declining trend line we should be targeting 24.
The junior miners have exactly the same pattern and options at present, with the gap and trend line resistance coming in at broadly the 25 level, and a target of 29-32 should this level be broken to the upside.
Gold Chart
A look at the chart tells us that the pop I expected is now playing out, and our first target is the $1200-1220 price zone:
(click to enlarge)
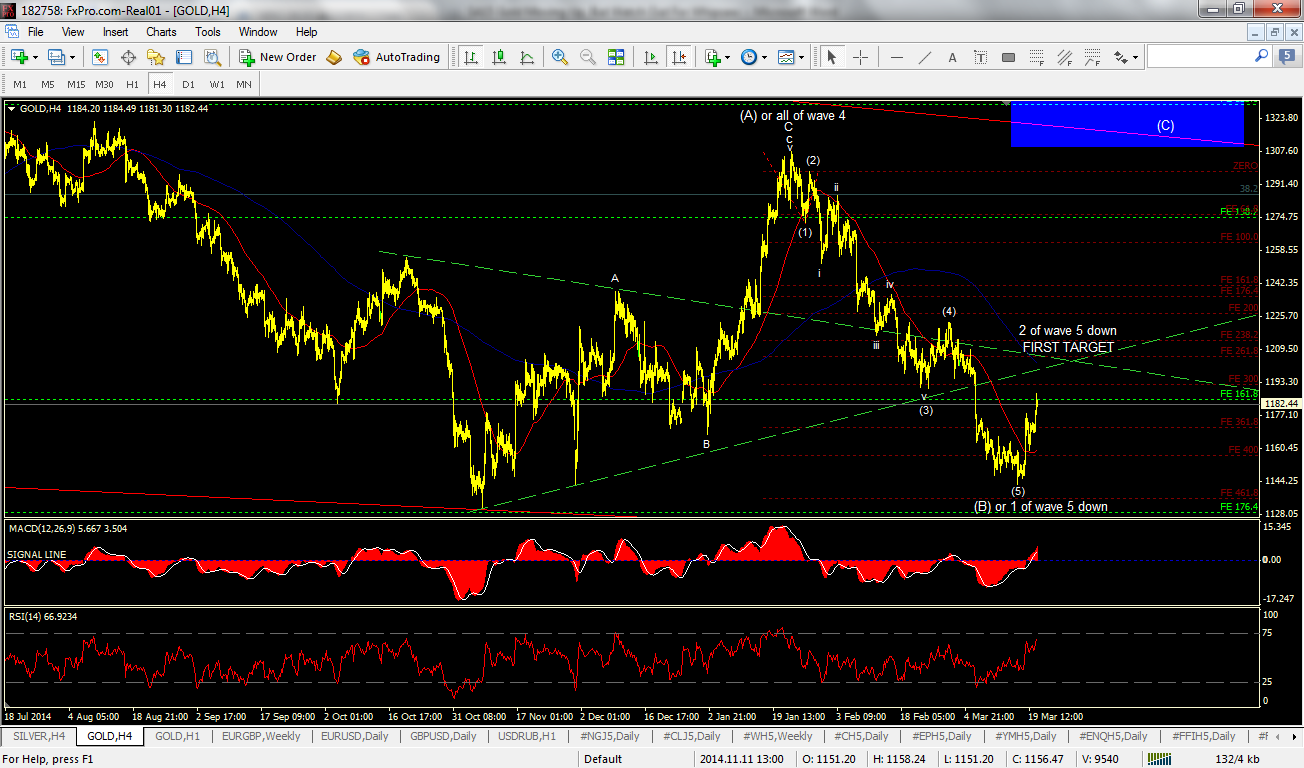
The count lines up well with how I see the gold miners progressing also, with the $1200-1220 zone representing the gaps at 20 for GDX and 25 for GDXJ. Our first test is now coming, and I expect that we will see at least a pullback from this area.
The pullback (or lack of one) will determine whether or not we are in our C wave higher. A corrective decline would indicate we are heading to test the January highs and perhaps exceed them ($1345?); an impulsive move lower from this price zone would mean we are more than likely on our way to new lows and targeting $1086 at a minimum.
Cycles indicate that a turning point for gold is close (April 6th +/- 3 days), but this can be a high or a low. If we were to blast higher over the next 2 weeks in our C wave we should be setting up a very tasty short into the summer. If we decline to new lows over the next couple of weeks, we are likely setting up a decent long entry.
A lot will be decided in the next month, so it would pay traders to say alert and not to marry positioning. As usual I will update thoughts in the comments section and I wish everyone good luck for the coming week!
0 comments:
Publicar un comentario