A Gold Update
May 17, 2012
.
by Jeremy Robson
..

I have written previous articles on gold here
and here.
Since those articles, the gold price has fallen in a consistent manner and is
now around $1540 per once. All recent gold rallies have been sold and there is a
pattern of lower highs and lower lows. This is the definition of a bear market.
As discussed in the previous articles, I am not of the opinion that we are in a
bear market for gold at this time. However, I think that it is very possible
that the gold price will move substantially lower before resuming its upward
trajectory. In summary I would say - the correction is not yet over but the gold
bull market has at least another 3 years to run.
.
Gold seems presently trapped in an association with risk appetites and is becoming increasingly correlated to risk in general. This is not a good sign, but it is likely a temporary phenomenon.
..
Gold is, in my opinion, a hedge against the wildest excesses of central banks to prop up a system of debt and unproductive assets that wants to unwind. If the central banks of the world decide to stop money printing and zero bound interest rates and allow the excess debt and unproductive assets to be liquidated, the gold bull market will be close to being over. I say close to being over, as if this very unlikely event were to occur, there would be a period of chaos in which gold would surge. Once this initial chaos was over (and all risk assets had sold off) the gold bull market would be over. There is no sign at this time of central banks allowing the system to purge itself and so I continue to argue that gold is in a bull market.
.
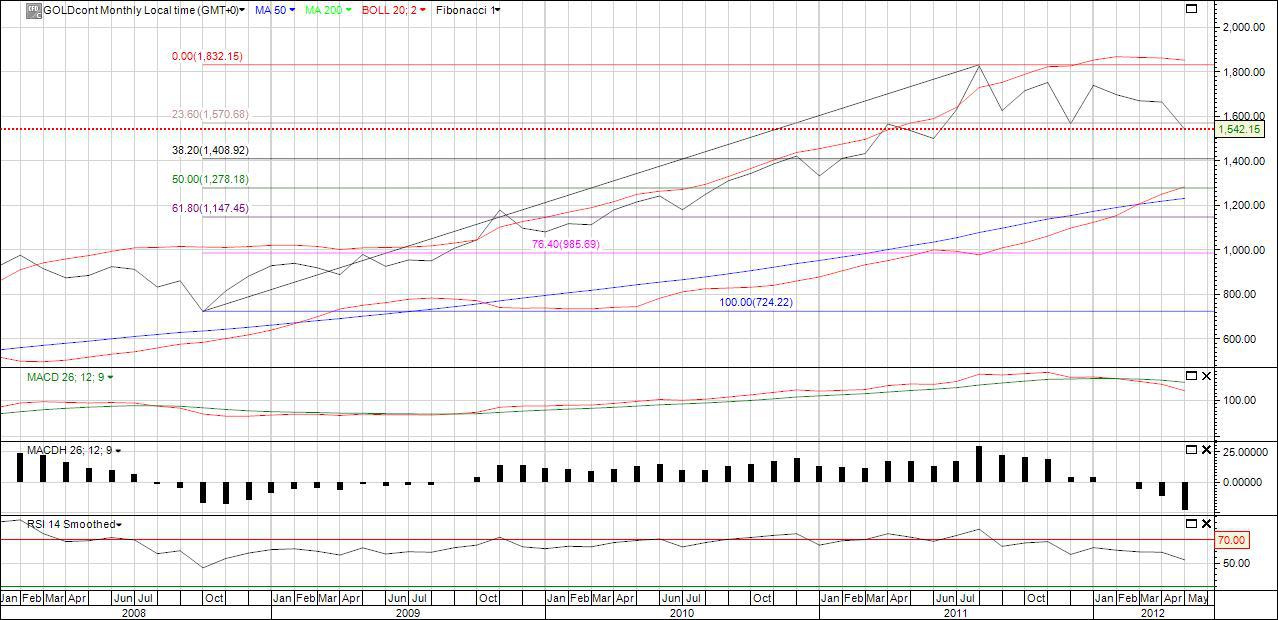
Corrections in bull markets of anything are normal and healthy and it is clear gold is in one of these corrections. The question for me is when will the association with risk, that gold has recently formed, be broken and the bull market resume. Below is a monthly chart of gold.
.
(click to enlarge)
.
The Fibonacci retracements are drawn on the chart for the rise from the bottom of the gold price in 2008 to the peak in 2011. Gold has risen from under $800 to over $1900 in that period. The retracement levels shown on the chart are
We have passed $1570 on the downside. There is a 5 wave down move for gold since June 2011 and we are oversold on the daily charts. In the short-term, a rally in the gold price to the $1600 level looks likely. Unless the $1600 level is broken, this will likely be a temporary rally and lead to another decline with gold falling in association with all risk assets. If this plays out, the next downside target would be $1409 and if that does not hold, $1278. Please be aware that this is based on monthly targets and if this pattern is correct, it would take another 6 to 12 months to play out. This highlights that the correction could have substantially further to go.
.
If $1600 is broken to the upside, the next target is $1662 and then $1780. As stated, I believe that gold is in a bull market, so at some stage it will break these upside resistances.
Conclusion
I am presently long gold futures and I expect gold to take a run at $1600. If it fails there (or does not even reach $1600), I will sell my position and wait for the next downside target. If it breaks the $1600 level, I will let it run.
.
The correction will only be over once gold has moved back above the $1780 level and is heading for $1900. It is always impossible to tell exactly when a correction is over and the technical levels shown above only have about a 60% chance of being correct (as technical analysis in general is only correct about 60% of the time). The alternative to trying to find a bottom is to dollar cost average into gold each month and remove the indecision.
.
Gold seems presently trapped in an association with risk appetites and is becoming increasingly correlated to risk in general. This is not a good sign, but it is likely a temporary phenomenon.
..
Gold is, in my opinion, a hedge against the wildest excesses of central banks to prop up a system of debt and unproductive assets that wants to unwind. If the central banks of the world decide to stop money printing and zero bound interest rates and allow the excess debt and unproductive assets to be liquidated, the gold bull market will be close to being over. I say close to being over, as if this very unlikely event were to occur, there would be a period of chaos in which gold would surge. Once this initial chaos was over (and all risk assets had sold off) the gold bull market would be over. There is no sign at this time of central banks allowing the system to purge itself and so I continue to argue that gold is in a bull market.
.
Corrections in bull markets of anything are normal and healthy and it is clear gold is in one of these corrections. The question for me is when will the association with risk, that gold has recently formed, be broken and the bull market resume. Below is a monthly chart of gold.
.
(click to enlarge)
.
The Fibonacci retracements are drawn on the chart for the rise from the bottom of the gold price in 2008 to the peak in 2011. Gold has risen from under $800 to over $1900 in that period. The retracement levels shown on the chart are
-
23.6% at 1570.68
-
38.2% at 1408.92
-
50% at 1278.18
- 61.8% at 1147.85
We have passed $1570 on the downside. There is a 5 wave down move for gold since June 2011 and we are oversold on the daily charts. In the short-term, a rally in the gold price to the $1600 level looks likely. Unless the $1600 level is broken, this will likely be a temporary rally and lead to another decline with gold falling in association with all risk assets. If this plays out, the next downside target would be $1409 and if that does not hold, $1278. Please be aware that this is based on monthly targets and if this pattern is correct, it would take another 6 to 12 months to play out. This highlights that the correction could have substantially further to go.
.
If $1600 is broken to the upside, the next target is $1662 and then $1780. As stated, I believe that gold is in a bull market, so at some stage it will break these upside resistances.
Conclusion
I am presently long gold futures and I expect gold to take a run at $1600. If it fails there (or does not even reach $1600), I will sell my position and wait for the next downside target. If it breaks the $1600 level, I will let it run.
.
The correction will only be over once gold has moved back above the $1780 level and is heading for $1900. It is always impossible to tell exactly when a correction is over and the technical levels shown above only have about a 60% chance of being correct (as technical analysis in general is only correct about 60% of the time). The alternative to trying to find a bottom is to dollar cost average into gold each month and remove the indecision.
0 comments:
Publicar un comentario