.
Fundamentals Are Supporting Bearish Outlook For Precious Metals
.
April 9, 2012
.
.
.
On top of publishing monthly rankings of several Exchange Traded Fund portfolios we try to keep a keen eye on the movement of precious metal funds to gage inflation and inflation expectations. Precious metal movements can also help us gain a clearer perspective on the strength of the dollar in a global economy. Some of this is discussed in our newsletter and some on our blog.
.
The price of gold has declined 15 per cent since September, when it hit a peak of $1,907. The closing price of GLD, the gold Exchange Traded Fund, has dropped from its high on August 22, 2011 of $184.59 to last Thursday's close of $158.31, a 17% drop. SLV, the silver Exchange Traded Fund has dropped from its high on April 28, 2011 of $47.26 to Thursday's close of $30.72, a 54% drop in price.
.
Clearly, SLV is a lot more volatile than GLD, and it has been in a down trend now for close to a year carving out lower highs and lower lows.
.
Gold traders are bearish for the first time this year after the Federal Reserve signaled it may refrain from more monetary stimulus. If Ben Bernanke was the central banker Soup Nazi his new message to the market would be "no more QE for you". Consequently, the dollar surged last week while gold fell in price.
In recent weeks, gold has also been reeling from a strike by gold sellers in India, the world's largest buyer of physical gold. On April 2, the Bombay Bullion Association declared that gold imports by India have plunged as much as 81 percent in March and could drop 40 percent in the second quarter. Indian jewelers, who sell more gold than Australian and U.S. mines produce in a year, were closed yesterday for a 19th day. India is the largest gold market in the world on an annual basis.
Taken together, the strike by Indian jewelers, along with the more upbeat outlook from the Federal Reserve, is casting a dark cloud over gold and precious metals in general. Fifteen of 29 analysts surveyed by Bloomberg expect prices to decline next week the highest proportion since Dec. 30.
.
Clearly, both gold and silver are in a funk and the end of the selling is not in sight yet.
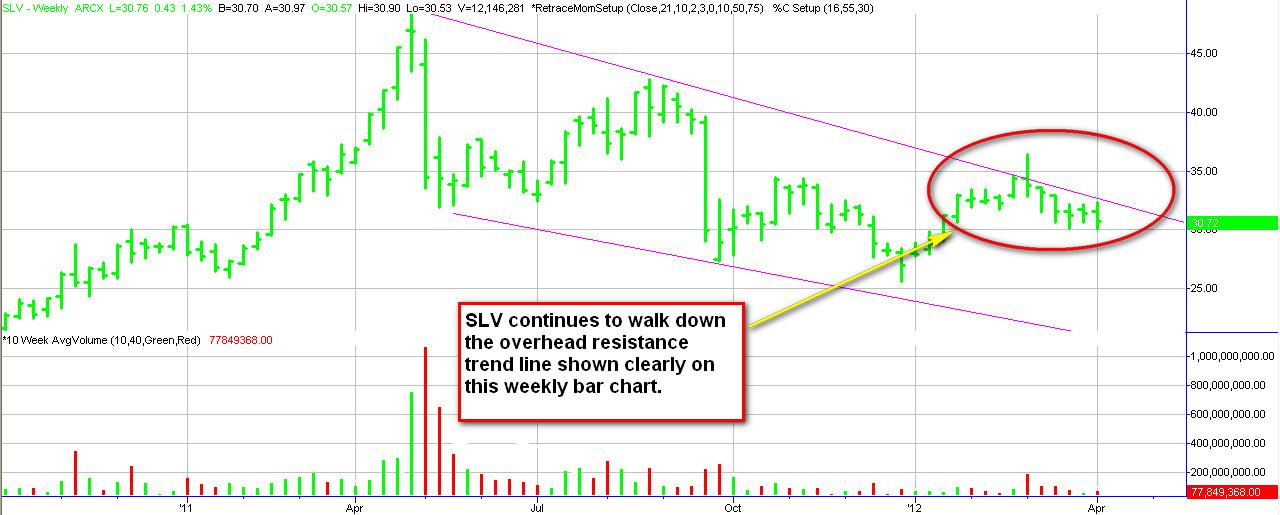
The price of SLV continues to walk down an overhead price resistance trend line on a weekly bar chart of silver illustrated below. As I have pointed out in several previous articles, "What is Money Flow Telling Us About the Price Direction of Gold and Silver" and "Options For Silver and Gold as They Start Their Next Leg Down", if the price of SLV reaches down and touches the bottom support line, SLV will trade in the range of $20 - $25 per share, indicating that SLV may have 23 - 54% more downside price action before a meaningful bottom is in place. Click on the image to see it more clearly.
.
(click to enlarge)
Gold is also contained within the bounds of a downward channel shown clearly with the line chart of GLD's daily prices below. The channel shows how GLD continues to make lower lows and lower highs. If the price of gold reaches down and touches the bottom support line of the channel again GLD will trade in the range of $140 - $150 per share, indicating that GLD may have 5 - 13% more downside price action before a meaningful bottom is in place. Click on the image to see it more clearly.
.
.
(click to enlarge)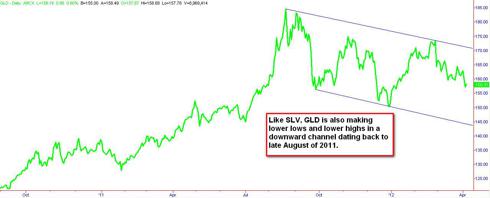
.
At some point in the future there will be a good time to buy precious metals again, but the charts supported by fundamental reasons have to be our guide, and right now they are pointing to lower prices in the immediate future. For now, if you a long term holder of gold or silver hedge your holdings with in-the-money covered calls, and or short the market with put options, inverse funds or outright shorts of GLD and SLV.
On top of publishing monthly rankings of several Exchange Traded Fund portfolios we try to keep a keen eye on the movement of precious metal funds to gage inflation and inflation expectations. Precious metal movements can also help us gain a clearer perspective on the strength of the dollar in a global economy. Some of this is discussed in our newsletter and some on our blog.
.
The price of gold has declined 15 per cent since September, when it hit a peak of $1,907. The closing price of GLD, the gold Exchange Traded Fund, has dropped from its high on August 22, 2011 of $184.59 to last Thursday's close of $158.31, a 17% drop. SLV, the silver Exchange Traded Fund has dropped from its high on April 28, 2011 of $47.26 to Thursday's close of $30.72, a 54% drop in price.
.
Clearly, SLV is a lot more volatile than GLD, and it has been in a down trend now for close to a year carving out lower highs and lower lows.
.
Gold traders are bearish for the first time this year after the Federal Reserve signaled it may refrain from more monetary stimulus. If Ben Bernanke was the central banker Soup Nazi his new message to the market would be "no more QE for you". Consequently, the dollar surged last week while gold fell in price.
In recent weeks, gold has also been reeling from a strike by gold sellers in India, the world's largest buyer of physical gold. On April 2, the Bombay Bullion Association declared that gold imports by India have plunged as much as 81 percent in March and could drop 40 percent in the second quarter. Indian jewelers, who sell more gold than Australian and U.S. mines produce in a year, were closed yesterday for a 19th day. India is the largest gold market in the world on an annual basis.
Taken together, the strike by Indian jewelers, along with the more upbeat outlook from the Federal Reserve, is casting a dark cloud over gold and precious metals in general. Fifteen of 29 analysts surveyed by Bloomberg expect prices to decline next week the highest proportion since Dec. 30.
.
Clearly, both gold and silver are in a funk and the end of the selling is not in sight yet.
The price of SLV continues to walk down an overhead price resistance trend line on a weekly bar chart of silver illustrated below. As I have pointed out in several previous articles, "What is Money Flow Telling Us About the Price Direction of Gold and Silver" and "Options For Silver and Gold as They Start Their Next Leg Down", if the price of SLV reaches down and touches the bottom support line, SLV will trade in the range of $20 - $25 per share, indicating that SLV may have 23 - 54% more downside price action before a meaningful bottom is in place. Click on the image to see it more clearly.
.
(click to enlarge)
Gold is also contained within the bounds of a downward channel shown clearly with the line chart of GLD's daily prices below. The channel shows how GLD continues to make lower lows and lower highs. If the price of gold reaches down and touches the bottom support line of the channel again GLD will trade in the range of $140 - $150 per share, indicating that GLD may have 5 - 13% more downside price action before a meaningful bottom is in place. Click on the image to see it more clearly.
.
.
(click to enlarge)

.
At some point in the future there will be a good time to buy precious metals again, but the charts supported by fundamental reasons have to be our guide, and right now they are pointing to lower prices in the immediate future. For now, if you a long term holder of gold or silver hedge your holdings with in-the-money covered calls, and or short the market with put options, inverse funds or outright shorts of GLD and SLV.
0 comments:
Publicar un comentario