Purchasing Power Of Gold During Cycles Of Inflation And Deflation
by: Michael Filighera
October 23, 2011

Gold Remains In a Correction Within a Longer Term Bull Market
Fact or Fiction
Discussions on gold usually center on its “bubble status.” Is it in a bubble? Has the bubble burst? Is it reacting to inflationary pressures? Deflationary pressures? Is it really a trusted storehouse of value? What do I get from owning gold? Many questions and just as many opinions are given as answers.
Bitten by the gold bug back in 1979, I have observed first hand the parabolic rise to $850 in 1980 and have researched through years of historical data charting gold prices (by hand for many years) ever since. I watched as the Central Banks of England, Germany, France, Ireland and several other countries sold their gold reserves at the 1990 lows ($253) in preparation and acceptance of the European Rate Mechanism (ERM), a fiat currency based system. The ERM was put in place to establish monetary equality amongst EU member states in preparing for the arrival of the euro as a unified currency.
.
Inflation or Deflation – the Who, What, Where, and When
.
A major sea change has been and remains underway in the global investment markets since the late 1990s. I am not attempting to stir the hornets’ nest or play devil’s advocate, but it is a plain and simple fact. One that some have embraced and others continue to deny.
.
The deadly combination of financial and currency declines (collapses) that began in Thailand in 1997 and more recently in Iceland, Greece, Ireland, Spain, Portugal, and Italy, – has punched holes into the economies of the countries involved. Debt defaults, banking problems and deflation – yes deflation – scar and change the global economy moving forward. It is the primary reason behind the bull market in gold and the primary reason it will continue to support gold’s upward momentum.
What is true inflation and true deflation? One would be hard pressed to find an established industry wide accepted definition. According to Robert J. Barro and Vittorio Grilli from their 1994 publication, 'European Macroeconomics'', “deflation is a decrease in the general price level of goods and services.” Simple enough right – I don’t think so. Deflation results as well when a shift in the supply and demand for goods and services happens.
A friend and valued colleague Dan Ascani has written volumes on what true deflation and true inflation are. To begin to understand these terms, acceptance that both are monetary phenomena is important and should be viewed within the context of a fiat currency system.
From the report “Gold In A Deflationary Economy” Dan explains:
Inflation is a monetary phenomenon and occurs when too much money is created and prices rise. Money can be created not only by an expansion of the monetary base by a central bank through its open market operations, but through an increase in bank lending. In other words, every time a bank lends money, the total money in circulation in that country increases since, in the U.S., for example, Federal Reserve-dictated bank reserve requirements typically require a bank to have on deposit in its vaults only 10% to 15% of the amount of a loan that is created. When long-term prosperity has been experienced, overly optimistic banks tend to lend too much money to customers. Thus, inflation is not just a situation in which commodity prices rise, but a situation that occurs within the monetary base of a country.
On the other hand, deflation occurs after too much money has been created by excess lending and borrowers cannot pay back their loans. The resulting defaults are, therefore, deflationary because the money that the bank created through its loans was not paid back, and money circulating in the monetary base is destroyed. Thus, bank loans and inflation create money, and debt defaults and deflation destroy money. When money is destroyed, it is literally taken out of circulation – the opposite result from that of loan creation.
Whatever the case, the definition, or the esoteric monetary conditions, one thing is true throughout the over four centuries of wholesale price and gold data: gold is absolutely a long-term store of value that survives periods of inflation and deflation alike "the only item that has survived all of time, all governments, all types of economies, all economic conditions, all panics, collapses, and crashes, and all wars, while still maintaining its long-term purchasing power.
This is not to say that there haven’t been periods where gold has lost value, on the contrary history reveals long periods of sinking gold prices, but through each of them gold always returns to its relative value as expressed in terms of a basket of commodities.
Roy Jastram’s 1977 book 'The Golden Constant ' has become the authoritative research book on gold. Spanning 438 years of economic up and down cycles this classic is now available in PDF format after being out of print for many years. Jastram’s influence in transforming many from speculative thought to factual information is undeniable and his work(s) are quoted and used to support various theses worldwide.
Jastram’s study is a masterwork demonstrating with clarity the behavior of the purchasing power of gold in periods of inflation and deflation and in a historical context judging as to what extent gold served as an inflation hedge or as a means to conserve wealth in periods of deflation. It covers the English experience from 1560 (the year of the Great Re-coinage in England) and the American experience from 1800 (the beginning of consistent data in America).
The entire 438 year study can be categorized into periods of inflation and deflation. Although Jastram’s study takes us through 1976 several respected analysts have updated Jastram’s work through current times.
Period 1: Deflation of 1814 – 1830
Lasting 16 years the purchasing power of gold increased 100% while commodity prices declined 50%. Imports flooded the domestic markets creating widespread unemployment. By 1818 credit had contracted to extreme levels forcing landowners to sell their properties. The gold standard was the monetary system in use.
Period 2: Deflation of 1864 -1897
Lasting 33 years the purchasing power of gold increased by 40% as commodity prices declined 65%. The U.S. Civil War not only divided the country but sent prices sharply higher as severe inflation gripped both the north and south. The south saw a complete collapse of its currency and government financial system which brought the entire country into depression until 1879 when the Gold Standard was re-established after being abolished at the start of the war in favor of a fiat system.
Period 3: Inflation of 1897 – 1920
Lasting 23 years saw commodity prices increase by a staggering 232% while the purchasing power of gold dropped 70%. Within this period, from 1897 -1914, was a smaller period that many economists called “the classic gold standard.” During this time, institutions that issued money were required to hold sufficient gold reserves to meet any and all redemption demands. As with the Civil War, the beginning of World War I and increasing inflation proved that gold is not always the best inflation hedge.
Period 4: Deflation of 1920 – 1933
Lasting 14 years the purchasing power of gold increased 251% and commodity prices fell 69%. Global stock market crashed beginning with Europe in 1920. Although it took an additional 9 years to finally hit the United States, the devastating deflationary aftermath threw the world into the Great Depression. A careful study of this period reveals that while gold shares began to appreciate in 1930 it wasn't until 1933 that gold and silver began their respective advances. The monetary system in place was the Gold Exchange Standard.
Period 5: Inflation of 1933 – 2007 (1976 – 2007 updated by Dan Ascani )
Lasting 75 years this period includes some unprecedented times for commodity prices as well as gold and silver prices. Overall commodity prices increased by 1456% and the purchasing power of gold increased by 147%. The monetary system in place was the Gold Exchange System until 1971 when the Bretton Woods Act ushered in government managed fiat currencies. Post Bretton Woods both inflation and gold moved substantially higher. Many feel that this period remains unresolved and its resolution depends on the depth and severity of the deflationary cycle currently in force since 2008.
Period 6: Deflation of 2008 - ??
The chart below dates back to 1861 just prior to the start of the deflationary Period 2 and shows in graph form the purchasing power of gold during Periods 2 – 5. Interesting to note; when adjusted for inflation the current bull market (and record highs basis the U.S. dollar) has yet to exceed the highs seen in 1980 when the unadjusted high was $850.
.

Source: www.thechartstore.com
Expectations for the near to midterm:
Plucked from the Seeking Alpha headlines on Thursday, October 20, 2011:
The next big bubble: The amount of student loans taken out last year crossed $100B for the first time, and total loans outstanding will exceed $1T for the first time this year. And just like in the last subprime bubble, lenders have been "pushing loans to people who can't afford them." When borrowers are tapped out, and lenders plead ignorance, who will again be forced to pay for the bailout?
If you were thinking it was safe to get back in the water – think again! It only gets more confusing from here as we move from bubble to bubble. From deflation to inflation and back to deflation again. As the middle class is vilified and penalized for attempting to gentrify broken down inner city neighborhoods devastated by years of neglect. Many unsuspecting people paid inflated prices only to see the value of their home versus what was owed to the banks go in reverse as the subprime debacle sent real estate prices into a downward spiral.
Foreclosures skyrocketed destroying for many the dream of achieving financial security through home ownership. Corporate greed moved to unprecedented levels as C-level egos justify accepting and paying out multi-million dollar contracts and tens of thousands of lower level employees are laid off and the government (local, state, and federal) turns a blind eye to all as it sinks deeper into the dark cesspool of empty promises and corruption.
The global economic problems so long ignored and swept under the rug have come home to roost. I don’t believe there are any quick painless solutions. It took decades to arrive at this point – solving the problems and implementing solutions should not be expected to miraculously turn everything around in a month or two. It will take years.
Accepting reality and being prepared removes fear from the equation. Making solid and fact based investment decisions has become paramount in creating and protecting wealth. The bottom line here: It’s YOUR money! Who do you think is going to care more about it?
The Near Term Picture for Gold
I do not see the current deflationary cycle ending anytime soon. Interest rates are near zero and expected to remain at current levels into 2013. Inflation worries have evaporated for now and won’t likely resurface until solutions are put in place for the US, UK, and European Union to fix the broken economies. Unfortunately we are likely to see many more defaults (sovereign, municipal, corporate and consumer), bank failures, and currency declines as central banks attempt to “print” their way out of their respective problems. Gold will remain a major hedging source.
Within the precious metals and commodity markets, bull markets normally end with a parabolic thrust into the stratosphere. The monthly chart for gold (below) reveals that thus far the advance has been strong but steady without the parabolic nature to suggest the move is finishing. The fundamentals support the advance continuing. The technical picture, while near term revealing a much needed correction, remains underway that additional upside is likely before the larger bull market is exhausted and complete. Near term then, expectations would be for an additional decline into a cluster of support beginning at 1556.40 through 1535/1534. If this area contains additional selling, look for a smaller rally phase (several days to a couple of weeks) followed by another leg down likely pushing prices towards the next support cluster at 1482 to 1452.
The stochastic, MACD and MFI oscillators have all turned lower confirming the current drop off of the 1826 high. The stoch and MFI oscillators are pointing more sharply down giving support to an additional down leg occurring.

SPDR Gold Trust (GLD)
Expectations for GLD are the same as in gold. There is a cluster of support beginning at 153.60, 148.80, 142.55 and 137.35. Look for downside to be contained at the upper end of the zone before a small rebound rally takes place. An additional down leg should follow and drop prices deeper into the support zone before the larger advance picks up again.

Gold Mining Shares
Year– to–date gold mining shares have seen stronger selling. After producing strong returns on a 2 and 3 year basis, it appears that the correction underway in physical gold has produced some profit taking and portfolio reallocation within gold mining shares. The revere data hierarchy includes 101 companies (international and US based) within the gold sector, including companies involved in mining as well as exploration.
.

The graph above reveals that versus the S&P 500, gold mining shares have outperformed the S&P 500 over the long term with an impressive 152% return on a 3 year basis vs. 28% for the S&P 500. However, as noted, the S&P has outperformed this sector on a 3 month and year-to-date basis. I suspect though, that this will again reverse once the larger advance is again underway in gold.
Choosing which companies to invest in requires some due diligence. From the 101 companies included within the revere gold mining sector, I narrowed the field to seven. All have a current market cap of greater than $1 billion. The graph below reveals that while most outperformed or kept pace with the S&P 500 the list includes both leaders and laggards.
Kinross Gold Corp (KGC)
Kinross is engaged in the exploration, acquisition and development and operation of gold bearing properties. Clearly a laggard, Kinross remains somewhat of an anomaly. With strong cash reserves and medium to low debt the market continues to hold down prices. Tangible book value is 7.61 (current stock price 13.70 as of October 21st). Market cap is $15.6 billion and Kinross has strong holdings in the U.S., Chile, Russia, and Africa. What may be working against KGC is its relative low dividend yield of 0.89.
Newmont Mining (NEM)
Newmont is a gold producer and as of December 2010 had gold reserves of 93.5 million ounces with mining operations in North and South America, Asia Pacific and Africa. Newmont also has copper mining operations in Indonesia. Current market cap is $34 billion. Newmont trades at a low P/E of 15 as compared to the S&P 500 with a P/E of approximately 23. Current dividend yield is 1.95.
Randgold Resources Ltd. (GOLD)
Randgold Resources Limited is engaged in gold mining, exploration and related activities. As of December 31, 2010, the Company’s activities were focused on West and Central Africa. Thus far in 2011, Randgold has reported very strong year-over-year earnings. For the 2nd quarter 2011, they reported $1.24 vs. 0.38 in 2010 on revenue of $321 million vs. $102 in 2010. With a market cap of just over $9 billion, Randgold trades at a P/E of 44. Estimates are calling for FY earnings of $4.98 vs. $1.14 for FY 2010. A continued rally in gold prices should continue to benefit Randgold. In comparison to the S&P 500, Randgold has outperformed on a return basis across the board.

Conclusion
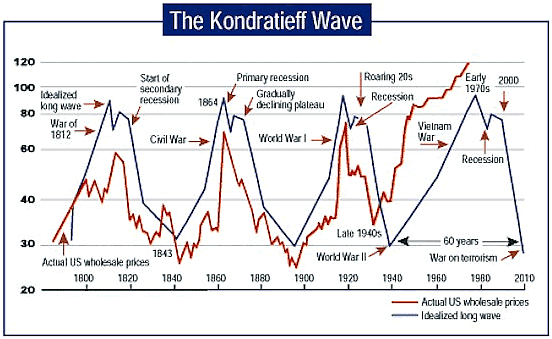
A discussion on deflationary or inflationary cycles should include a look at the Kondratieff Cycle theory based on Nikolai Kondratieff’s studies of economic, social, and cultural life proving that a long term order of economic behavior was in place and could be utilized in looking forward towards future economic developments.
The take away here is that the Kondratieff cycle is one of debt repudiation. A cycle where credit contracts and asset prices decline rapidly. Basically, the excesses of one cycle (the creation of too much money and credit) can not be sustained. The resolution being debt repudiation, which in turn creates the collapse of asset prices and economies based on capitalism to drop into a deflationary spiral.
The lessons of the past have been ignored and denied, which can only lead us to the inevitable destiny of repeating history yet again - mistakes and all. Fortunately though, while we don’t have enough power to stop this runaway train, there are steps that can be taken to mitigate the effects and emerge from the cycle bottom, not unscathed but in better condition than the majority.
Underestimating or ignoring the purchasing power of gold or its ability to hedge against deflation is akin to sticking your head in the sand at the beach to avoid being swept away by a tsunami. If gold is already a core holding in your portfolio, you understand the benefits. The opportunity to prepare presents itself almost on a daily basis. Take the time to review your assets and your portfolio, protecting and building on what you have earned is possible. An investment strategy that includes positions in dividend paying industry titans Microsoft (MSFT), Intel (INTC), Walmart (WMT), Coca-Cola (KO), and The Hershey Company (HSY) and deflation hedges (phsyical gold and silver, GLD, Silver ETFs, and gold mining stocks) are prudent and still available. Investors should do their own due diligence in determining what the correct investment is for them.
0 comments:
Publicar un comentario