Playing the Silver Goose

What's good for the goose is good for the gander. That old maxim was at the heart of a reader's comment on last week's feature, "Options Offer Clues To Gold's Direction."
If you saw last week's piece, you'll recall its premise: Compression in the CBOE Gold ETF Volatility Index (CBOE: GVZ) pointed to an eventual breakout. The odds of an accompanying upside price trajectory in the SPDR Gold Shares Trust (NYSE Arca: GLD) were then compared with those of a decline.
Our reader wanted to know if the silver market exhibited characteristics similar to gold. Well, in a word: no.
First of all, there isn't a ready marker for silver volatility as there is for gold. The CBOE Silver Volatility Index hasn't been launched yet, but we can get a clue about the market's expectations for silver—well, more specifically, the metal's proxy, the iShares Silver Trust (NYSE Arca: SLV)—by tracking the cost of SLV protective puts.
Like other forms of insurance, the cost of puts increases when buyers clamor for cover—that is, when the market's perceived risk of a price break increases. Prices likewise tend to fall when participants become complacent.
Prices of GLD and SLV puts generally move in the same direction, though the silver-tracking contracts tend to be—like silver itself—more volatile.
Gold And Silver Put Indexes
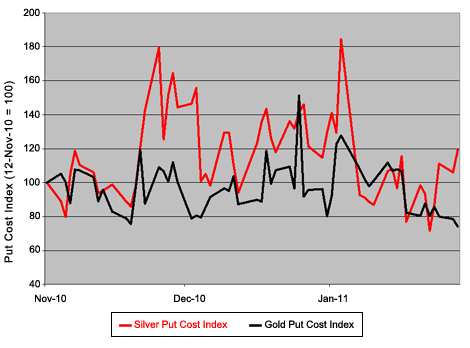
This month, however, the price trajectories started to diverge. Gold, which has recently lagged silver, is now perceived as a relatively low-risk trade. Focus on that word relatively.
SLV's historic volatility confirms this notion. Check the figures below against last week's article, and you'll see SLV's price variability is twice that of GLD's:
Recent SLV Volatility
Period
|
High
Price
|
Low
Price
|
Period
Gain/Loss
|
Actual
Volatility
|
Last 30 days
|
29.64
|
26.23
|
+5.5%
|
32.8%
|
Last 60 days
|
30.18
|
26.23
|
+7.0%
|
28.5%
|
Last 90 days
|
30.18
|
24.93
|
+9.2%
|
35.1%
|
Using the SLV trust's price and volatility history, we can outline some probabilities for the upcoming 30-, 60- and 90-day investment horizons.
The Next 30 Days
SLV Price
Level
|
End of
Period
|
Anytime
During Period
|
> 29.64
|
48.1%
|
100.0%
|
< 26.23
|
11.5%
|
20.6%
|
In Between
|
41.4%
|
SLV presently trades on either side of $30/oz. With the trust's current price momentum and volatility, it's a virtual certainty that its 30-day high will be touched or breached within the next month. Odds are slightly less than even, however, that SLV will end up higher than that by the period's end. The possibility of a downside excursion sometime within the next month is 1-in-5.
The Next 60 Days
SLV Price
Level
|
End of
Period
|
Anytime
During Period
|
> 30.18
|
41.3%
|
86.8%
|
< 26.23
|
15.9%
|
30.8%
|
In Between
|
42.6%
|
The market's upside bias doesn't change much over a two-month horizon. There's a 2.5x greater probability that SLV will end up above its 60-day high vs. a lower finish. Then again, that's about the same odds as a middling terminal price.
The Next 90 Days
SLV Price
Level
|
End of
Period
|
Anytime
During Period
|
> 30.18
|
42.4%
|
90.9%
|
< 24.93
|
18.3%
|
34.9%
|
In Between
|
39.3%
|
With heightened volatility over a three-month period, the chances of an upside digression increase, though not decisively.
What It All Means
As with any projections based upon probabilities, investors should always make allowances for unforeseen and extraordinary circumstances. There's no certainty here, or in any other prognostication, for that matter.
You can, however, take comfort knowing that this information just may prevent you from getting your goose cooked by precious metal volatility.
0 comments:
Publicar un comentario