Getting Technical
WEDNESDAY, NOVEMBER 3, 2010
Market Resets as QE2 Sets Sail
By MICHAEL KAHN
With the second round of quantitative easing unveiled, it's now time for the investors to favor the bulls or the bears.
FOR EIGHT STRAIGHT DAYS leading into the midterm elections, the Standard & Poor's 500 fluttered in the breeze. Even the expected outcome on Election Day was only able to win a small -- and fleeting -- victory for the bulls.
Now that the Federal Reserve announced it will buy $600 billion in Treasury securities, an amount within the expected range, it is time for a new trend to begin. But whether Wednesday's initial reaction is the indicator of the direction of that trend remains to be seen. With so much attention focused for so long on the Fed, we cannot assume anything.
Major stock-market indexes are at or near respective peaks set in April. The S&P 500, for example, is about 2% below, while the Dow Jones Industrial Average has been trading right at its respective April high (see Chart 1).
Chart 1
Technical indicators such as momentum have eased lower to reflect the past two weeks of flat trading. In ordinary times, when all eyes, ears and noses are not focused on the Fed to the huge degree they are now, it would be easy to conclude that the bears have gained the upper hand. A loss of momentum as major indexes run into resistance levels would indeed be sufficient. Add somewhat frothy sentiment polls showing investors have lost their fear, and it would not take much to bring out the sellers.
But news of QE2 (quantitative easing, part two) trumps the charts. It does not render them useless, but rather they are relegated to being tools to show if a major change in attitude just occurred. So far, based on the early reaction, investors are not moved.
So where are the markets now in relation to their respective crossroads? As mentioned, stocks had stalled at a place that represented technical resistance. That means a confirmed breakout above 11250 would be a bullish event for investors. Conversely, a breakdown below the recent range at 11020 on the Dow would mean the opposite.
In the bond market, the 30-year Treasury floundered since August (see Chart 2). Over the past few days, prominent bond-market analysts weighed in by saying QE2 will mark the end of a 30-year bull market in bonds. The chart does have some characteristics of a top in that it shows a somewhat sagging holding pattern for the past two and a half months.
Chart 2
Indeed the iShares Trust Barclays 20+ Year Treasury Bond (ticker: TLT) exchange-traded fund has been flirting with a breakdown for the past week.
I am not advocating either the bull or bear argument but rather pointing out that Treasuries are also at a crossroads where short-term action can dictate the next intermediate-term trend. A downside break of the pattern would help the "end of the bull" case.
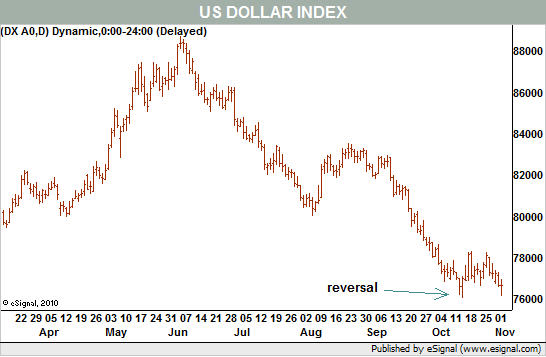
As for the U.S. dollar, it has not capitalized on bullish technical events that happened last month. On Oct. 15, it scored a technical reversal to the upside but has not been able to get a rising trend in gear (see Chart 3).
Chart 3
Overly bearish sentiment readings, which provide food for contrarians, are now gone and so are oversold conditions in momentum. Even the pickup in trading volume evident in the PowerShares DB US Dollar Index Bullish Fund (UUP) shown in last week's column was missing until the actual QE2 news was released Wednesday.
All of these markets made their moves in anticipation of QE2.
The magnitude of this nonmarket event has reset the charts, and all we can do is use the patterns that existed as fresh starting points.Michael Kahn, mutual fund co-manager, author of three books on technical analysis, former Chief Technical Analyst for BridgeNews and former director for the Market Technicians Association, also blogs at www.quicktakespro.com/blog.
Copyright 2010 Dow Jones & Company, Inc. All Rights Reserved
Home
»
Financial Markets
»
The Dollar
» MARKETS RESET AS QE2 SETS SAIL / BARRON´S MAGAZINE GETTING TECHNICAL ( HIGHLY RECOMMENDED READING )
jueves, 4 de noviembre de 2010
Suscribirse a:
Enviar comentarios (Atom)


0 comments:
Publicar un comentario