All Things Bearish
“There is only one side of the market and it is
not the bull side or the bear side but the right side.”
– Jesse Livermore
“At least us old men remember what a real bear
market is like. The young men haven’t got a clue.”
– Jeremy Grantham

Image: John Solaro via Flickr
With regard to the stock market, some people are true perma-bears
while others merely adopt a bearish outlook when indicators suggest trouble
ahead. There’s a big difference between the two.
Call it nature, nurture, or something else, but some people have a
reliably bearish outlook. You know before they say a word which way they will
lean. The same is true of perpetual bulls.
Perma-bulls and perma-bears serve a useful function: They pay
attention to information the rest of us may overlook because it doesn’t fit our
own biases. Occasionally they unearth important information we should heed. So,
it’s important not to discount everything the perma-types say.
As for me, I’m not perma-anything. Academic research confirms that
my attitude is the proper one: cautious optimism. I look for opportunity where
I can find it. And I find opportunity all the time, even though some of it is
out of my financial reach. There would be a dearth of financial activity if
investors and entrepreneurs did not aggressively seek opportunity. Perma-bears
may never get around to joining in the fun (unless maybe they think gold will
rise), and perma-bulls get periodically taken to the slaughterhouse when a
business-cycle recession unfolds.
Today we’ll review some unusually bearish indicators from several
sources, not all of them perma-bears, who lean bearish right now, even as US
benchmarks post new highs. You can discount what follows if you wish – but
don’t ignore it. Next week I’ll do an “All Things Bullish” letter. Please note,
I am not necessarily calling for an end to this amazing bull market. I’m
agnostic about that right now, because the traditional forecasting tools have
been taken to the woodshed, an issue I’ve talked about in many previous
letters. So we simply have to diversify trading strategies as opposed to being
permanently long or short anything.
OK, let’s take the plunge.
What’s a fair price for a share of stock? In theory, it’s easy to
define. The fairest price lies at the intersection of the company’s supply and
demand curves. The market price at any given moment reveals exactly where that
point is. The averaged prices of all stocks in an index, appropriately
weighted, tell us the same for market benchmarks.
In practice, the calculation is not so simple, because it is human
beings who make the decisions – if not themselves then by telling their
computers how to decide.
Humans don’t always make rational choices. The stock
market is the scene of a never-ending debate over who is the most rational
actor.
My good friend Steve Blumenthal of CMG and I wrote a joint letter
earlier this year called “Stock
Market Valuations and Hamburgers.” Four months later, that letter is even
more relevant. So are charts that my friends at Skenderberg Alternative
Investments shared in their latest monthly
review. (It’s free, by the way, and you should definitely ask
to join their list. Just be aware, they seem to have a permanently bearish
view, or at least they have recently. They are a fascinating source of all
things bearish each month.)
We begin with this Bank of America chart. Look how many hours the
average worker has to work in order to buy a notional share of the S&P 500.
Amazing. Kudos to the B of A analyst who worked this data up.
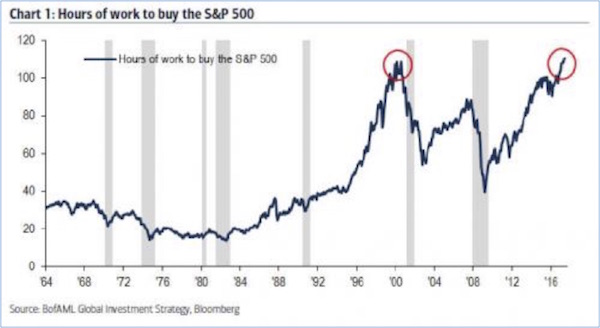
You can see how valuations that are measured in this way
skyrocketed in the 1990s bull market, then plunged in the following bear market
and recession. They climbed again ahead of the 2008 crash yet could not reach
their late-1990s peak – but now they have.
Equity capital is now at a historical high (going back to 1964)
relative to labor. Two factors could tug the line down to a more normal level:
sharply higher wages or sharply lower stock prices. Of course, I guess prices
could go sideways for a few decades as wages rise. But on the probability scale
I put that outcome pretty close to zero.
The S&P 500 is just one index, of course. There are many
others. In fact, choosing an index is now even harder than choosing a stock is.
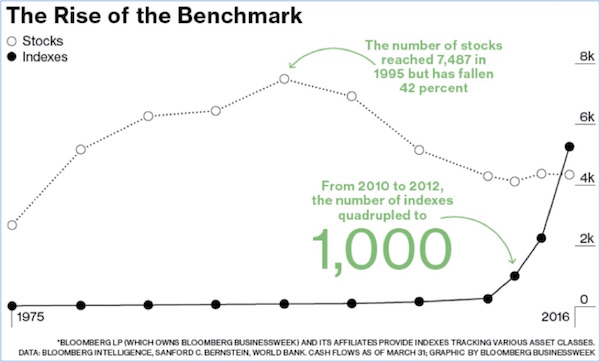
The upper line is staggering: Since 1995, the number of
listed stocks has fallen 42%? What market force could be causing that?
Actually, I can think of several. The financialization of the markets since
1995, making it cheaper to buy your competitors than to actually invest in
equipment to compete, has produced a constant stream of mergers. This is not
creative destruction. It has not resulted in new jobs and greater competition.
It is, rather, a result of the central banks of the world messing with the free
market and of businessmen optimizing the value of their earnings and cash.
When
cash is cheap, buy your competitors.
Another clear culprit is regulatory overreach, making it harder
for small companies to go public. I am closely aligned with a few private
companies. They could easily go public at nine-figure valuations, but the
thought of being public companies is simply abhorrent to their management. It’s
a been-there, done-that, have-the-scars-on-my-back-and-don’t-want-to-go-there-anymore
attitude. Serving on the boards of two small public companies (mostly as a
learning experience, because they do suck time) has inoculated me against
fantasies of going public. When Uber and Air BNB and a host of their fellow unicorns
do not go public and thereby allow the general market to participate in their
growth, something is clearly wrong with the system. Congress should step in and
take control of their regulatory creations, but it appears they can’t even do
the simple stuff like healthcare and tax reform.
In any case, just in the last year the number of indexes crossed
above the number of stocks – and is pointed higher still. The increasing
popularity of index-based ETFs is driving this trend, but at some point
momentum has to slow. But I don’t think that is going to happen soon, because
the money that is being made by successful ETFs is such a lure that anybody
with the distribution process thinks he or she can do it.
Duplicating somebody
else’s ETF? Not a problem; it’s all in your distribution chain.
And the market
is eating the index ETFs up.
Frankly, while I nostalgically wish for the old world of
investing, I’m focusing my own money management and assets on using these new
ETFs as trading vehicles, which is what they are perfectly designed for. A
“passive” index ETF that can trade exactly like a stock is an ideal vehicle for
expressing a diversified trading strategy.
Our next chart comes from my friend, the always-interesting John
Hussman, in his August
14 letter. It shows the S&P 500 Index value (left scale) against the
percentage of US stocks trading above their 200-day moving average (right
scale). Stocks in that category are usually said to be in long-term uptrends.
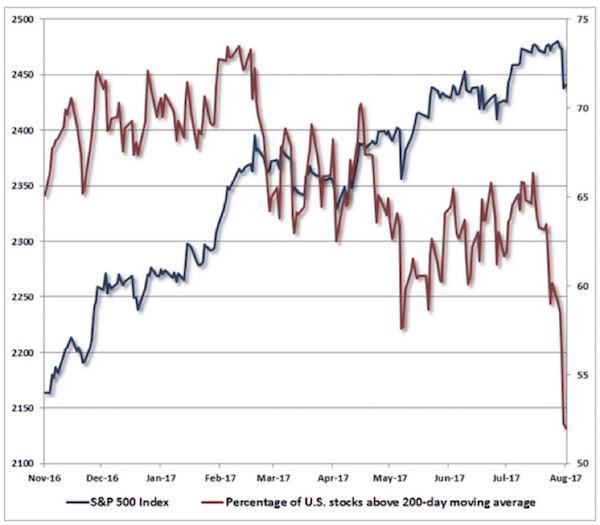
This chart reveals a major disconnect. Even as the index moves
steadily higher, the number of bullishly trending stocks has dropped
considerably. On the other hand, it’s still above 50%, so we can’t yet say most
stocks are losing momentum. This is a figure the bears are watching, though.
The significance of momentum was brought home to me last week when
I visited with one of my favorite hedge fund managers. I normally think of him
as a “left tail risk” guy, as he has made a great deal of money shorting the right
things over the past decade or so. So I was somewhat surprised when I found him
in an extraordinarily bullish mood. He was seeing value everywhere. We sat in
front of his Bloomberg screen and watched it light up. Even as we talked, he
was punching buttons and buying and selling, giving trade orders to his staff.
He pointed out that we have been in a “rolling bear market.”
Different sectors have gone into a bear-market phase, but the overall market
has kept on chugging upward. His remark brought to mind something I wrote about
in 2006, when everyone was saying housing prices couldn’t go down. The reality
was that every region I looked at had had a bear market in its housing prices,
just not at the same time as the rest of the country. Thus the housing price
index for the country looked quite sustainable. But for those of us in Texas,
scarred by memories of being able to buy homes at auction on the county
courthouse steps in Houston, the concept of falling home prices was very real.
I work closely with managers who “deconstruct” the S&P 500 and
invest in various sectors from time to time. Not quite sector rotation but a
close cousin. A few years ago I think everybody realized you didn’t want to be
in energy stocks. But the overall index kept steaming right along.
Stock valuations are the discounted values of future earnings.
Future earnings depend on future revenue, which may diminish whenever the
future includes a recession. So broad economic conditions are another factor to
watch.
Broad economic conditions depend ultimately on the consumer’s
ability and willingness to spend money. Last week’s July retail sales report
gave us a peek at that. Core retail sales rose 0.6% from June. The uptick was
more than analysts expected, and most categories were up, too. The exceptions
were clothing and electronics sales. The latter may have to do with potential
smartphone buyers waiting to see new iPhone models expected to debut this fall.
Peter Boockvar summed
up the bigger picture:
Bottom line, after the slowest y/o/y core sales gain since March
2016 in June of 2.5%, they rose by 3.6% y/o/y in July, which is about in line
with the 5-year average of 3.3%. This pace though still remains well below the
5%+ growth rates in the two prior recoveries. Here are some reasons why: many
consumers have jobs, but we know accelerating wage gains remain spotty; the
savings rate is near the lowest level since 2008; and credit card debt, student
loans, and car loans each total $1T+. Lastly, we know healthcare spending (high
deductibles) and rent have dominated the budgets of many.
Consumer spending, at least according to this report, is up
compared to the recent past but far lower than it should be at this point in
the cycle. Peter mentions debt as one factor. The New York Federal Reserve Bank
just updated its consumer
debt chart, giving us an enlightening breakdown.
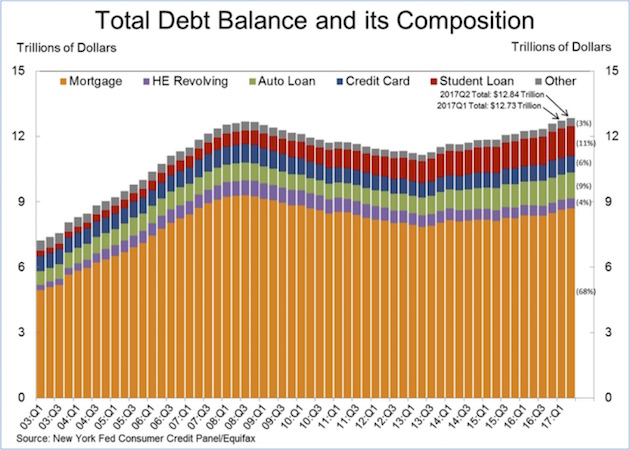
The bulk of consumer debt (68%) is still in residential mortgages.
Balances have climbed in recent years but remain below the 2007 peak. Both auto
and, most significantly (and perhaps ominously), student loan balances have
grown enough to offset the lower mortgage balances. Total debt is close to
where it was at the beginning of the last recession.
Keep in mind also that debt totals don’t capture all the
obligations a typical household faces. Vehicle and apartment leases, for
example, don’t show up in this chart. But they are nonetheless monthly bills
that consumers must pay.
That little omission might be important when (not if) the next
recession strikes. This could be soon, if an
indicator Michael Lebowitz uncovered proves reliable.
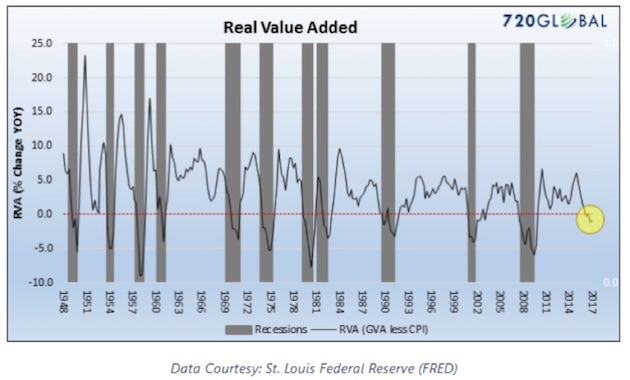
Real value added is the inflation-adjusted version of gross value
added. Here’s how Michael explains it:
GVA is a measure of economic activity, like GDP, but formulated
from the production side of the economy. It measures the dollar value of all
goods and services produced less all the costs required to produce those goods
or services. For example, if 720Global buys $100 worth of wood, $20 worth of
other materials, and employs $30 worth of labor to build a chair, we have
produced a good for $150. If that good is sold for $200, 720Global has created
$50 of economic value.
Over time, GVA tracks nominal GDP closely, but they can diverge in
the short run. That is happening right now. Three of the last four quarters
brought Real GDP growth – albeit not much – while RVA was negative. RVA below
zero, as plotted above, is closely associated with the onset of recessions.
This measurement technique is a little offbeat, but it is
intriguing. Maybe this time is different, but we know from all kinds of other
data that a recession should strike soon – by which I mean that one is quite
possible in the next 12–18 months.
Assume for the sake of argument that we find out in early 2018
that the US economy is, in fact, in recession. What will the Fed do?
That question should
be easy to answer. The Fed will do what it has always done: cut interest rates
to stimulate economic activity. Except that this time, the Fed has little room
to cut. Past recessions saw the Fed reduce the benchmark rate an average of 4–5
percentage points. Doing the same this time would put the federal funds rate
well below zero.
That’s right – NIRP in America. It can happen here. Worse, some
people want it to
happen here, among them Harvard economist Kenneth Rogoff. In a recent paper reported
by Bloomberg, Rogoff wrote: “The growth of electronic payment systems and
the increasing marginalization of cash in legal transactions creates a much
smoother path to negative-rate policy today than even two decades ago.”
I am on record as saying NIRP
will be a disaster if imposed in the US. I still believe it. I would like
to be able to assure you that whoever takes the reins at the Federal Reserve
next year will agree with me that NIRP is dangerous, but we don’t know who that
will be. President Trump is in no hurry to remove that uncertainty, either. It
is entirely possible that the Fed’s Board of Governors will have an entirely
new ruling coalition this time next year, and it might well include NIRP
advocates like Marvin
Goodfriend.
Where that outcome would lead us is anyone’s guess, but I’m
confident it would not be bullish for US stocks.
My friend James Montier, now at GMO, and his associate Matt Kadnar
have written a compelling piece on why passive investors should avoid the
S&P 500. Their essay, entitled “The
S&P: Just Say No,” argues that the forward growth potential of the
S&P 500 is significantly lower than that of other opportunities, especially
emerging markets. Let’s look at a few of their charts.
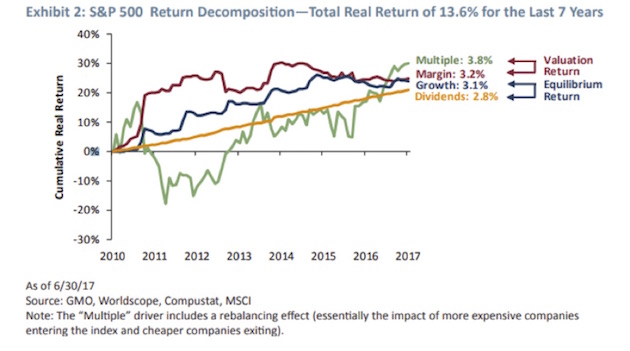
The chart above breaks the total return from the beginning of the
current bull market in the S&P 500 into its four main components:
increasing multiples, margin expansion, growth, and dividends. He notes that
this total return is more than double the level of long-term real return growth
since 1970.
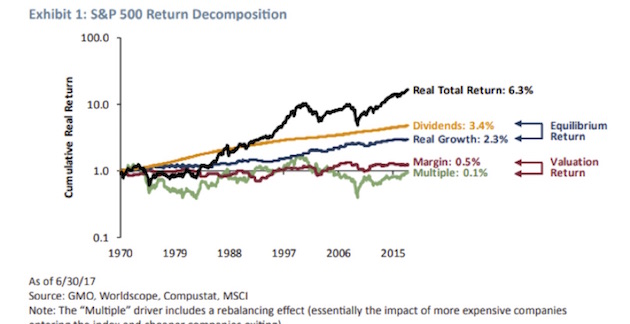
If earnings and dividends are remarkably stable (and they are), to
believe that the S&P will continue delivering the wonderful returns we have
experienced over the last seven years is to believe that P/Es and margins will
continue to expand just as they have over the last seven years. The historical
record for this assumption is quite thin, to put it kindly. It is remarkably
easy to assume that the recent past should continue indefinitely, but it is an
extremely dangerous assumption when it comes to asset markets. Particularly
expensive ones, as the S&P 500 appears to be.
More bluntly put, the historical record supporting this assumption
is nonexistent. It never happened. Just saying…
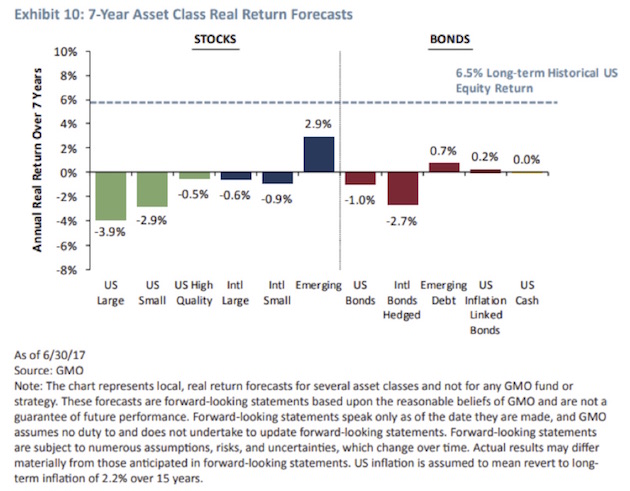
The authors then describe how they build their seven-year
forecasts of S&P 500 returns. They argue that for the next seven years
returns will be a negative
3.9%. Note that GMO is not a perma-bear money-management business. Their
forecasts were extremely bullish in February 2009. They are a valuation shop,
pure and simple. Investors – typically large institutions and pension funds –
that are leaving Grantham’s management firm now are going to regret it. The
consultants or managers who suggested that move are going to need to polish
their résumés.
The bottom line? “The cruel reality of today’s investment
opportunity set is that we believe there are no good choices from an absolute
viewpoint – that is, everything is expensive (see Exhibit 10). You are reduced to
trying to pick the least potent poison,” the duo says. Their Exhibit 10 is
shown below.
For a relative investor (following the edicts
of value investing), we believe the choice is clear: Own as much international
and emerging market equity as you can, and as little US equity as you can. If
you must own US equities, we believe Quality is very attractive relative to the
market. While Quality has done well versus the US market, long international and
emerging versus the US has been a painful position for the last few years, but
it couldn’t be any other way.
Valuation attractiveness is generally created by
underperformance (in absolute and/or relative terms). As Keynes long ago noted,
a valuation-driven investor is likely seen as “eccentric, unconventional, and
rash in the eyes of average opinion.”
In absolute terms, the opportunity set is extremely challenging.
However, when assets are priced for perfection as they currently are, it takes
very little disappointment to lead to significant shifts in the pricing of
assets. Hence our advice (and positioning) is to hold significant amounts of
dry powder, recalling the immortal advice of Winnie-the-Pooh, “Never
underestimate the value of doing nothing” or, if you prefer, remember – when
there is nothing to do, do nothing.
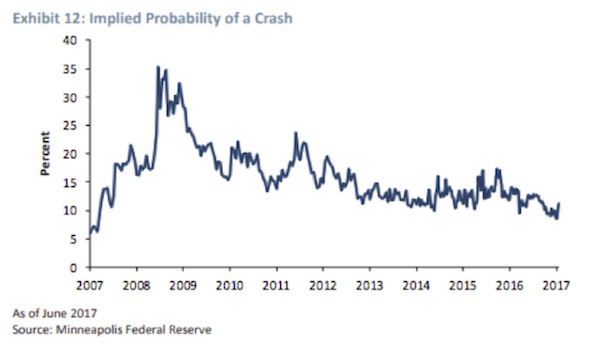
Markets appear to be governed by complacency at the current
juncture. Indeed, looking at the options market, it is possible to imply the
expected probability of a significant decline in asset prices. According to the
Minneapolis Federal Reserve, the probability of a 25% or greater decline in US
equity prices occurring over the next 12 months implied in the options market
is only around 10% (see Exhibit 12). Now we have no idea what the true
likelihood of such an event is, but when faced with the third most expensive US
market in history, we would suggest that 10% seems very low.
Those are wise words indeed.
I don’t feel as though I’ve traveled that much this year, but my
American Airlines AAdvantage account says I’ve flown 122,000 miles so far. I
will be traveling a great deal more between now and Christmas. Late next week
Shane and I will go to Colorado for four days at Beaver Creek and then spend
four days in Denver for a little R&R before the serious work begins this
fall. Late in September I will be in Chicago for two days for a speech, fly out
the next day for Lisbon, and return to Dallas to speak at the Dallas
Money Show on October 5–6.
I will be speaking at an alternative investments conference in
Denver October 23–24 (details in future letters). I will again be in Denver
November 6 and 7, speaking for the CFA Society and holding meetings. After a
lot of small back-and-forth flights in November, I’ll end up in Lugano,
Switzerland right before Thanksgiving. Busy times.
It is time to hit the send button. You have a great week!
Your cautiously optimistic analyst,
John Mauldin
0 comments:
Publicar un comentario