Gross Domestic Problems
John Mauldin
Fictitious Wall Street villain Gordon Gekko famously declared,
“Greed is good.” I think actual Wall Street titans would mostly disagree. They
would change one word. Instead of “greed,” they would say, “Growth is good.”
That is Wall Street’s real mantra. Growth is the magic elixir we all need.
Getty Images
The question, if we define growth as good, is how do we measure
it? Presently we use gross domestic product, or GDP. But GDP is showing its age
in the 21st century.
The measure was actually invented in the late
1930s when President Roosevelt needed some way to prove that his policies were
working. And at 85 years old, the old formula may be nearing time for
retirement.
The only way for Roosevelt to show that his policies were working
was to put government spending inside the GDP number. There was vicious
fighting among economists over whether he should be allowed to do so. Many
economists even argued that military spending should not be included in GDP
because it didn’t produce anything. And it’s true that overreliance on GDP has
often sent policymakers and business owners in wrong directions. We need a
better yardstick.
First, we must next decide what, specifically, a newly formulated
GDP should measure and how – and that’s a thornier question than you might
think. Today we’ll wrestle with that question and with some of the implications
of changing how we measure growth.
These are exactly the types of pressing questions we will be
attempting to answer at my upcoming Strategic Investment Conference. By “we,” I
mean the hand-selected, A-list cast of economic, investment, and geopolitical
powerhouses who will speak, and the audience that will respond to them. And for
SIC
2018 we really do have an all-star group, including “bond king” Jeffrey Gundlach,
hedge fund titan John Burbank, renowned historian Niall Ferguson, and some 20
more brilliant minds. At SIC you will get their latest and best thinking.
Better yet, SIC is small enough that you can usually find the speakers in the
hallway or after hours and interact with them.
In addition, there are a couple of hundred “core” SIC attendees
who come every year. They represent a remarkable range of talent, experience,
and wisdom. Some of them really ought to be on the stage. Instead, they’ll be
sitting with you, and you’ll find them friendly and ready to swap ideas. We’ve
seen countless business relationships form at SIC, and many more will happen
this year. I
hope you’ll join us, March 6–9, in San Diego.
Now, let’s see how we can fix the GDP problem, starting with where
we are right now.

Getty Images
Brian Wesbury, chief economist at First Trust Advisors, has been
calling our present recovery phase a “plow horse economy” for several years.
It’s not fast or impressive, but it’s not stopping, either. He’s been mostly
right, too.
Last week Brian said that the horse is now breaking free.
We’ve called the slow, plodding economic recovery from mid-2009
through early 2017 a Plow Horse. It wasn’t a thoroughbred, but it wasn’t going
to keel over and die either. Growth trudged along at a sluggish – but steady –
2.1% average annual rate.
Thanks to improved policy out of Washington, the Plow Horse has
picked up its gait. Under new management, real GDP grew at a 3.1% annualized
rate in the second quarter of 2017 and 3.2% in the third quarter. There were
two straight quarters of 3%+ growth in 2013 and 2014, but then growth petered
out. Now, it looks like Q4 clocked in at a 3.3% annual rate, which would make it
the first time we’ve had three straight quarters of 3%+ growth since 2004-5.
That was Monday. On Friday the Commerce Department released its
first 4Q GDP estimate at 2.6%. The estimate will likely change, but for now it
looks like Brian was a tad bit optimistic about Q4. But you should read
his outlook anyway, because he breaks his estimate down to the components
of GDP to show how he arrived at 3.3%.
The GDP formula is C + G + I + NX, where
C = Consumer spending
G = Government spending
I = Private investment
NX = Net exports.
G = Government spending
I = Private investment
NX = Net exports.
Net exports is exports minus imports, so it’s a negative number
for a country like the US that runs a trade deficit.
To get GDP, you just estimate the change in each component, weight
it by the appropriate amount, and add the components together.
That’s easy enough, but the calculation ignores whether those are
the right components and how to define them. The result is a lot of potential
distortion. For example, very little happens to GDP if you do your own
housekeeping. You consume some cleaning products, but your labor doesn’t count,
no matter how long you scrub.
But the labor does
count toward GDP if you hire someone and pay that person to do the exact same
work while you take a nap. The hired labor “produced” something of value, and
you did not.
To an economist, a barrel of oil selling for $100 has the exact
same effect on GDP as two barrels of oil selling at $50. Silly, but that’s the
way the accounting works.
Looking deeper, we realize that GDP is a historical artifact from
an industrial economy that doesn’t really exist anymore, at least in the US.
GDP worked well in the post-World War II era when the US economy thrived by
making material goods: trucks, cars, machinery, appliances, airplanes, houses,
and skyscrapers, etc. Output is easy to measure for such goods, as are the
kinds of inputs required to produce them, mainly large factories and raw
materials.
Today’s economy isn’t like that. Technically, manufacturing is
still 35% of GDP, but fewer than 9% of US workers are actually involved in that
manufacturing. We are producing more stuff than ever, but we are doing it with
far fewer people. And now we produce huge quantities of largely intangible
goods: computer software, movies, music, and so on. Those products are easy to
copy and hard to track. The productive capacity often exists inside some smart
human’s brain. How do you measure that?
Think also of how much more productive technology has made us.
That’s hard to measure, too. Imagine it’s 1975 and you want to know what GDP
growth was in 1972. Unless you happen to be an economist who keeps such figures
handy, you get in your car and drive to the library. You consult a card
catalog, note the Dewey Decimal classifications of a number of promising
volumes, then set off to search the shelves for them. When you chance on
something, you thumb back and forth through it to find the statistic you want.
Then you head back home and resume typing your research paper on a typewriter –
perhaps you even have an IBM Selectric!
To get that number now, of course, you whip out your smartphone,
type “us gdp 1972” into a search window and voila! I just did this, and
it literally took me less than five seconds.

Getty Images
Or consider travel. Remember the spiral-bound map books that
covered major cities?
In Dallas the company that made them was called Mapsco.
If your job involved going to unfamiliar places, you had to have one, and they
were expensive. And you had to buy a new one at least every few years. Now your
phone can get you anywhere you want to go, not just in your hometown but the
world over.
We could list thousands of little tasks that used to take hours
but now require only seconds. Add up all that time saved, then scale it over
hundreds of millions of workers. The impact on productivity is mind-boggling.
Does it show up in GDP? Not really. It may even reduce GDP, since we no longer consume as much
fuel, printing, and library space, etc. I grew up in the printing business, and
I would often print prospectuses. They were incredibly expensive and
time-consuming to produce.
Today a prospectus is a PDF file. Going back to the
old ways might improve the economic numbers, but would it help the economy? No
way. Yet we measure economic growth as if it would. That’s a problem.
Our antiquated methods matter to employment, too. I saw in a
recent Wall Street Journal
report the reduction
in labor needed to operate a power plant as we move from nuclear or coal to
natural gas or wind or solar. One company that is shutting down its coal plant
and laying off 430 workers will be opening a solar plant in West Texas that
will be one of the largest solar facilities in the country, operated by two
workers, who may actually be part-time. Put that in your future-of-work pipe
and smoke it.
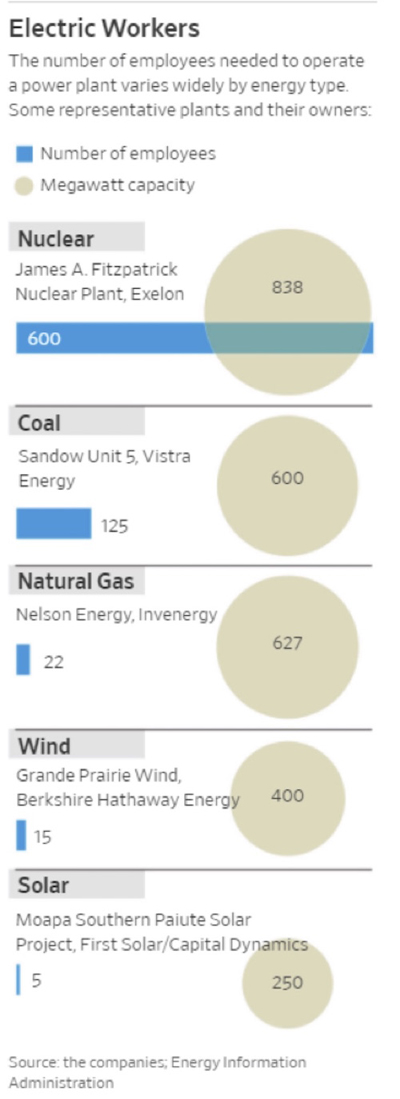
Coal power accounted for 39% of US electricity production in
2014, 33% in 2015, and 30.4% in 2016. There are 1308 coal-powered plants in the
US. Assume 125 workers per plant. That’s 163,500 workers. Now cut that number
by at least 80% if the plants all shift to natural gas, which they will over
time. That’s a loss of 130,800 workers.
And that’s assuming that they all go to
natural gas and don’t go to wind or solar. This is going to happen in the next
10 to 15 years. My math could be off here or there, but not by an order of
magnitude.
We are now producing vastly more energy with far fewer workers
than we did in GDP’s heyday. That’s a labor problem for sure, but it’s also a
growth measurement problem. We desperately need a better method.
Getty Images
Better Mousetraps
I could go on at length about the problems with GDP, but I’ve done
that before. Read “GDP:
A Brief But Affectionate History” and “Weapons
of Economic Misdirection” for the gory details.
A key question: Is GDP completely outmoded, or does it just miss
some things? If the latter, then maybe it just needs some tweaking instead of
total replacement. The wickedly brilliant Diane Coyle, a University of
Manchester economist, has been working on this issue for years. She proposed
in a recent paper with Benjamin Mitra-Kahn a series of incremental changes
that should help: better measurement of intangible goods, an adjustment based
on income distribution, and some other relatively simple changes.
Distribution effects are a problem whenever we look at GDP per
capita, as we commonly do when we compare nations. Almost everywhere, income is
far more concentrated at the top than it used to be, but the effect varies a
lot depending on where you are. It is entirely possible, indeed it is likely in
some places, for per capita GDP to rise sharply while most of the population
sees no change in its living standards or economic health. An adjustment to
compensate for this inequity is an excellent idea.
That point brings up a thornier problem, though. In whatever way
we measure it, is “growth” the right thing to watch? Does it really tell us
what we think it does? We look at GDP growth and assume a country that has it
is prospering. We think everyone who lives there must be thrilled. Often, they
have little reason to be.
The assumption works in the other direction, too. If GDP is flat
or falling, we see a recession and react accordingly. That is particularly the
case with political leaders and central bankers, who then introduce policies to
solve the perceived problem. These policies can be damaging if the problem is
less serious than central bankers think it is. This may be happening in the US
right now.
We’re asking GDP to do something it can’t. What we want is a
benchmark of economic progress.
Are a country and its people generally better off economically than they were
last year or five years ago? If so, by how much? Then we can start to know
which policies might help and which might hinder progress. Business owners
would be able to make better decisions, and ultimately everyone should feel the
benefits.
The problem is, measuring concepts like income inequality may
differently skew the witches’ brew that is GDP. The only part of the economy
that is really subject to serious increases in productivity is manufacturing;
and, as noted above, manufacturing involves less than 9% of the workforce. It
is hard to get increased productivity out of service workers. Now, you can use
technology to replace them, but that hardly improves their situation, even if
it does increase the production of gross domestic stuff per dollar spent.
People have proposed such measures. In 2013 the Skoll World Forum
launched the Social
Progress Index, defined as “the capacity of a society to meet the basic
human needs of its citizens, establish the building blocks that allow citizens
and communities to enhance and sustain the quality of their lives, and create
the conditions for all individuals to reach their full potential.”
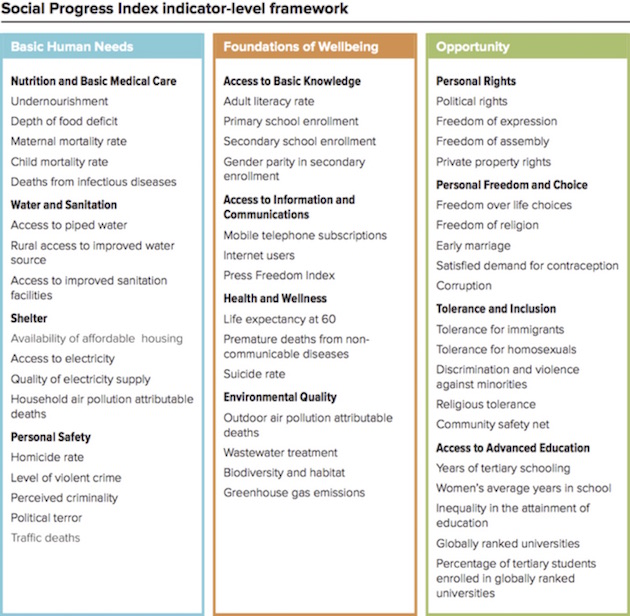
Some of those indicators could be hard to pin down. I don’t see
how you put a number on “religious tolerance,” or “tolerance for homosexuals,”
for instance. But the creators of the index are on the right track in that they
are attempting to measure well-being. I am not certain how widely accepted such
a measure would be, but it’s a start.
Another effort appeared in a 2010 book by economists Joseph
Stiglitz, Amartya Sen, and Jean-Paul Fitoussi, called Mismeasuring Our Lives: Why GDP Doesn’t
Add Up. Their suggestion is to continue using GDP but add other
data points to clarify it. They would use things like life expectancy, debt
levels, educational achievement, and other social progress metrics.
The World Economic Forum, which had its annual shindig in Davos
last week, took another stab at this problem with its “Inclusive
Development Index.” It too supplements GDP with other progress indicators.
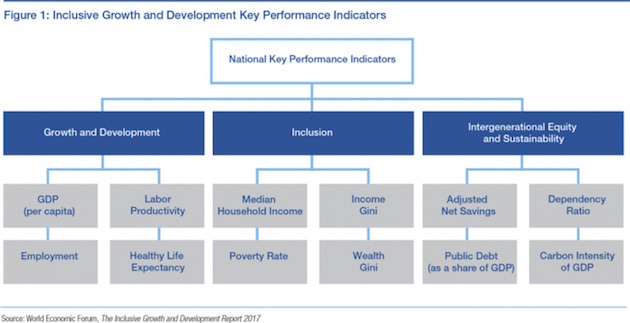
The WEF paper says GDP is fine as a top-level measure, but growth is a means to an end, namely
better living standards. Only by looking at those living
standards can we know if GDP growth is accomplishing what it should.
By WEF standards, the “most inclusive” advanced economies are
mostly European.
The US and Canada are not in the top 10. The most inclusive
emerging economies list is more interesting. Azerbaijan? Really?
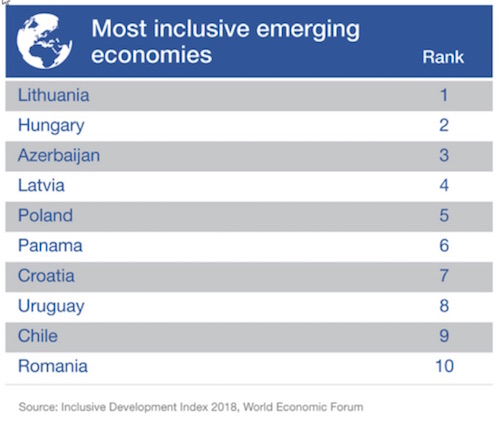
Lithuania leads the list, and from what I’ve heard, it probably
deserves to do so. (We have employees in Lithuania, and they are excellent and
productive workers, as are our Eastern European staff. We are truly a worldwide
virtual company.) The other countries on the list look like a strange mix at
first but make more sense after some thought. Several live in the shadow of
much larger neighbors, so maybe they are more willing to innovate. This list
would be a good starting point if you have money to deploy in emerging markets.
That’s a good thought: Countries that are growing in a fair,
sustainable way should attract investment. Often they don’t, because investors
want quick profits. Look at the move by corporations to increase the number of
temporary workers and contract workers so that they are not so much paying for
employees as paying money for actual production, without having to cover a lot
of the extra benefits that normally go along with traditional employment.
This is a particular complaint that I hear from the friends of my
kids, especially the Millennials. They need to hold two part-time jobs in order
to make ends meet, and generally those are not jobs that pay a great deal. The
gig economy is not all that it’s cracked up to be. The drive by senior
management to create short-term profits and to see employees as liabilities
rather than as partners in the business process will create a great backlash in
coming years.
I’m going to stop here because the next section of the letter
would be at least as long as this letter is so far. But let me tease you for
next week. I think I’m getting ready to start talking about the probability of
a recession before the 2020 election cycle. I see structural problems, monetary
policy errors, and a tax cut that is not going to produce the results that the
Reagan tax cuts did. M2 money is not even growing at 2%. The savings rate is
the lowest it has been for 70 years except for one quarter in 2005; and even
though consumer spending was strong last quarter, it came from much-reduced
savings and borrowing, much of it on credit cards as a result of the two
hurricanes and other disasters and longer-term challenges.
So while on the surface 4.4% nominal GDP growth and 2.6% real
growth look pretty good, when you really begin to inspect the engine of growth,
you find less under the hood. The velocity of money keeps falling. Our
demographics mean that we are not adding workers, and the latest immigration
proposal would reduce the number of immigrants and potential workers. And while
I am all for allowing the so-called Dreamers to be allowed to stay in this
country – the only home country they have known – we do need to be a lot more
strategic about allowing potential workers into this country.
After all, GDP is simply the number of workers times productivity.
With the number of workers tailing off and with productivity as weak as it has
been, the sugar high that the economy has been on is going to wear off. Let me
hasten to say, I don’t think nearly enough credit has been given to Trump for
changes in the regulatory environment. It’s not merely the reduced number of
regulations, it’s the attitude of the regulators that I keep hearing
businessmen talk about. Given that I am in highly regulated businesses, I hope
to enjoy that new environment sooner rather than later.
Sonoma and San Diego
I will be in Sonoma with my friends at Peak Capital in late
February, and then of course I’ll head to San Diego for my conference. I’ll
arrive a few days early and maybe stay an extra day just to relax from the
adrenaline rush.
My travel seems to have slowed down somewhat, as more people have
been coming in my direction lately, keeping me from having to get on the road.
And that is a good thing.
Being in and out of the cold in Boston last week – even though I
was dressed for the weather – must have weakened my immune system, and then I
sat in the plane across the aisle from somebody who was coughing his lungs out.
But whatever the reason, I have had a serious head cold that is finally
starting to get somewhat better. Last night was the first decent night’s sleep
I’ve had. But I shouldn’t complain, as I rarely get sick. And at least I
haven’t had a run-in yet with this season’s flu, which I am told is really
devastating.
I’m spending a great deal of time on the phone, talking with
speakers who will join us at the Strategic Investment Conference, going over
details and getting a heads-up on where they are going with their
presentations. I am actually shuffling the speaking order around in order to
make things flow better. Planning this conference is my personal art form, and
from the response I get, it seems I do a reasonably good job. But it helps to
have an incredible team.
Shannon Staton is the primary reason it all comes
together. We are looking to add one or two more speakers and panel members that
I think would be strategic, but with the conference just six weeks away, we are
really having to lock things in.
Let me wish you a great week, and I think I will make myself some
nighttime TheraFlu, which seems to help, and then began to wind down for the
weekend.
Your worried about Federal Reserve monetary policy errors analyst,
John Mauldin
0 comments:
Publicar un comentario