Wages vs. Jobs
(Excerpted from the August 2017
edition of A. Gary Shilling's INSIGHT
newsletter)
Real wages have been stagnant in
the U.S. and other developed countries for over a decade.
As we’ve discussed in
numerous past Insights,
this has made people “mad as hell” and has resulted in populist uprisings that
spawned Brexit and the election of Donald Trump. Extremely aggressive monetary
policy that reduced central bank-controlled interest rates to essentially zero
did little to revive economic growth since creditworthy borrows already had
plenty of money and banks, scared and chastened after the financial crisis, had
little desire to lend to the rest.
Just Around the Corner
Yet, the Fed, first and foremost,
but other major central banks as well remain convinced that rapid economic
growth and surging labor costs are just around the corner, so they better tighten
credit now to head off these threats of serious inflation. It appears that
credit authorities believe the nation is in a typical 1950s-1960s business
cycle and are not taking into account the many significant economic changes in
recent decades. A number of these explains why labor markets are perplexing in
the context of that earlier era, but quite rational in today’s climate.
Here are six major aspects of the
current atmosphere.
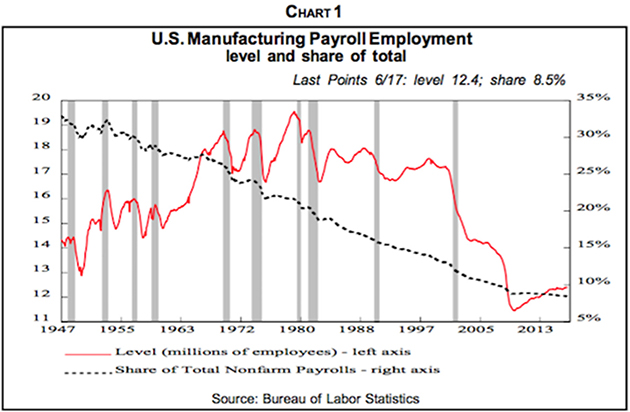
1. Globalization. First and
foremost is globalization, the shift of manufacturing and other production in
the last three decades from developed countries in Europe and North America to
developing economies in Asia, where costs are much lower. The resulting
collapse in manufacturing employment in the West has been dramatic (Chart 1).
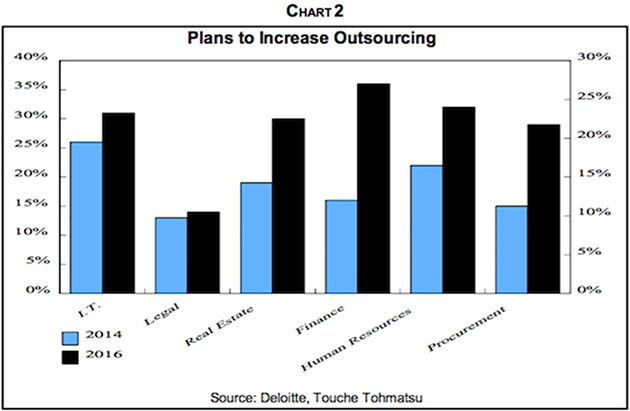
Furthermore, legal, accounting,
medical billing and other services are being outsourced abroad, putting
downward pressure on jobs and compensation in those sectors as well.
A recent
survey by Deloitte reveals the rapid rise in respondents’ plans to outsource
many functions (Chart 2).
As economies grow, a growing share of spending is on services and a declining
portion on goods.
Note that with globalization, many
U.S. goods prices continue to deflate. Meanwhile, domestic and international
downward pressure is being felt on services as diverse as education, health
care, retailing and financial service fees and commissions.
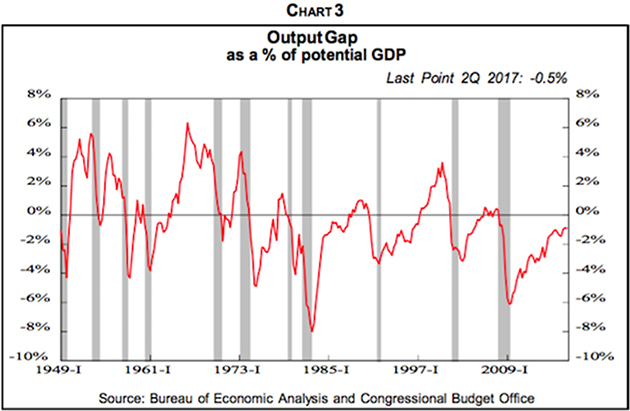
2. Ample worldwide men and
machines also restrain U.S. wages and prices. Some policymakers fret that
the output gap – the percentage of unutilized output in the U.S. economy – is
shrinking fast (Chart 3).
This is debatable since the economy’s output potential isn’t a fixed number but
depends on speed of growth, which influences the economy’s flexibility. It can
adapt much better to slow, predictable growth than to an unexpected surge in
demand.
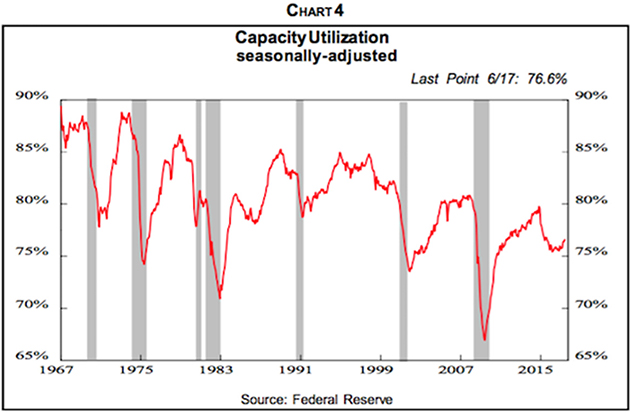
Also, capacity is sensitive to
wages and prices. Higher pay attracts new workers who otherwise are comfortable
drawing welfare, unemployment and disability benefits. By the same token, high
selling prices can make otherwise obsolete machinery profitable to utilize.
On numerous tours of economic
consulting clients’ factories, we’ve seen decades-old equipment next to
state-of-the-art machines. The old machines are normally unprofitable to
operate, but become so in times of high demand for their output and leaping
prices.
The current overall operating rate (Chart
4) remains below the levels that in the past have initiated capital
spending surges, but even previous peaks would not indicate full capacity under
the right economic circumstances.
More important, in today’s
globalized world, supplies of labor and productivity capacity need to be
considered on a worldwide basis, but data is woefully lacking, especially in
rapidly-expanding developing economies. By all accounts, global supplies are
ample and will remain so, barring all-out protectionist wars and tariff walls
in advanced countries that could drastically chop imports.
Like Japan before her, China is
moving up the scale of manufacturing sophistication while low-end output is
shifting to lower-cost venues such as Vietnam, Pakistan, Indonesia and our
long-term favorite, India, which is already robust in technological services
exports.
With her rising population growth,
democratic government, large privately-owned companies, the English language
and a legal system inherited from the British, India seems destined to best
China in economic growth and power in the long run, as we have discussed in
past Insights.
Prime Minister Narendra Modi’s efforts to reduce widespread corruption,
oversized subsidies for the rural poor, and excessive government regulations
are all encouraging.
3. U.S. labor surpluses.
Back in December 2012, the headline unemployment rate was 7.7% and the Fed
stated that the federal funds rate, then in the 0-¼% range, would be
“appropriate at least as long as the unemployment rate remains above 6.5%,
inflation one and two years ahead is projected to be no more than a half
percentage point above the [policy] Committee’s 2% long run goal and long-term
inflation expectations continue to be well anchored.”
U-3 is a well-known measure of
labor market conditions and that's probably why the Fed picked it, but it's a
very poor indicator of labor market slack or tightness. It is the ratio of
those actively looking for work to that group plus the people who are employed.
Consequently, the unemployment rate
declines if more are employed but it also falls if fewer are looking for jobs.
The latter has dominated in recent years, as shown by the big drop in the labor
participation rate, the percentage of all Americans over age 16 who are
employed or actively seeking jobs (Chart
5). It peaked at 67.3% in early 2000 and fell to 62.4% in September
2015.
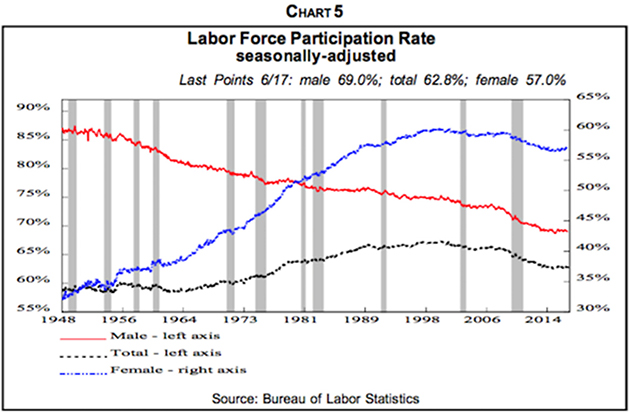
As reported in past Insights, our analysis
revealed that about 60% of that decline was due to retiring postwar babies. The
remaining 40%, however, was composed of those under 35 years old who stayed in
school in the hope that more education would improve their job prospects in the
weak job atmosphere initiated by the 2007-2009 Great Recession, and those
35-to-64 who gave up looking for work in a tough employment climate.
Furthermore, the labor
participation rate earlier was driven up by women entering the job market, but
by the early 2000s, they joined men in reducing their involvement. Further
postwar baby retirements in future years will cut participation rates even
more.
Without the precipitous drop in the
labor participation rate, the headline unemployment rate, now at 4.4%, would be
in double digits. The Fed, of course, was forced to abandon its 6.5%
unemployment rate target for raising interest rates as U-3 fell and pierced
that level in April 2014 when it fell to 6.2%. And U-3 continues to be a poor measure
of slack in the labor market for several reasons.
Poor Measure
To begin, our analysis shows the
growth in the working-age population will provide ample people to fill further
available jobs, even if economic growth jumps from the economic recovery average
of 2.1% to our forecast 3% to 3.5% – assuming they have the needed skills.
In addition, many of those who
dropped out have not disappeared but may well be drawn back to work for
expanding job opportunities. Indeed, the labor force of those age 20-to-29 has
been growing since 2012 (Chart
6).
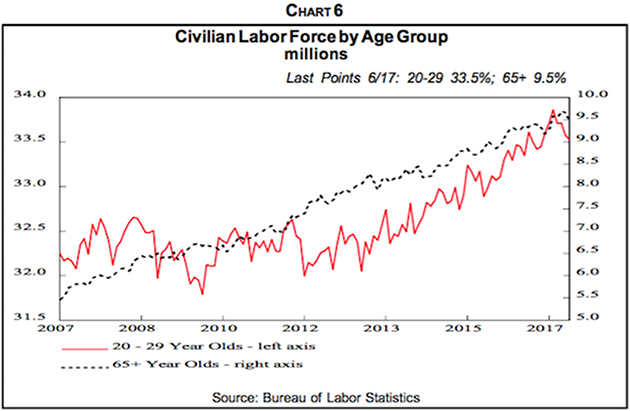
At the same time, people over 65
who are employed or actively looking has been rising since the early 1990s.
Many seniors remain in good health and prefer active work to vegetating in
front of the TV. Others, among them many postwar babies born in the 1946-1964
years, have been notoriously poor savers throughout their lives and need to
keep working due to lack of retirement assets.
As a result of these developments
on the young and old ends of the age spectrum, the total labor participation
rate appears to have bottomed out. From September 2015 to this June, it rose
from 62.4% to 62.8%.
Also, keep in mind that, like
capacity utilization data, measures of labor market slack on a global basis
aren't available. It certainly appears, however, to be ample, and the skills of
workers in Asia are rising rapidly, not only in the production of goods but in
services as well.
4. Cost-Cutting. The Fed
was, no doubt, aware that after the Great Recession, U.S. corporate
cost-cutting propelled earnings in lieu of significant unit volume growth and
with negative pricing power. Since most business costs, directly or indirectly,
are for labor, those actions axed employee compensation’s share of national
income while profits’ share leaped (Chart
7).
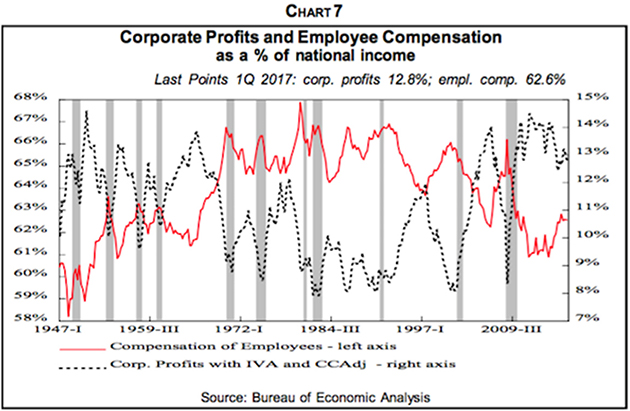
In the last several years, however,
those share movements have reversed. Whether that’s due to exhausting
cost-cutting or picking all the low-hanging fruit while waiting for more to
ripen remains to be seen, but compensation’s rising share of national income
probably has gotten the central bank’s attention.
5. Shift to lower-paid jobs.
Another wage-restraining force in this economic recovery is the job-creation
emphasis on low-paid U.S. jobs, as we’ve explored in past reports. It’s been in
low-paid sectors such as retail trade where many more people have gained jobs
since the depths of the Great Recession, while real wages in retailing have
risen just 0.9% in total since the beginning of 2007.
Similarly, the 3.0 million rise in
hotel clerks, waiters and other leisure & hospitality jobs in this business
recovery has far outstripped the 900,000 gain in manufacturing. In June,
manufacturing employees were paid $26.51 per hour, 1.72 times the $15.43 per
hour earned by leisure and hospitality workers. In addition, manufacturing
employees worked 1.56 times as many hours, so their weekly pay, $1,081.61, was
2.69 times the $402.72 paid to the average leisure and hospitality employee. So
the effect of differing sector employment growth has been to retard average
wages.
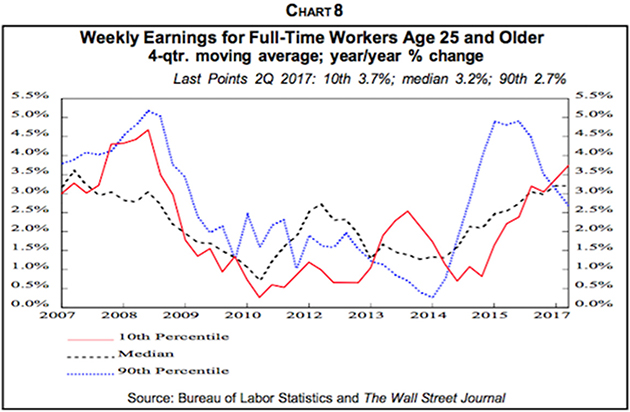
The robust demand for low-skilled,
low-paid workers is pushing up their wages as is the proliferation of minimum
wage increases in many states and cities. But at the same time, pay increases
of those in the 90th percentile are slowing (Chart
8). Nevertheless, so far in this expansion, workers in the 90th
percentile have received 20% pay increases while those in the bottom 10th
percentile have gained 12.5%, not enough to offset inflation.
Even within industrial sectors,
wages have been depressed as postwar babies at the top of their pay scales
retire and are replaced by lower-paid new recruits. In contrast, during the
Great Recession, layoffs were centered in lower-paid people, many of whom were
nice to have around in the previous good times, but not necessary when business
declined. That elevated average wages.
More recently, however, new hires
have come in at the low end of pay raises, depressing average pay. Furthermore,
more so than in past recessions, part-time workers have moved to full-time jobs
and 80% of them do so at below-median wages, according to a study by the San
Francisco Federal Reserve.
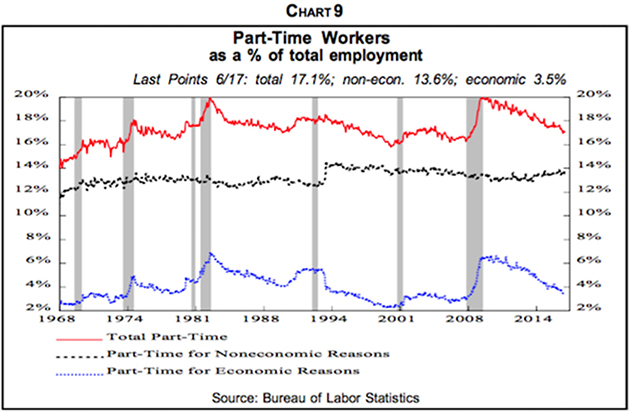
This is especially true for those
working part-time “for economic reasons,” i.e., those who want to work more
hours than they are offered (Chart
9). This, too, pulls down overall median compensation. Also, 79% of
those who have gained full-time jobs but were previously not in the labor force
got below-median pay. Ditto for 72% of those previously unemployed when they
got Jobs.
As a result of these pay
differences, the Atlanta Fed’s Wage Tracker series, which measures the wages of
continuously full-time employees, has recovered more sharply than other
earnings series, even the Employment Cost Index that corrects for employment
shifts among industries (Chart
10).
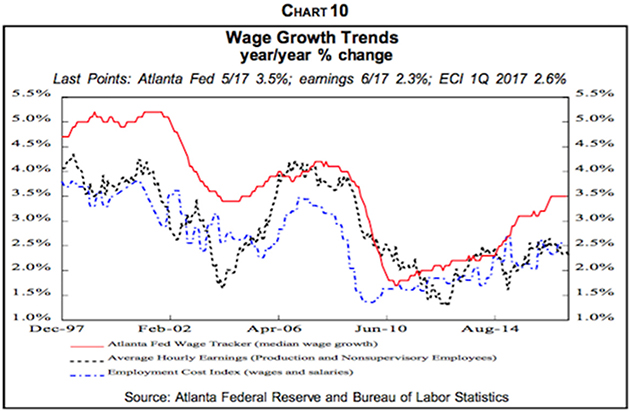
This is a phenomenon similar to the
ongoing income polarization discussed earlier. In any event, the fact that
those with continuing full-time jobs have fared better than the rest doesn’t
mitigate the depressing effect of consumer purchasing power on overall slow
wage growth.
6. Union membership. With
globalization devastating U.S. manufacturing jobs and cost-cutting pressure on
those that remained, union membership in the private sector has collapsed from
a quarter of the total workforce in 1973 to 6.4% last year.
This has had tremendous depressing
effects on wages since private union jobs pay 19% more, on average, than
non-union positions in base pay and over 50% more when health care, retirement
and other benefits are included.
State and local government
employees have enjoyed much higher pay and even more lush benefits than private
sector workers. Nevertheless, municipal employee compensation is under fire
from the many states and local governments with strained budgets and
vastly-underfunded pension plans. At the same time, municipal union membership
is slipping.
Quiescent Labor,
Aggressive Management
Despite their lack of purchasing
power growth, many employees are reluctant to demand higher pay. Memories of
joblessness in the Great Recession are still fresh, as is the understanding
that those who quit in the hope of getting a higher-paying job will probably
end up with lower pay.
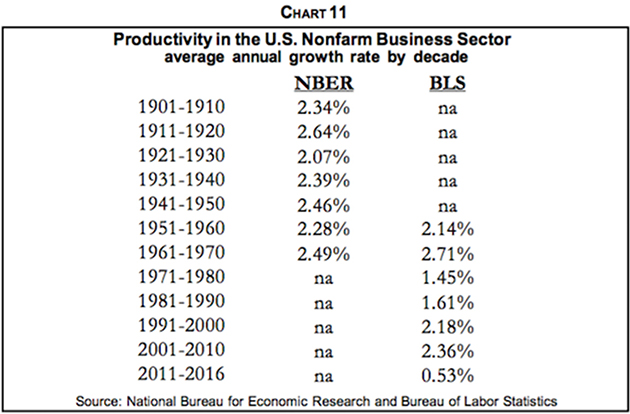
On the other side, most employers,
in the face of excruciating foreign and domestic competition, don’t believe
they can pass on increased labor costs through selling price hikes. The only
alternative is increased productivity, which makes it possible to pay higher
wages without cutting into business profits. To put it another way, the value
added of any factor of production, including labor, must exceed its costs. And
the miserable productivity growth in recent years (Chart 11) has not provided the value added to
justify higher wages.
7. Productivity. The
definition of productivity is simple. It’s the physical output in relation to
all required inputs. It’s the measurement that’s tough. You can measure the
widgets stamped out per hour on a punch press, but how do you determine the
output of a cell phone?
Furthermore, the number of hours
worked is straightforward, but the quality of the work by different employees
is problematic. Also, other inputs such as capital, technical expertise and
managerial talent are hard to measure. Consequently, the usual but
unsatisfactory measure of productivity is output per hour worked.
By this measure, productivity
growth averaging 0.53% per year in the 2011-2016 period has been far below the
earlier norm of 2% to 2½%. The reasons for the slowdown are unclear, but many possibilities
are being discussed that suggest that productivity growth is being
significantly understated.
Measurement of Output
Cell phones and other high tech
gear probably enhance efficiency of doing business far beyond their cost.
Consider the value of time saved by shopping online, which is not captured in
the statistics. The costs of new wonder drugs, high as they are, probably do
not measure their value in saving lives.
Another explanation for slow U.S.
productivity growth as officially reported is that much of it is hidden
overseas. In order to avoid paying U.S. taxes, American multinationals have
moved intangible assets overseas. Estimates are that between 2004 and 2008,
these actions slowed U.S. reported productivity gains by 0.25 percentage points
per year.
Delays
We’ve discussed in many past Insights that
productivity-soaked new technologies mushroom but often take decades before
becoming big enough to raise the overall productivity needle.
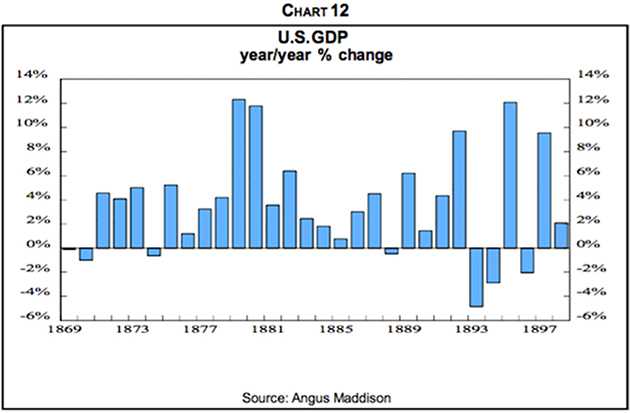
The Industrial Revolution began in
England and New England in the late 1700s, but only after the 1860-1865 Civil
War had it expanded to the point of hyping nationwide productivity. As a
result, between 1869 and 1898, real GDP leaped by 4.32% per year (Chart 12) and output per
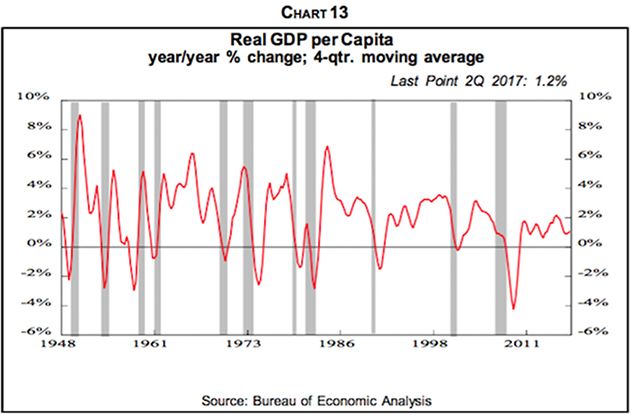
capita leaped at a 2.11% annual rate. In contrast, it’s now rising around 1%
annually (Chart 13).
We continue to believe that many of
today’s new technologies such as biotech, robotics, cell phones, computers and
self-driving vehicles are still in their infancy. In time, however, they should
expand to the point that their rapid productivity advances propel overall
productivity and economic growth.
That’s a big reason we expect a
return to 3% to 3.5% real economic growth in the years ahead, especially as
overall demand is driven by fiscal stimuli.
CapEx and Productivity
Many believe that the lack of
significant productivity growth in recent years is due to sluggish capital
spending, and they attribute that to excessive government regulations, business
uncertainty over global developments and lack of clear policies in Washington.
Our research, however, indicates
that the greatest driver of plant and equipment spending is operating rates.
When they’re high, capacity is strained and more is needed to fulfill orders.
When they’re low, as in recent years, there’s little need for more capital
spending beyond that aimed at cutting costs and improving efficiency. We found
other forces have only small influences on plant and equipment outlays,
including corporate profits, cash flow and the growth rates of capacity
utilization.
Improved productivity may be
embedded in new plant and equipment, but there’s little evidence that big
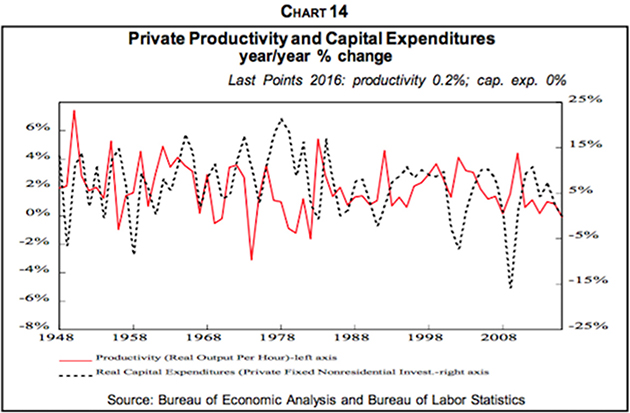
increases in capital expenditures result in surges in productivity. Chart 14 shows the growth
rates of the two, and it’s clear that there is little correlation between the
change in capital expenditures and the change in productivity. The correlation
has an R2 of just 0.8% on a quarter vs. same quarter basis. Leading and lagging
data don’t help much later. It shows that a productivity rise now promotes
capital spending four quarters later, the reverse of what you’d expect, and
that R2 is still a small 31.5%.
Productivity Outlook
Our conclusion is that rapid
productivity and, therefore, the wherewithal to increase real wages will revive
with the resumption of rapid economic growth in several years, the result of
massive fiscal stimuli as well as the maturation of today’s new technologies.
Other forces may well push in the same direction.
They include significant tax
reform, significant government deregulation (but don't hold your breath; every
president since Jimmy Carter has attempted to reduce the financial costs of
regulations, but with little success), education reform, unifying licensing
requirements, which often vary widely by state, to improve labor mobility and
reforming disability, Social Security and other programs that can encourage
people not to work.
Also, there’s nothing like a
stronger economy to create labor demand and the resulting high employment and
wages. As noted earlier, we foresee this in several years as a result of
massive fiscal stimuli, spurred by voters “mad as hell” over weak purchasing
power for over a decade.
0 comments:
Publicar un comentario