Bill Gross at His Best
John Mauldin
I normally read Bill Gross’s monthly letter the day of or shortly after when it comes out. For whatever reason, I didn’t get around to his early June letter until a few days ago. It has been a few years since I have sent his letter out as your Outside the Box for the week, but I thought this one was so good that I needed to send it on. As it turns out, I went this morning to get it from his website and found that his July letter is out, and it is just as good. Since he writes relatively short letters, I’m going to use both of them.
The first one deals with the expectations that most investors have about future returns over the long term – as opposed to what reality actually suggests. Of course, your mileage may vary, depending on how you choose to create your portfolio, but the average investor is at best looking at about a compound 4-5% over the next 10 to 15 years. And that’s if everything works and we see the top end of the expected returns. Given current bond yields and stock valuations, that outcome may be unlikely.
Bill’s take is not significantly different from what I’ve been writing, but he makes a number of very good points and has data sets that are really worth paying attention to. Plus, Gross is just a fun writer.
He starts with the simple game of Monopoly that we are all familiar with and then begins to develop an analogy to the real economy. Central banks keep increasing the amount of money you get every time you pass Go. If that happens in Monopoly, your investing strategy changes significantly, since the price of assets goes up because the supply of money increases at an ever faster rate. Which means that the velocity of money rises until at some point you have a problem. Quoting:
[H]owever with yields at near zero and negative on $10 trillion of global government credit, the contribution of velocity to GDP growth is coming to an end and may even be creating negative growth as I’ve argued for the last several years. Our credit-based financial system is sputtering, and risk assets are reflecting that reality even if most players (including central banks) have little clue as to how the game is played.
We’ll going to start with his June letter and then segue right into today’s July letter. He is shouting a warning about the viability of the current economic system. He didn’t quote Yeats, but I will: “The centre cannot hold.”
We live in interesting times. We continue to see repercussions from Brexit, and the other major players, in Europe, China, and Japan seem to be in a downward spiral (not to mention bubble-like issues in Canada and other parts of the world).
The world is quickly getting far more complex, something that central banks’ (and everybody else’s!) models can’t capture. We are tiptoeing into a period of enormous uncertainty. Bill Gross focuses on low interest rates and high asset valuations; but given the odd new world of central bank-influenced markets, there is no reason valuations can’t go higher and interest rates even lower. I am becoming increasingly concerned about uni-directional funds, except as trading vehicles. Long-only equity funds seem problematic, at least from my view here in Dallas.
That’s enough for this week. I’ll leave you with the fun of reading two well-written essays from Bill Gross – even if they don’t exactly have good news for us. I trust your summer (if you are in the northern Hemisphere) is going well. Have a great week!
Your trying to get an overview on the map of the future analyst,
John Mauldin, Editor
Outside the Box
Bon Appetit!
(Originally published on the Janus Capital website, June 2,
2016)
The economist Joseph Schumpeter once remarked that
the “top-dollar rooms in capitalism’s grand hotel are always occupied, but not
by the same occupants”. There are no franchises, he intoned — you are king for
a figurative day, and then — well — you move to another room in the castle;
hopefully not the dungeon, which is often the case. While Schumpeter’s
observation has obvious implications for one and all, including yours truly, I
think it also applies to markets, various asset classes, and what investors
recognize as “carry”. That shall be my topic of the day, as I observe the
Pacific Ocean from Janus’ fourteenth floor — not exactly the penthouse but
there is space available on the higher floors, and I have always loved a good
view. Anyway, my basic thrust in this Outlook will be to observe that all
forms of “carry” in financial markets are compressed, resulting in artificially
high asset prices and a distortion of future risk relative to potential return
that an investor must confront.
Experienced managers that have treaded markets for
several decades or more recognize that their “era” has been a magnificent one
despite many “close calls” characterized by Lehman, the collapse of NASDAQ
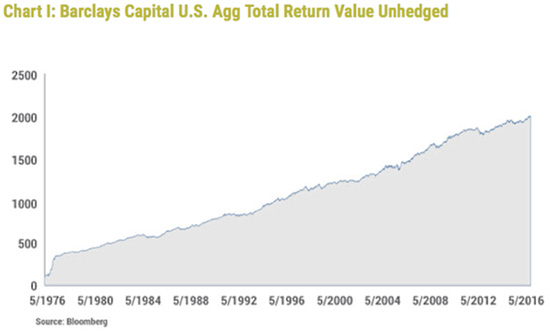
5000, the Savings + Loan crisis in the early 90’s, and so on. Chart 1 proves
the point for bonds. Since the inception of the Barclays Capital U.S. Aggregate
or Lehman Bond index in 1976, investment grade bond markets have provided
conservative investors with a 7.47% compound return with remarkably little
volatility. An observer of the graph would be amazed, as was I, at the steady
climb of wealth, even during significant bear markets when 30-year Treasury
yields reached 15% in the early 80’s and were tagged with the designation of
“certificates of confiscation”. The graph proves otherwise, because as bond
prices were going down, the hig her and higher annual yields smoothed the
damage and even led to positive returns during “headline” bear market periods
such as 1979-84, or more recently the “taper tantrum” of 2013. Quite
remarkable, isn’t it? A Sherlock Holmes sleuth interested in disproving this
thesis would find few 12-month periods of time where the investment grade bond
market produced negative returns.
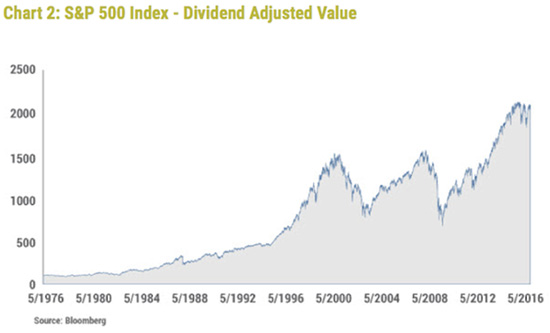
The path of stocks has not been so smooth but the
annual returns (with dividends) have been over 3% higher than investment grade
bonds as Chart 2 shows. That is how it should be: stocks displaying higher
historical volatility but more return.
But my take from these observations is that this
40-year period of time has been quite remarkable – a grey if not black swan
event that cannot be repeated. With interest rates near zero and now
negative in many developed economies, near double digit annual returns for
stocks and 7%+ for bonds approach a 5 or 6 Sigma event, as nerdish market
technocrats might describe it. You have a better chance of observing another
era like the previous 40-year one on the planet Mars than you do here on good
old Earth. The “top dollar rooms in the financial market’s grand hotel” may
still be occupied by attractive relative asset classes, but the room rate is
extremely high and the view from the penthouse is shrouded in fog, which is my
meteorological metaphor for high risk.
Let me borrow some excellent work from another
investment firm that has occupied the upper floors of the market’s grand hotel
for many years now. GMO’s Ben Inker in his first quarter 2016 client letter
makes the point that while it is obvious that a 10-year Treasury at 1.85% held
for 10 years will return pretty close to 1.85%, it is not widely observed that
the rate of return of a dynamic “constant maturity strategy” maintaining a
fixed duration on a Barclays Capital U.S. Aggregate portfolio now yielding
2.17%, will almost assuredly return between 1.5% and 2.9% over the next 10
years, even if yields double or drop to 0% at period’s end. The bond market’s
7.5% 40-year historical return is just that – history. In order to duplicate
that number, yields would have to drop to -17%! Tickets to Mars, anyone?
The case for stocks is more complicated of course
with different possibilities for growth, P/E ratios and potential government
support in the form of “Hail Mary” QE’s now employed in Japan, China, and
elsewhere. Equities though, reside on the same planet Earth and are correlated
significantly to the return on bonds. Add a historical 3% “equity premium” to
GMO’s hypothesis on bonds if you dare, and you get to a range of 4.5% to 5.9%
over the next 10 years, and believe me, those forecasts require a foghorn
warning given current market and economic distortions. Capitalism has
entered a new era in this post-Lehman period due to unimaginable monetary
policies and negative structural transitions that pose risk to growth forecasts
and the historical linear upward slope of productivity.
Here’s my thesis in more compact form: For over 40
years, asset returns and alpha generation from penthouse investment managers
have been materially aided by declines in interest rates, trade globalization,
and an enormous expansion of credit – that is debt. Those trends are coming to
an end if only because in some cases they can go no further. Those historic
returns have been a function of leverage and the capture of “carry”, producing
attractive income and capital gains. A repeat performance is not only unlikely,
it is impossible unless you are a friend of Elon Musk and you’ve got the
gumption to blast off for Mars. Planet Earth does not offer such opportunities.
“Carry” in almost all forms is compressed and
offers more risk than potential return. I will be specific:
- Duration is
unquestionably a risk in negative yielding markets. A minus 25 basis point
yield on a 5-year German Bund produces nothing but losses five years from
now. A 45 basis point yield on a 30-year JGB offers a current “carry” of
only 40 basis points per year for a near 30-year durational risk. That’s a
Sharpe ratio of .015 at best, and if interest rates move up by just 2
basis points, an investor loses her entire annual income. Even 10-year
U.S. Treasuries with a 125 basis point “carry” relative to current money
market rates represent similar durational headwinds. Maturity extension in
order to capture “carry” is hardly worth the risk.
- Similarly, credit risk
or credit “carry” offers little reward relative to potential losses.
Without getting too detailed, the advantage offered by holding a 5-year
investment grade corporate bond over the next 12 months is a mere 25 basis
points. The IG CDX credit curve offers a spread of 75 basis points for a
5-year commitment but its expected return over the next 12 months is only
25 basis points. An investor can only earn more if the forward credit
curve – much like the yield curve – is not realized.
- Volatility. Carry can be
earned by selling volatility in many areas. Any investment longer or less
creditworthy than a 90-day Treasury Bill sells volatility whether a
portfolio manager realizes it or not. Much like the “VIX®”, the
Treasury “Move Index” is at a near historic low, meaning there is little
to be gained by selling outright volatility or other forms in duration and
credit space.
- Liquidity. Spreads for
illiquid investments have tightened to historical lows. Liquidity can be
measured in the Treasury market by spreads between “off the run” and “on
the run” issues – a spread that is nearly nonexistent, meaning there is no
“carry” associated with less liquid Treasury bonds. Similar evidence
exists with corporate CDS compared to their less liquid cash counterparts.
You can observe it as well in the “discounts” to NAV or Net Asset Value in
closed-end funds. They are historically tight, indicating very little
“carry” for assuming a relatively illiquid position.
The “fact of the matter” – to use a politician’s
phrase – is that “carry” in any form appears to be very low relative to risk.
The same thing goes with stocks and real estate or any asset that has a P/E,
cap rate, or is tied to present value by the discounting of future cash flows.
To occupy the investment market’s future “penthouse”, today’s portfolio
managers – as well as their clients, must begin to look in another direction.
Returns will be low, risk will be high and at some point the “Intelligent
Investor” must decide that we are in a new era with conditions that demand a
different approach. Negative durations? Voiding or shorting corporate credit?
Buying instead of selling volatility? Staying liquid with large amounts of
cash? These are all potential “negative” carry positions tha t at some point
may capture capital gains or at a minimum preserve principal. But because
an investor must eat something as the appropriate reversal approaches, the
current penthouse room service menu of positive carry alternatives must still
be carefully scrutinized to avoid starvation. That means accepting some
positive carry assets with the least amount of risk. Sometime soon though, as
inappropriate monetary policies and structural headwinds take their toll, those
delicious “carry rich and greasy” French fries will turn cold and rather
quickly get tossed into the garbage can. Bon Appetit!
******
Just a Game
(Originally published on the Janus Capital website, July 6,
2016)
If only Fed Governors and Presidents understood a
little bit more about Monopoly, and a tad less about outdated historical models
such as the Taylor Rule and the Phillips Curve, then our economy and its future
prospects might be a little better off. That is not to say that Monopoly can
illuminate all of the problems of our current economic stagnation. Brexit and a
growing Populist movement clearly point out that the possibility of
de-globalization (less trade, immigration and economic growth) is playing a
part. And too, structural elements long ago advanced in my New Normal thesis in
2009 have a significant role as well: aging demographics, too much debt, and
technological advances including job-threatening robotization are significantly
responsible for 2% peak U.S. real GDP as opposed to 4-5% only a decade ago. But
all of these elements are but properties on a larger economic landsc ape best
typified by a Monopoly board. In that game, capitalists travel around the board,
buying up properties, paying rent, and importantly passing “Go” and collecting
$200 each and every time. And it’s the $200 of cash (which in the economic
scheme of things represents new “credit”) that is responsible for the ongoing
health of our finance-based economy. Without new credit, economic growth moves
in reverse and individual player “bankruptcies” become more probable.
But let’s start back at the beginning when the bank
hands out cash, and each player begins to roll the dice. The bank – which
critically is not the central bank but the private banking system– hands
out $1,500 to each player. The object is to buy good real estate at a cheap
price and to develop properties with houses and hotels. But the player must
have a cash reserve in case she lands on other properties and pays rent. So at
some point, the process of economic development represented by the building of
houses and hotels slows down. You can’t just keep buying houses if you expect
to pay other players rent. You’ll need cash or “credit”, and you’ve spent much
of your $1,500 buying properties.
To some extent, growth for all the players in
general can continue but at a slower pace – the economy slows down due to a
more levered position for each player but still grows because of the $200 that
each receives as he passes Go. But here’s the rub. In Monopoly, the $200 of
credit creation never changes. It’s always $200. If the rules or the system
allowed for an increase to $400 or say $1,000, then players could keep on
building and the economy keep growing without the possibility of a cash or
credit squeeze. But it doesn’t. The rules which fix the passing “Go” amount at
$200 ensure at some point the breakdown of a player who hasn’t purchased “well”
or reserved enough cash. Bankruptcies begin. The Monopoly game, which at the
start was so exciting as $1,500 and $200 a pass made for asset accumulation and
economic growth, now tur ns sullen and competitive: Dog eat dog with the
survival of many of the players on the board at risk.
All right. So how is this relevant to today’s
finance-based economy? Hasn’t the Fed printed $4 trillion of new money and the
same with the BOJ and ECB? Haven’t they effectively increased the $200 “pass
go” amount by more than enough to keep the game going? Not really. Because
in today’s modern day economy, central banks are really the “community chest”,
not the banker. They have lots and lots of money available but only if the
private system – the economy’s real bankers – decide to use it and expand
“credit”. If banks don’t lend, either because of risk to them or an
unwillingness of corporations and individuals to borrow money, then credit
growth doesn’t increase. The system still generates $200 per player per
round trip roll of the dice, but it’s not enough to keep real GDP at the same
pace and to prevent some companies/households from going bankrupt.
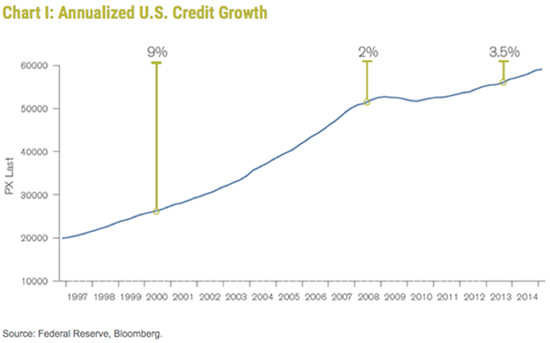
That is what’s happening today and has been
happening for the past few years. As shown in Chart I, credit growth which has
averaged 9% a year since the beginning of this century barely reaches 4%
annualized in most quarters now. And why isn’t that enough? Well the proof’s in
the pudding or the annualized GDP numbers both here and abroad. A highly
levered economic system is dependent on credit creation for its stability and longevity,
and now it is growing sub-optimally. Yes, those structural elements mentioned
previously are part of the explanation. But credit is the oil that lubes the
system, the straw that stirs the drink, and when the private system (not the
central bank) fails to generate sufficient credit growth, then real economic
growth stalls and even goes in reverse.
(To elaborate just slightly, total credit, unlike
standard “money supply” definitions include all credit or debt from households,
businesses, government, and finance-based sources. It now totals a staggering
$62 trillion in contrast to M1/M2 totals which approximate $13 trillion at
best.)
Now many readers may be familiar with the axiomatic
formula of (“M V = PT”), which in plain English means money supply X the
velocity of money = PT or Gross Domestic Product (permit me the simplicity for
sake of brevity). In other words, money supply or “credit” growth is not the
only determinant of GDP but the velocity of that money or credit is important
too. It’s like the grocery store business. Turnover of inventory is critical to
profits and in this case, turnover of credit is critical to GDP and GDP growth.
Without elaboration, because this may be getting a little drawn out, velocity
of credit is enhanced by lower and lower interest rates. Thus, over the past
5-6 years post-Lehman, as the private system has created insufficient credit
growth, the lower and lower interest rates have increased velocity and
therefore increased GDP, although weakly. No w, however with yields at near
zero and negative on $10 trillion of global government credit, the contribution
of velocity to GDP growth is coming to an end and may even be creating negative
growth as I’ve argued for the last several years. Our credit-based financial
system is sputtering, and risk assets are reflecting that reality even if most
players (including central banks) have little clue as to how the game is played.
Ask Janet Yellen for instance what affects the velocity of credit or even
how much credit there is in the system and her hesitant answer may not satisfy
you. They don’t believe in Monopoly as the functional model for the modern day
financial system. They believe in Taylor and Phillips and warn of future
inflation as we approach “full employment”. They worship false idols.
To be fair, the fiscal side of our current system
has been nonexistent. We’re not all dead, but Keynes certainly is. Until
governments can spend money and replace the animal spirits lacking in the
private sector, then the Monopoly board and meager credit growth shrinks as a
future deflationary weapon. But investors should not hope unrealistically for
deficit spending any time soon. To me, that means at best, a ceiling on risk
asset prices (stocks, high yield bonds, private equity, real estate) and at
worst, minus signs at year’s end that force investors to abandon hope for
future returns compared to historic examples. Worry for now about the
return “of” your money, not the return “on” it. Our Monopoly-based economy
requires credit creation and if it stays low, the future losers will grow in
number.
0 comments:
Publicar un comentario