by: VanEck

The gold market moved to the beat of the Federal Reserve's (the "Fed") rate hike signal drumming in May. At the beginning of the month, the probabilities of a rate increase, as implied by the federal funds futures markets1, were 12% for an increase in June and 26% for a July increase. That dropped to 4% for June and 19% for July by May 16. On May 18, the market interpreted the minutes from the Federal Open Market Committee (the "FOMC") April meeting as being more hawkish than anticipated and market expectations of rate increases in June and July jumped to 32% and 47%, respectively. Gold traded down for nine consecutive sessions following the release of the FOMC's minutes. Gold dropped to an intra-day low of $1,199 per ounce on May 30, and ended the month at $1,215 per ounce for a loss of 6.0% or $77.66.
U.S. Economic Data Mixed
The U.S. dollar, which historically has a strong negative correlation2 with the gold price, also reflected the market's assessment of a rate hike this summer, with the U.S. Dollar Index (DXY)3 ending May up 3% for the month. The change in market sentiment regarding upcoming Fed rate decisions was primarily driven by comments from Fed Chair Janet Yellen and other Fed officials.
Meanwhile, U.S. economic data releases continued to be mixed, and, in our view, do not paint a clear picture of the U.S. economy that would favor further tightening in the near term. Positive April economic data included retail sales and existing and new home sales coming in above expectations, and an increase in the ISM Manufacturing Index4 reading for May that was widely expected to be declining. In contrast, employment data and construction spending were below expectations while the University of Michigan Sentiment Index5, Consumer Confidence Index6, and manufacturing activity in Chicago and Dallas for May were all weaker than expected.
Disappointing May Jobs Report the Most Impactful
But the most impactful, in our opinion, economic data was the May jobs report announced by the U.S. Department of Labor on June 3. Reported figures were massively below expectations, showing the lowest number of workers added in six years. While market chatter before the report's release may have suggested the Fed had everyone convinced of a summer hike, a hike was not priced in for June, as evidenced by the 20% implied probability. The chance of a July hike was only at 53.6%. Immediately after the jobs report, those probabilities dropped to 4% and 29% respectively, the DXY Index fell (down 1.7%) and gold rallied (up 2.8% or $33 per ounce), closing at $1,244 per ounce on June 3.
With gold falling in May, gold stocks underperformed. The NYSE Arca Gold Miners Index (GDMNTR)7 fell 11.9%, and the MVIS Global Junior Gold Miners Index (MVGDXJTR)8 dropped 11.5% during the month, trimming gains for the year to 65% and 76% respectively, as of May 31, compared to gold's gain of 14.5%.
Gold ETPs Have Increased 27% in 2016
Of note, the amount of gold held by global gold bullion exchange traded products (ETPs) increased by an additional 4.8% during the month of May. Holdings of global gold ETPs have increased almost 27% this year to an estimated 59.5 million ounces of gold, still well below the 2012 peak of more than 84 million ounces.
We have been of the opinion that the Fed may not be as aggressive as previously guided, and that rising rates in 2016 could be a significant impediment to the U.S. economy. The June 3 jobs report missed expectations by a wide margin. In May, the U.S. added just 38,000 workers, compared to the median of 160,000 as forecasted by Bloomberg. Job gains for prior months were downgraded as well. This indicates a weakening labor market and reduces the odds of Fed rate increases in the coming months.
Gold Entering Early Stages of a New Bull Market
We believe this is another important inflection point for gold that suggests the early stages of a new bull market. The gold price has been consolidating in the $1,200 to $1,300 per ounce range since early March, hitting a low of nearly $1,200 per ounce on May 30. It now appears as if gold is poised to remain above the technically and psychologically important $1,200 per ounce level.
While it is not uncommon for the gold price to struggle in the summer months, we believe gold is forming a new base. We expect to see higher gold prices as the year progresses.
Gold Price Monthly Return Average, 1971-2015 and 2016
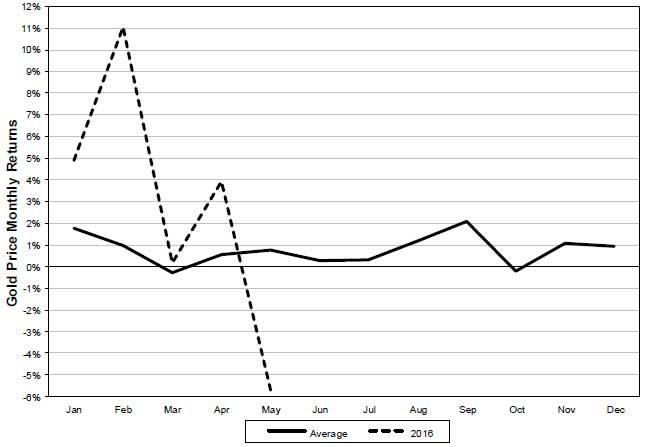 Source: Bloomberg, Scotiabank GBM
Gold Companies Transitioning with Higher Cash Flows
We met the management of approximately 20 gold companies during the month, which allowed us to get a good sense of what's happening in the sector. The main takeaway is that while companies are still focused on efficiencies, cost savings, and operating improvements to help maximize cash flow, higher gold prices this year have shaped the conversation around what to do with these new cash levels.
For some companies, paying down debt still remains a priority. For firms currently building new mines, the higher cash flows provide a welcome cushion and remove market concerns over financing. Many companies also expect dividends to resume and/or increase as free cash flow grows. But for most companies, higher cash flows, at a time when balance sheets are in good shape and costs are under control, will likely bring back the opportunity to add future growth.
Companies Shifting Focus Toward Growth and Profitability
Valuations are still relatively low, so there is opportunity to buy assets. Exploration spending, which had been significantly reduced over the last couple of years, should also pick up again, allowing companies to add resources and reserves and increasing their chances of making new discoveries.
Projects that have been shelved will be revisited as financing becomes available. We met with management teams that, despite the higher gold price and increased cash flows that come with it, remain firmly committed to growing profitability and returns rather than production. We heard more than once in our discussions that a new ounce of production is only good and will only be added if it improves or maintains the existing per ounce profitability of the company. Companies are measuring growth in free cash flow per share, for example, rather than production volumes.
This is very encouraging to us. Company initiatives have slowly and cautiously started to shift from mere survival to thriving. "Caution" is the key word here. As they embark on what may be the next gold bull market, we believe gold companies need to continue to demonstrate a rigorous capital allocation strategy that focuses on value creation for shareholders and positions the gold mining equity sector in the investable universe of the broader market.
IMPORTANT DISCLOSURE
1 In the U.S., the federal funds rate is "the interest rate" at which depository institutions actively trade balances held at the Federal Reserve, called federal funds, with each other, usually overnight, on an uncollateralized basis. Institutions with surplus balances in their accounts lend those balances to institutions in need of larger balances.
2 The correlation coefficient is a measure that determines the degree to which two variables' movements are associated and will vary from -1.0 to 1.0. -1.0 indicates perfect negative correlation, and 1.0 indicates perfect positive correlation.
3 U.S. Dollar Index (DXY) indicates the general international value of the U.S. dollar. The DXY does this by averaging the exchange rates between the U.S. dollar and six major world currencies: Euro, Japanese yen, Pound sterling, Canadian dollar, Swedish kroner, and Swiss franc.
4 The ISM Manufacturing Index is an index based on surveys of more than 300 manufacturing firms by the Institute of Supply Management. The ISM Manufacturing Index monitors employment, production inventories, new orders and supplier deliveries.
5 A survey of consumer confidence conducted by the University of Michigan. The Michigan Consumer Sentiment Index (MCSI) uses telephone surveys to gather information on consumer expectations regarding the overall economy.
6 The U.S. consumer confidence index (CCI) is an indicator designed to measure consumer confidence, which is defined as the degree of optimism on the state of the economy that consumers are expressing through their activities of savings and spending.
7 NYSE Arca Gold Miners Index (GDMNTR) is a modified market capitalization-weighted index comprised of publicly traded companies involved primarily in the mining for gold.
8 MVIS Global Junior Gold Miners Index (MVGDXJTR) is a rules-based, modified market capitalization-weighted, float-adjusted index comprised of a global universe of publicly traded small- and medium-capitalization companies that generate at least 50% of their revenues from gold and/or silver mining, hold real property that has the potential to produce at least 50% of the company's revenue from gold or silver mining when developed, or primarily invest in gold or silver.
This content is published in the United States for residents of specified countries. Investors are subject to securities and tax regulations within their applicable jurisdictions that are not addressed on this content. Nothing in this content should be considered a solicitation to buy or an offer to sell shares of any investment in any jurisdiction where the offer or solicitation would be unlawful under the securities laws of such jurisdiction, nor is it intended as investment, tax, financial, or legal advice.
Investors should seek such professional advice for their particular situation and jurisdiction.
0 comments:
Publicar un comentario