Delta
Force
By John Mauldin
Today
we are going to explore how demographic change impacts growth. (We will use
lots of charts and graphs, but the text of the letter is actually shorter than
usual. The whole picture is worth 1000 words thing.)
Every
politician and economist wants to see the United States – and, I should point
out, Europe, Japan, and the rest of the world – return to 3%-plus growth. Given
that GDP in the first quarter turned out to be just 0.6% and that growth has
sputtered along at less than 1% for the last six months, even the 2% growth
that we’ve been averaging for the last five years sounds good now. In my
just-concluded series, a letter to the next president on the economic situation
he or she will face, I laid out my own plan to reinvigorate growth. But I have
to admit that plan does face a strong headwind called fundamental economic
reality.
Growth
in GDP has only two basic components: growth in productivity and growth in the
size of the workforce.
That’s
it: there are two and only two ways you can grow an economy. You can
either increase the (working-age) population or increase productivity. There is
no magic fairy dust you can sprinkle on an economy to make it grow. To increase
GDP you have to actually produce
more. That's why it's called gross domestic product.
The
Greek letter delta (Δ) is the symbol for change. So the change in GDP is
written as
That
is, the change in GDP is equal to the change in the working-age population plus
the change in productivity. Therefore – and I'm oversimplifying quite a lot
here – a recession is basically a decrease in production (as, normally,
population doesn't decrease).
Two
clear implications emerge: The first is that if you want the economy to grow,
there must be
an economic environment that is friendly to increasing productivity.
I
really want to focus on demographics and the effects that change in the
working-age population will have on the growth of the economy, but let me
quickly offer a few rather disconcerting graphs on the continuing decline in
productivity in the US. I should note that this situation is mirrored across
the developed world.
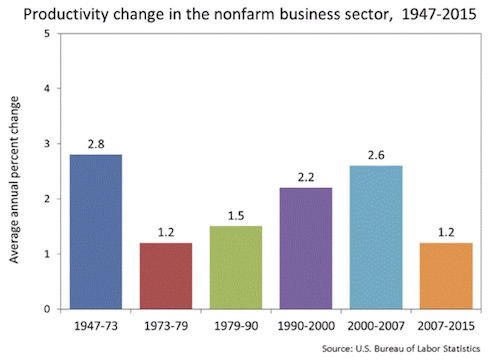
Productivity
grew 0.6 percent in 2015, the smallest increase since 2013. Productivity
increased at an annual rate of less than 1.0 percent in each of the last five
years. The average annual rate of productivity growth from 2007 to 2015 was 1.2
percent, well below the long-term rate of 2.1 percent from 1947 to 2015.
Economists
blame this decade’s reduced productivity on a lack of investment, which they
say has led to an unprecedented decline in capital intensity. That is why those
same economists want to keep interest rates low so that, in theory, businesses
will be inclined to invest. However, there are those of us who believe that the
artificially low rates put in place by central bank monetary policy actually cause reduced investment,
and here’s why. Rather than encouraging businesses to compete by investing in
productive assets and trying to take market share, excessive central bank
stimulus encourages businesses to buy their competition and consolidate – which
typically results in a reduction in the labor force. When the Federal Reserve
makes it cheaper to buy your competition than to compete and cheaper to buy
back your shares than to invest in new productivity, is it any wonder that
productivity drops?
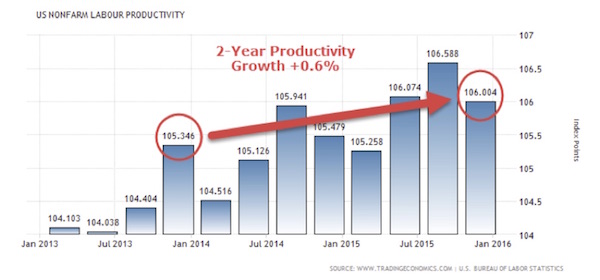
Look
again at the chart above. Notice that in the high-inflation years of the ’70s
productivity fell to roughly the level where it is today. In this next chart we
see that actual productivity has grown less than 0.6% in the last two years.
Toward the end of the letter we’ll come back and apply these productivity
numbers to our equation above. As you might expect, this exercise will not make
for pleasant Reading.
The
numbers suggest that productivity growth has become hard to achieve in the
developed world. Mustering growth is harder in emerging markets, too, due
simply to their own success. China moved millions of people from hardscrabble
farming to factory floors in a relatively short period. Of course their
productivity rose. So did productivity back on the farms, thanks to new
machinery. Those easy gains having been booked – further productivity growth
will be more elusive.
Part
of the problem for the developed world is that much of its economy is now in
the services sector. It is much harder to get increases in productivity in dry
cleaners, restaurants, and hairdressers than it is in manufacturing or in
agriculture. While there is continual growth and improving productivity in the
services sector, that sector alone cannot deliver significant increases in the
overall productivity rate.
And
now back to population and employment, our main focus.
To
varying degrees, the nations of the developed world are getting older. This is
happening for two basic reasons:
- Improved
nutrition and healthcare enable people to live longer.
- Fertility
rates are falling toward replacement rate or even lower.
No
trend persists forever, but the older-world trend is likely to continue unless
something happens to reduce average lifespans and/or produce more babies.
Developed-world
aging produces all kinds of economic consequences, in particular for the labor
market. The total number of humans in a given place may be relatively constant
or even rise, while the number of workers who can actually contribute to that
place’s economy falls.
Child
labor laws and customs vary. In the United States, the labor force
theoretically consists of all those age 16 and over who are either working or
actively seeking work. Retirement is fuzzier because people can retire around
age 65, but many keep working either voluntarily or out of necessity.
As we
saw last week, demographers use a statistic called the “dependency ratio,”
which is the ratio of workers to the entire population. The lower the
percentage of workers, the bigger each worker’s responsibility becomes for
providing support to young and old dependents, either directly or through
taxes.
To
illustrate, here is a chart from Eurostat on the projections for the EU
population from 2014 to 2080.
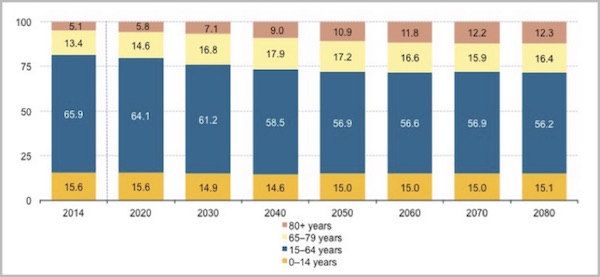
We see
that in 2014, 65.9% of the EU was aged 15–64, or what we might call “prime
working age.” The number shrinks steadily to around 56% by 2050 and then levels
out. Why does it level out? Basically, because the forecasters assume that
birthrates won’t drop much lower and that there is a limit on how long people
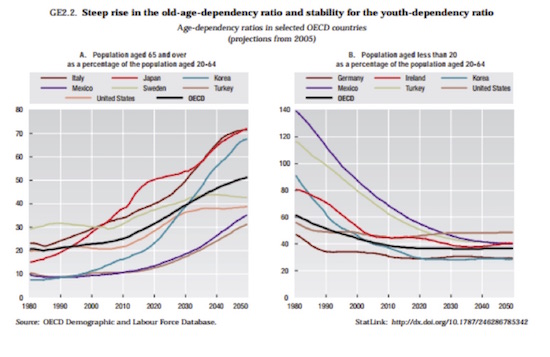
will live. But in this next chart you can see the steep rise in the percentage
of the elderly compared to those of working age, all over the developed world.
The
number of children (ages 0–20) changes only slightly in the decades to come.
The big change occurs in the top two segments on the previous chart, those aged
65–79 and 80+. Combined, they will grow from 18.5% of the population in 2014 to
28.7% in 2080.
These
figures involve assumptions that could change. A top issue for Europe is how
many immigrants it will accept and how fecund the immigrants will be compared
to the current population.
Presuming,
for the sake of argument, that ages 15–65 encompasses most workers, in 2014 the
EU had 66% of its population working to support the 34% who were not working
because they were either too young or too old. By 2040, less than 25 years from
now, the EU is projected to have 58.5% working to support 41.5% who are
dependents. About two-thirds of the dependents will be those age 65 and over.
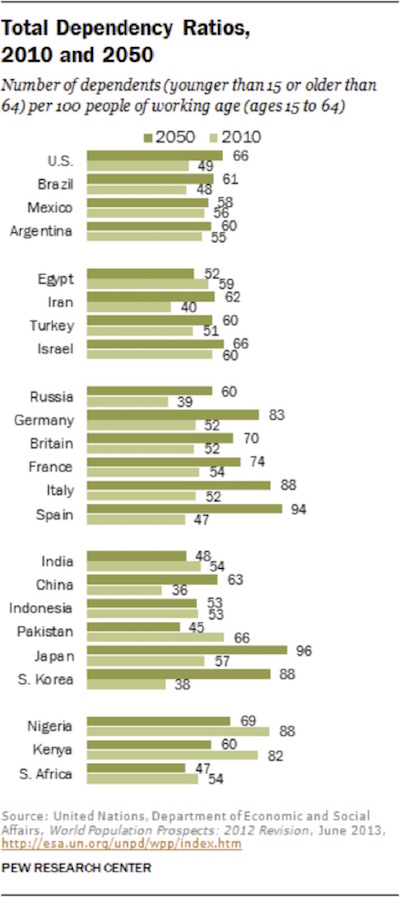
This
next chart, from the Pew Research Center (based on UN data), gives us a view on
how things will change between now and 2050 in a number of countries around the
world. Note that Italy, Germany, and especially Spain will have significant
problems with their dependency ratio within 30 years. Only Japan will have a
higher dependency ratio than these three. Everyone talks about the aging of
Japan, but Spain is not a great deal different; and after Spain’s last
recession, so many young people left the country that the statistics are probably
worse than what we are seeing in the data.
Can We Have a Little Economic
Participation, Please?
Now,
you might say that working-age people don’t really support the retirees. This
assertion is true to the extent that retirees support themselves from savings.
It is not true for retirees whose pensions depend on tax revenue and economic
growth.
The
number of people aged 15 to 65 doesn’t really equal the number of workers. We
measure the number of actual workers by something called the participation
rate. And because data for the participation rate is so robust in the United
States, I’m going to focus on the US.
In the
US, population growth has slowed, and productivity has fallen; that’s why we
haven’t been able to boost real GDP growth to the levels seen in previous
recoveries. The slow GDP growth we’ve seen in this recovery is precisely due to
a much lower annual increase in employment.
What
about the potential for future growth? If the “natural” unemployment rate is a
little over 4% and the official unemployment rate is sitting at just about 5%,
doesn’t that suggest there aren’t many more productive workers who can be added
into the GDP growth mix? Actually, that is not the case. It’s really all about
the participation rate.
The
participation rate is a measure of the active portion of an economy's labor
force. It is defined as the number of people who are either employed or
actively looking for work. People who are no longer searching for work are not
included in the participation rate. During a recession, many workers get
discouraged and stop looking for jobs; as a result, the participation rate
falls.
Now
let’s look at some charts from the FRED
database of the St. Louis Fed. For those not familiar with it, FRED is one of
the finest databases of all things economic in the world. I am constantly
amazed at the breadth and depth and range of data that you can find for free in
FRED. I’m not sure just how the St. Louis Fed came to be the main repository of
historical economic data, but I am grateful.
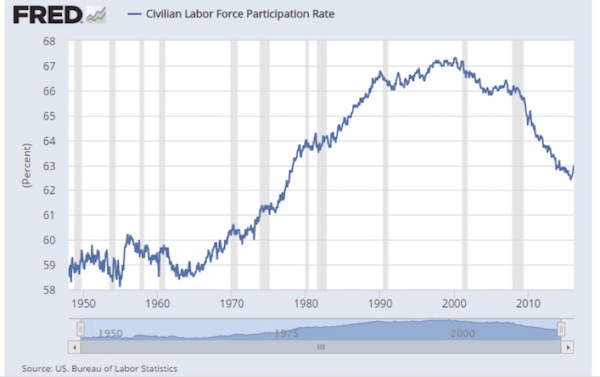
Let’s
look first at the actual Civilian Labor Force Participation Rate for the United
States. This rate has been falling since 2000. A big part of the dropoff
reflects Boomers retiring, but since the Great Recession a significantly
steeper decline has resulted as many people failed to find jobs, went back to
school, or became discouraged and stopped looking for work. In theory, that
means there are now a lot of people on the sidelines who are not counted as
unemployed but who could be available if job opportunities materialized. So if
the economy started to grow faster and those currently sidelined people once
again found jobs, the number of workers would increase, and GDP would get an
additional boost.
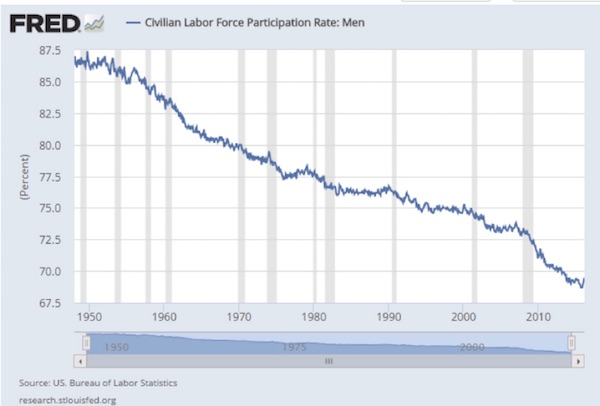
This
next chart shows the participation rate for just men. It might seem a little
strange that the participation rate for men has been dropping since 1950.
Again, part of that falloff is the ever-growing number of retirees, but other
factors are in play as well.
Even with population growth, a declining
participation rate this significant should have dramatically reduced GDP growth
since 1950. But GDP growth between 1950 and 2000 was pretty robust, so what
happened?
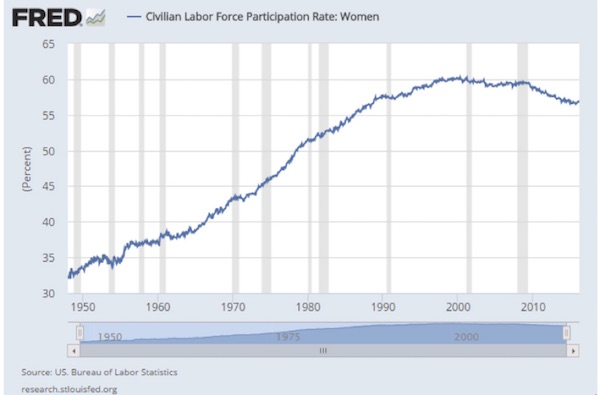
Well,
this next chart happened. Women – half the population – doubled their
participation rate from 1950 to 2000. In fact, they contributed 100% of the
actual overall increase in the participation rate. Without their coming into
the workforce, the United States would have fallen into a state of decline.
However, since 2000 we have seen the participation rate of women go flat and
then begin to fall after the Great Recession. Again, part of this dropoff is
due to retirement, but there are other factors as well.
(Side
note: Countries that don’t allow their women to participate in the economy to
any significant extent are clearly inhibiting their nations’ growth. These
countries usually lag the developed world in economic status, and their
situation is only going to get worse until they adjust their social parameters.
Just saying…)
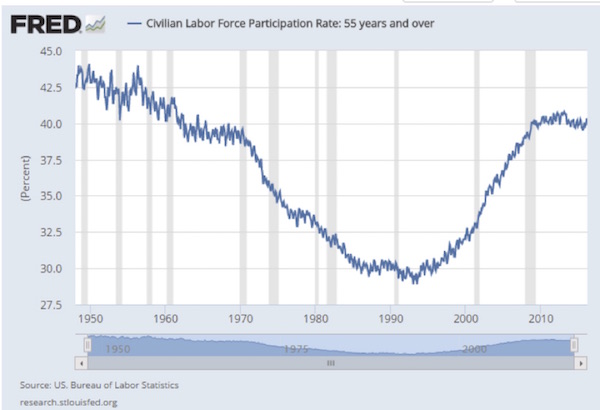
Want
to see the effect of retirement on the participation rate? Let’s look at the
participation rate of people 55 and older. What we see is that it dropped from
1950 through the early 1990s but has risen since rather dramatically. As we saw
last week, most people 65 and over who continue in the workforce are doing so
not for economic reasons but because they simply don’t want to quit. This is a
new social phenomenon all around the developed world. It is not just that
lifespans are getting longer; healthspans are improving as well. Older people
want to work longer, be a productive part of society, and contribute to the
growth of the economy. That is a good thing.
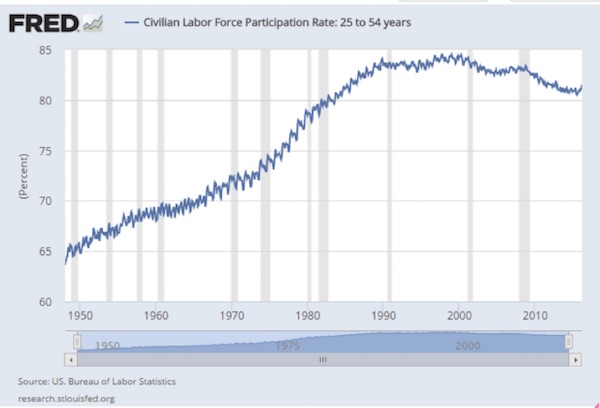
But
there is another odd phenomenon going on. We are actually seeing a decline in
the participation rate of 25 to 54 year-olds, people of prime working age. The
labor participation rate for this group had risen continually for 50 years.
There’s something going on here besides “retirement.”
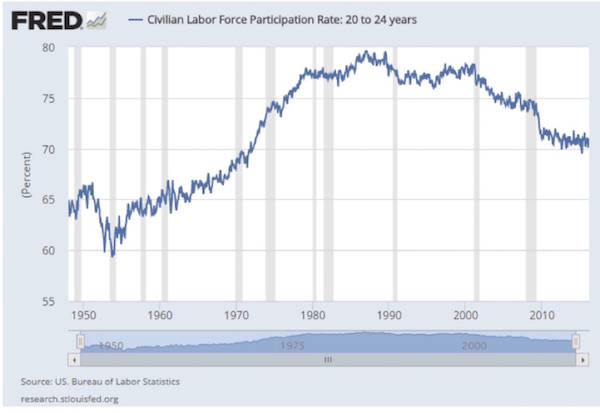
And
now we delve into an even stranger phenomenon. Young people, 20 to 24, are
increasingly opting out of the workforce. And this is not just a recent
phenomenon. It has been happening since 2000, but the trend has dramatically
accelerated in the wake of the Great Recession. Research tells us that a lot of
those people are still going to school. But there are other things happening
here, and we need to try to understand them.
The
next two charts are interesting. The first originates from the Atlanta Fed and
shows the reasons why different age groups are not participating in the labor
force.
What I find interesting is the number of disabled people at younger
ages. In the 46–50-year-old cohort, we see that 10–15% are classified as
disabled. The number of people getting disability benefits has skyrocketed over
the past 15 years, and especially since the Great Recession, although growth in
the number on disability has flatlined in the last few years as applications
have fallen off with the improvement in the economy.
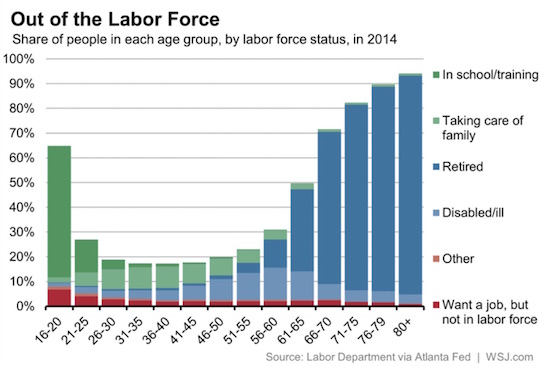
Notice,
too, the large numbers of people in younger cohorts who are out of the labor
force because they are taking care of family. And while most of these
individual situations are probably very necessary, they do have an effect on
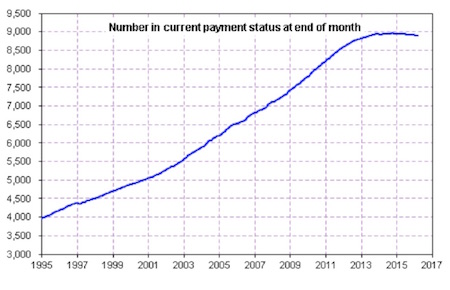
overall economic growth.
The
following chart from the Social Security Administration shows the actual
numbers of people with disability insurance claims. But what the chart really
tells us is that these 9 million people are not available for the workforce.
And while they all have their personal reasons for being on disability, their
low incomes and basic lack of productivity do not contribute to the growth of
the economy.
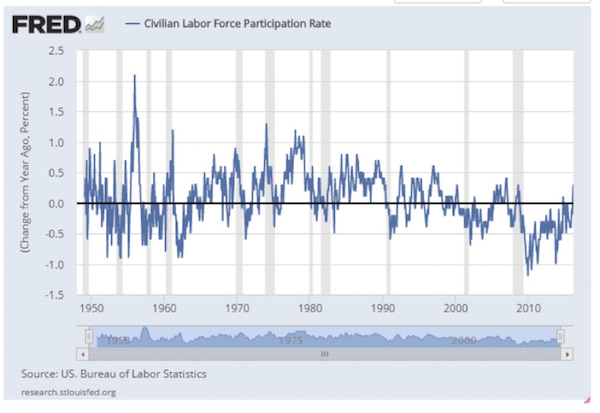
One
last chart, and then we’ll try to wrap up. This one shows the percentage change
in the labor force participation rate year-over-year. What we see is that the
rate has generally declined since the late ’70s, except for a few years of very
modest growth within the last 16 years. Returning to our basic equation, if the
number of people working is not increasing, then (notwithstanding overall
growth of the population) it is very difficult to eke out positive GDP numbers.
The
trends we have looked at are not likely to change much, which means we are
facing a long period of restrained GDP growth throughout the developed world.
This
demographic cast iron lid on growth helps explain why the Federal Reserve, ECB,
and other central banks seem so powerless. Can they create more workers? Not
really. They can make a few adjustments that help a little – confident
consumers are more likely to have children, but it takes time to grow the
children into workers.
What
Fed policy is clearly not
doing is to encourage businesses to invest in growth.
Business loan
availability is still a problem in many sectors. Increasingly, businesses that
can borrow do so not in order to build new facilities but rather to buy back
their own stock or to pay dividends. The numbers of mergers and acquisitions,
and their value, has been rising since the advent of super-low interest rates.
It is cheaper to buy your competitor than to compete. Buyouts help shareholders
but not workers, as they typically entail a consolidation of company workforces
and a reduction in the number of “duplicated” workers. While this culling may
be good for the individual businesses, it is not so good for the overall economy.
It circumvents Joseph Schumpeter’s law of creative destruction.
In
summary, unless something happens to boost worker productivity dramatically,
we’re facing lower world GDP growth for a very long time. Could we act to
change that? Yes, but as I look at the political scene today, I wonder where
the impetus for change is going to come from, absent a serious crisis. And when
we’re embroiled in a crisis, we’re already in a hole, trying to dig out, which
means we have even further to go to achieve robust growth – assuming we can
even do the right things in a crisis. Given what we did in the last crisis, it
is not clear that we still have that capacity.
For
investors, this is reality: developed-world economies are going to grow slower.
And companies, whose revenue is essentially a function of the growth of the
overall economy, are going to grow slower, too, in general.
This
week I will speak in Dallas for the seventh annual Inside
Retirement conference, May 5–6. They have a great lineup of speakers,
but I am most excited about getting to hear and maybe even talk with my
personal writing hero, Peggy Noonan.
Then
on May 10 I fly down to Houston to speak at the S&P
Dow Jones Art of Indexing conference. The conference is for financial
advisors and brokers who are trying to understand how to manage risk while
maximizing returns in the current environment.
I will
be in Abu Dhabi the third week of May and then come home and almost immediately
go to Raleigh, North Carolina, to speak at the Investment
Institute’s Spring 2016 Event. I’m looking forward to hearing John Burbank
and Mark Yusko (who will also be at my own conference the same week) and then
to being on a panel with them.
Afterward,
I make a mad dash for the airport, arrive back in the Dallas late Monday night,
and make final preparations for my Strategic Investment Conference, where
upwards of 700 of my closest friends will gather to discuss all things
macroeconomic and geopolitical. It is going to be a great week! If you won’t be
going to the conference, you can have the next best thing: recordings of the
speakers, delivered just a few days after SIC 2016 ends. You can order
your set here. I should note the price will go up after the conference. A
lot. So just jump on this offer now.
And
since I’m promoting Mauldin Economics, you will shortly see (if you haven’t
already) a promotion for a new investment newsletter service called the Macro Growth and Income Alert.
Patrick Watson, Mauldin Economics Senior Economic Analyst, will coauthor the
new letter, along with Senior Equity Analyst Robert Ross.
I
first hired Patrick in the late ’80s to help me write. He had left the military
and had just graduated from grad school at Rice University (which, I must
confess, moved his résumé to the top of the list), but what made me take on a
budding young writer was the solid portfolio of excellent writing on a variety
of topics that he sent me. Not quite sure how long we worked together that time
around, but maybe 10 years? He eventually moved to Austin, where he went to
work for my partner and then moved on to several other publishing companies. We
stayed in close touch and compared notes over the years, and a few years ago I
finally persuaded him to come back to work for me.
Patrick
has read everything I have written for the last 25 years (and has edited a lot
of it), and he feeds me a continuous stream of research. As a result, we long
ago became thinking and working partners whose ideas and styles are completely
in tune.
I had
to persuade my Mauldin Economics partners to pony up to afford Patrick, but I
promised I would make up the difference if they didn’t think he was worth it.
They now wish they could figure out how to clone him a few times. I do, too.
I
think Patrick and Robert’s Macro
Growth and Income Alert is going to be very successful and
their readers very satisfied. As usual with a new service, we are deeply
discounting the initial price, so rather than waiting to subscribe, you might
want to try it out. There is a 90-day guarantee for a full and courteous
refund, so that you can enjoy a risk-free trial. You can learn more right
here. You may also want to follow Patrick’s always-entertaining Twitter
feed @PatrickW.
I am
going to hit the send button now without adding further personal comments, as I
have a few things begging to be done. And it is turning into a beautiful day
that I want to enjoy here in Dallas. I hope your day is just as fine, and do
have a great week!
Your
planning to participate in the labor market a long time analyst,
John Mauldin
0 comments:
Publicar un comentario