by: Equity Management Academy

Summary
- Gold appears to be sitting around $1,500, testing the floor of the past few weeks of $1,490.
- The Fed appears to be doing potentially more than what they did in 2008 in terms of adding liquidity to the market.
- We could be at $1,550 gold very soon.
- We are in the middle of a breakout, putting $1,515 in the picture as a weekly target.
- The Fed appears to be doing potentially more than what they did in 2008 in terms of adding liquidity to the market.
- We could be at $1,550 gold very soon.
- We are in the middle of a breakout, putting $1,515 in the picture as a weekly target.
The markets appear to have entered a state of limbo, in particular, the E-mini S&P around 3000.
The market appears to be trying to build some consolidation.
Gold appears to be sitting around $1,500, testing the floor of the past few weeks of $1,490.
The gold market is beginning to anticipate that something is not right with the banks.
Alarms are going off.
The Fed appears to be doing potentially more than what they did in 2008 in terms of adding liquidity to the market.
The metals appear to have begun to anticipate.
The markets always move ahead of the fundamentals.
We could be at $1,550 gold very soon.
Gold on the daily is extremely overbought, and on the weekly, gold is entering an area of distribution supply.
We have been trading the extremes.
The E-mini is in a range of 2,880 to about 3,000, with gold between $1,464 and about $1,500.
The Variable Changing Price Momentum Indicator (VC PMI) automated algorithm is screaming BUY!
We are in the middle of a breakout, putting $1,515 in the picture as a weekly target.
If it breaks above that level, gold could test new highs relatively fast.
If that happens, then something serious is happening fundamentally with the Feds.
At their next meeting, the key question is how much are they going to lower rates?
The market is already factoring in a quarter-point.
A half-point would not surprise me.
I think we are going to see zero interest rates in the United States in the near future.
Such a change may create an opportunity for main street, to borrow and buy homes and other assets.
The Fed may be trying to create a new level of refinancing.
The Fed: Lower Rates or QE?
It is increasing the temporary overnight repo operation to $120 billion a day from $75 billion.
Term repo operations are increasing from $35 billion to $45 billion. This is billions of dollars; not nickels and dimes.
They say the goal is to keep the markets operating and to keep interest rates in the desired range.
The announcement came a day after the Fed injected $100 billion into the system, so they are getting desperate.
As a trader, this is confirmation that the Central Bank's balance sheet is going to expand exponentially, which will push interest rates lower and is extremely bullish for commodities, and gold and silver in particular.
Metals
Metals
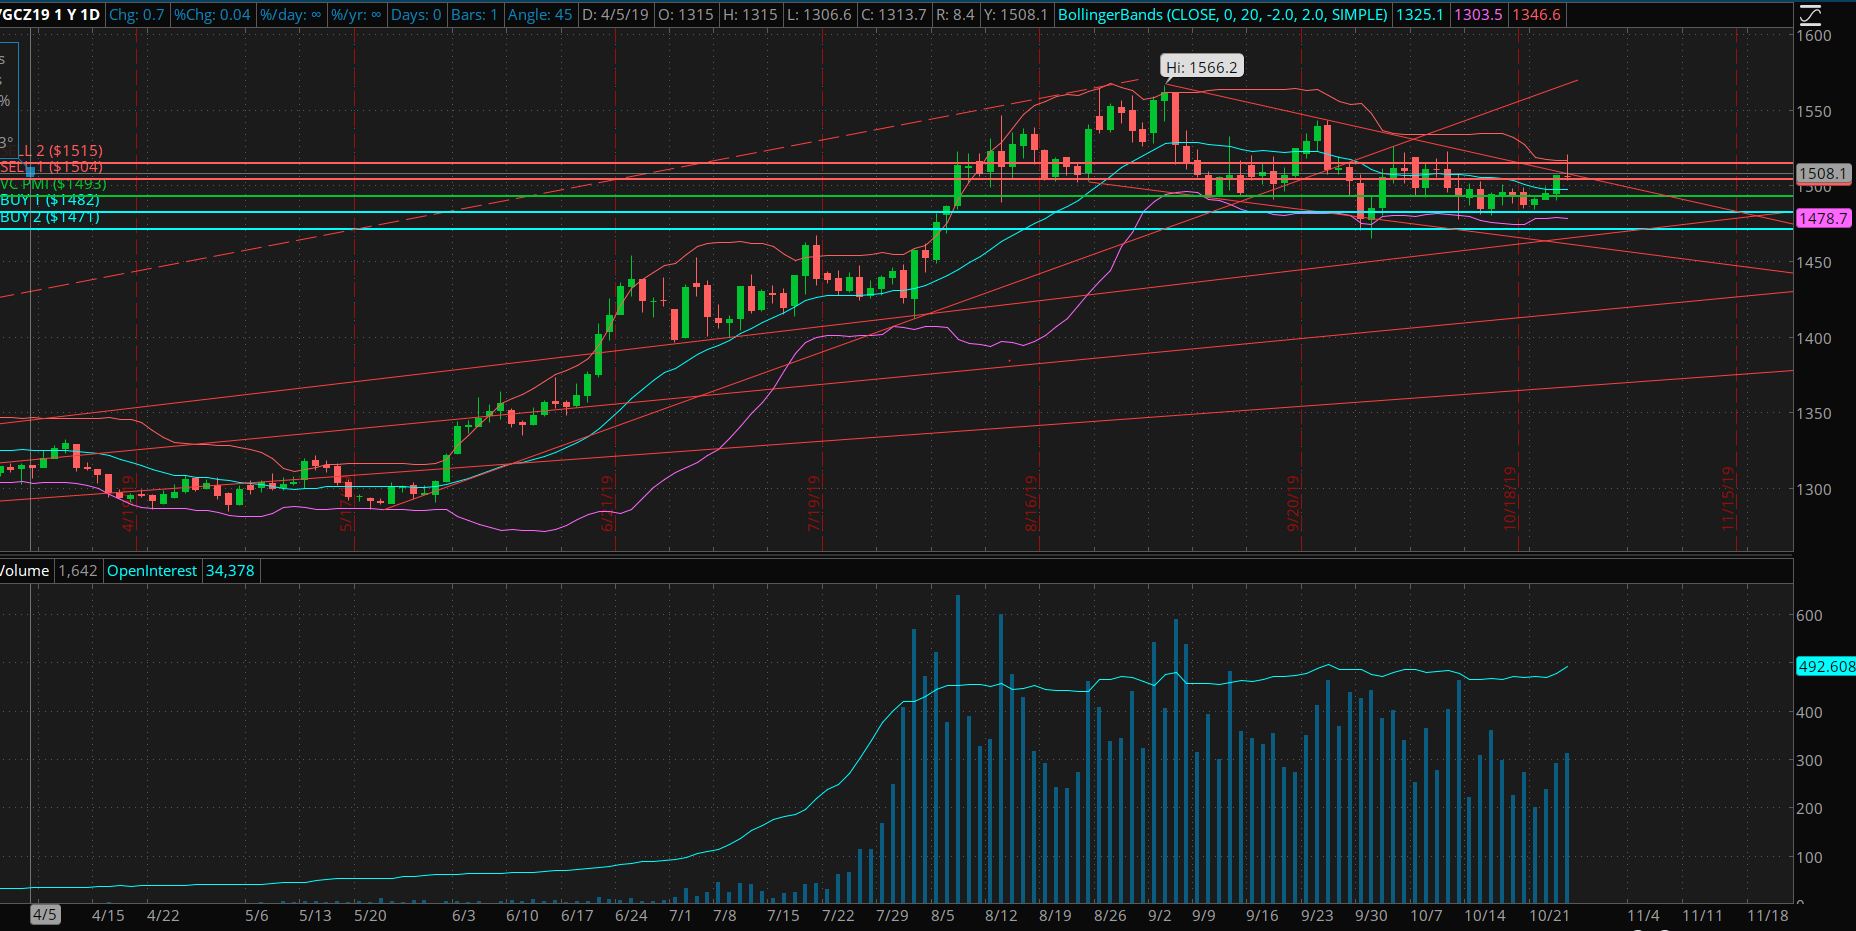
Looking at the daily and weekly charts, the average price for gold for the past few weeks is $1,493.
After making a low on October 1 and testing $1,471, gold reverted right back to the extreme above the mean. This is a perfect example of the reversion to the mean.
As of October 3, we got up to $1,524, came back down again to the mean, reverted back up again to test the distribution area, and reverted back down to the mean, below the extreme of $1,493.
Blue identifies the area with 90% to 95% probability where you want to start to accumulate long positions.
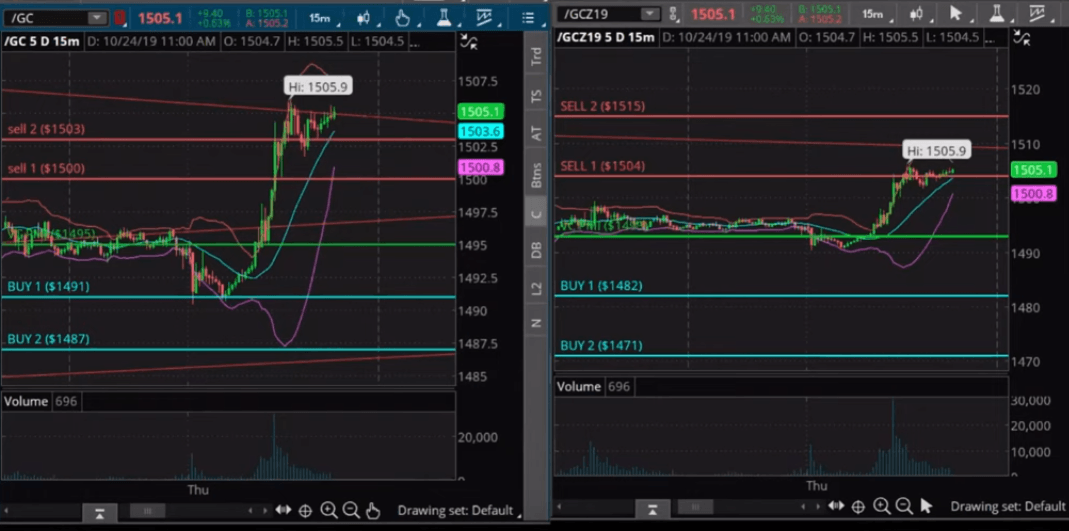
We use the 15-minute bar to execute trades. On the 21st, the market came down to test $1,495 in gold.
It has been trading around the average price until today, when the market exploded, activating a bullish trend momentum at 4:45 am on a close above $1,493.40 (October 24).
The VC PMI recommended putting a stop at $1,493, automatically activating the Sell 1 (S1) level of $1,504, which was accomplished.
This has reverted the market back into the weekly distribution range of supply for December gold.
Daily Gold Data
Daily gold is trading around the average price of $1,495, which has been the area where the market has been chopping around. I don't trade around the mean.
Wait for the market to come down to the extremes above or below the mean.
Gold came down to test, by touching it, making a low of $1,490.50, and then closing at $1,492.90 on the 15-minute bar, activating a buy signal.
Then, it made a high of $1,494.50 and came back down, closing below $1,491, which you can use as a stop on a closing basis. I use three levels of stops.
Depending on your appetite for risk, conservative traders can put a stop on a close below the Buy 1 (B1) level of $1,491. More aggressive traders can have a dollar maximum stop based on your personal choice per contract.
Gold activated a B1 level signal at $1,491 at 2:45 am with a target of $1,495 and a stop at $1,491. A $4,00 per oz profit. The trade was completed by 5 am. The market closed above the average price at $1,496.80 at 5:30 am.
It activated the bullish trend momentum, automatically activating the level above, if it is a buy or a bullish trend momentum. The Sell 1 (S1) and Sell 2 (S2) levels were automatically activated. The market completed those targets.
Gold went above the S2 of $1,503 for a $12,00 per oz profit, trading last at $1,506.30 with a high of $1,506.80. The market is breaking out from the S2 level or resistance level of $1,503.
Once this resistance is broken and it closes above $1,503, this resistance will become support for tomorrow's trading.
Confirmations
We can see a down flag on the chart. You can see the downtrend or support level of the down flag.
The market came down to that level and then reverted back up to the extreme above that level.
Gold has been trading in that range until today when gold broke out.
It is a significant day since gold is validating the VC PMI's structure and Fibonacci trend lines.
When we add the bullish news discussed above in relation to the Fed, which is starting Quantitative Easing under a new name, this is significant.
The implications could be a lot worse than we saw in 2008.
If we continue to see a decline in the US dollar, it could ignite hyperinflation fears in the United States.
The same things are happening in Europe, Asia, and Latin America: huge debt, falling interest rates, and the threat of a race to the bottom.
The fabric of the economy in Ecuador, Chile, and elsewhere is falling apart.
Ecuador economy has been dollarized and is now falling apart.
There is out of control debt worldwide.
We are headed to a major currency war or competition in terms of who is going to bring their currency down to zero the fastest to refinance their debt.
Mexico had a similar experience in 1981.
The Mexican government could not repay their debt, so they devalued their currency to wipe out their debt.
It happens commonly in Third World countries facing huge debt, which is why the IMF has tried to play such a large role in some countries.
The Mexican government could not repay their debt, so they devalued their currency to wipe out their debt.
It happens commonly in Third World countries facing huge debt, which is why the IMF has tried to play such a large role in some countries.
Unfortunately, it is only getting worse, with social unrest in Chile, Ecuador, Venezuela, and elsewhere.
Remember that gold and silver are commodities, which are an investment and also can be used in science and industry.
It may be the time to take a look at gold and silver as a currency.
I strongly suggest looking into adding maybe 25% of precious metals or stocks in your portfolio to protect you against this potentially inflationary cycle we may be heading into.
I am not trying to be alarmist.
I am a capitalist and a trader, and I am just trying to take advantage financially of a situation and share this information with my viewers.
It is one of the best opportunities in many, many years.
0 comments:
Publicar un comentario