A Valuation Conversation
By John Mauldin

You may have noticed the stock market rising lately.
Much of the gain isn’t so much “the market” as a handful of mega-cap stocks.
Nonetheless, the bulls are clearly in charge.
The question is how long they will stay there.
History suggests longer than many market bears think.
I expect another bear market at some point.
But the timing?
My personal history suggests I’m not a very reliable market timer.
We will know
when it gets here.
(By the way, I am not predicting a bear market. I am making an
observation.)
In theory, a stock price represents the discounted current value of its estimated future earnings.
You buy because you want a share of its
future profits (as either dividends or a higher share price) and today’s price
offers that opportunity.
But that’s theory.
In reality, many people buy simply because they think the share price will keep rising as other people buy.
It’s a kind of “greater fool” method that can actually work.
(Market timers and technicians argue they have ways to measure this.
And some succeed, at least for a time.)
As with other assets, low interest rates magnify the profit opportunity.
Cheap financing helps, whether you’re buying a home or a stock.
Conversely, high interest rates reduce the potential gains.
But the market is also forward looking.
It responds not just to current interest rates but also to where it thinks rates are going.
On that basis, the last six months or so make sense.
Rates seemed to have peaked.
Analysts began projecting rate cuts.
The already strong bull market accelerated further.
But rates aren’t the only factor here.
Profits—or expectations
thereof—accelerated as well, making buyers more willing to pay higher share
prices.
The deeper question is whether today’s prices are right compared to what the future will actually bring.
That’s our topic this week.
First,
however, let me mention registration is open for next month’s Strategic Investment Conference.
This is a special Strategic Investment Conference.
It is the 20th such conference I have done.
I can confidently say that this year's faculty is the collective best we have ever had.
With all the uncertainty in the world, in so many realms, the insights you get will be invaluable.
You will be reading more over the next month about who is speaking and why you should attend, but I sincerely urge you to do it today.
A Bull and a Super Bull
Stock valuation can be a difficult topic because it’s inherently subjective.
What is the fair price today to buy what you think will be $100 in earnings a year from now?
Or five years from now?
The answers will always differ because everyone has their own preferences.
Maybe you would pay more than I would.
Neither of us can prove the
other one wrong.
Sarah Hansen at Morningstar thinks the market is fairly valued.
David Rosenberg, not so much.
But let’s look at some of the other
analysts Sarah quotes in support:
“While the S&P 500 may be ‘egregiously expensive’ versus its historical pricing, Bank of America strategists led by Savita Subramanian recently concluded that stocks are still poised to climb higher.
‘The S&P 500 is half as levered, is [of] higher quality, and has lower earnings volatility than [in] prior decades,’ she wrote last week.
That means a historical look at valuations may not be the most
helpful perspective for investors.
“Goldman Sachs strategist David Kostin has also concluded that today’s rally is different from history.
Unlike in 2021, when extreme valuations were widespread in the market ahead of 2022′s bear-market losses, he finds that today’s elevated valuations are more concentrated among a handful of stocks.
Paradoxically, that’s a good thing.
‘Investors are mostly paying high valuations for the largest growth stocks in the index.
We believe the valuation of the Magnificent Seven is currently supported by their fundamentals,’ he wrote last week.”
But then we get to that timing thing.
The market expected 6 rate cuts early this year.
Now it is 4ish.
Was the market disappointed?
Evidently not.
Earnings keep coming in reasonably well.
Bonds sell off as stocks climb.
In late 2006, I was on The Larry Kudlow Show with Nouriel Roubini and John Rutherford.
Larry and John were aggressively bullish, and Nouriel and I were arguing for a recession and hence a bear market.
(My
rationale was the inverted yield curve and a coming subprime collapse.)
Technically, I was right.
A recession started in 2007 along with the collapsing market.
But my timing was a tad off.
That is, if by “a tad” you mean six months.
Because over the next six months the market rocketed another
20% higher.
(Larry is bullish by nature.
If he really wants to boost the stock
market, he should get me and Nouriel on his show and tell us to be bearish.)
The market today trades at a healthy 24X trailing earnings.
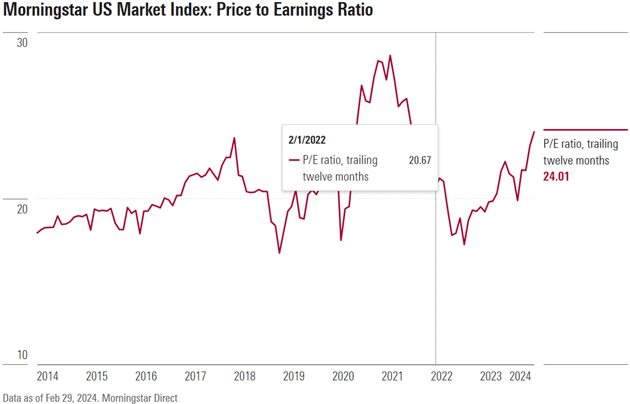
Source: Morningstar
This is clearly in the historical top tier.
But to be fair, I’ve been arguing that past historical data no longer applies in the era that we live in.
Could the “normal” P/E ratio actually be higher than it was in the past?
Possibly.
The world has changed in many ways.
For the record, I am not
selling my stocks and I'm actually shifting a larger portion of my portfolio
into equities, although not growth stocks.
That said, if history means anything, it shows periods when people pay enormous premiums for dubiously projected profits often didn’t end well.
We
are in such a period now.
My good friend David Bahnsen shared this illustration of today’s
price/earnings ratios vs. the 1999 tech bubble year.
“The overall multiple of the S&P is expensive, and 1999 comparisons have been used for good reasons (in so much as much of the high valuation has been concentrated in a certain ‘cool tech’ portion of the market)…
But is the problem even worse than imagined?
On one hand, the high P/E companies today are legitimately better companies and more established in both revenue and earnings.
On the other hand, the quantity of companies trading above 20x, 25x, 30x, 35x, and 40x earnings is significantly higher than it was in 1999.
Then, you at least had 43% of the index trading at 15x or cheaper.
Today, that number is just 25%.”
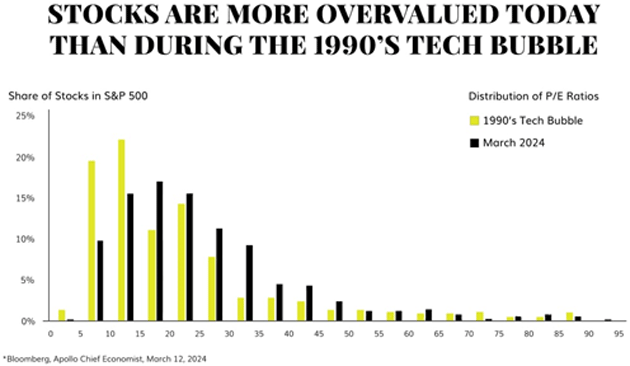
Source: David Bahnsen
The other side of David’s note is that 75% of the S&P 500 stocks are trading at 15X their earnings, or more.
That means you are paying $15 to acquire $1 of profits—which makes sense only if you think someone else will pay even more.
To be fair, that’s been a good bet lately. And a P/E of 15
is quite reasonable.
More important, though, this shows the current bull isn’t, as often thought, simply a function of the “Magnificent 7” stocks becoming brutally overvalued and dragging the index higher.
They are indeed brutally overvalued, and they are dragging the index higher.
But the rest of the market
is hardly cheap.
Here’s a good illustration from Ed Yardeni.
The red line is the normal S&P 500 index, which is weighted by market capitalization and thus becoming top heavy.
The blue line is an index of the same 500 stocks, but
equally weighted so each stock has the same influence.
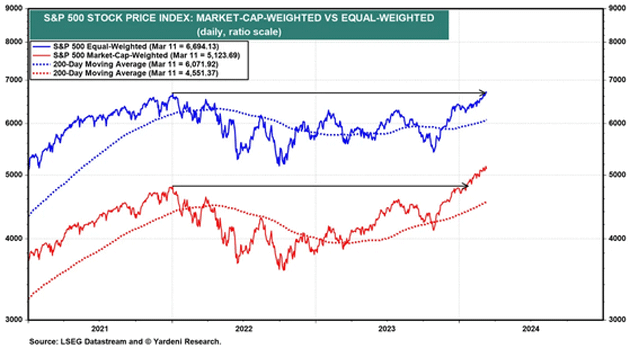
Source: Yardeni Research
Here is Yardeni’s take on the difference.
“The S&P 500 market-weighted stock price index is up 43.2% since the current bull market started on October 12, 2022 (chart).
The equal-weighted version of the index—with the 500 stocks assigned an equivalent weighting regardless of their market capitalization, allowing us to compare performance—is up 29.5% since it bottomed on September 30, 2022.
This confirms our view that the bull market has been a broad one all along.
The equal-weighted index certainly has been in a bull market, it just hasn’t been as awesome as the one for the market-cap-weighted index.
The former
just rose to a new record high, while the latter did so in mid-January.”
So within the S&P 500, we don’t see a Mag-7 bull market and a flat or bear market in the others.
It’s better described as a bull and a super bull.
The bullishness seems to diminish as you go down the size scale.
Small
cap benchmarks like the Russell 2000 are lagging behind.
In Ed’s view, this sets up continued gains as the buying interest goes downscale.
People who are afraid to buy Microsoft or Nvidia at today’s
lofty valuations will look at less expensive (but still giant) companies,
slowly broadening the bull market.
My experience over many decades shows markets can get far more overvalued than I thought possible.
I hesitate to project when this one will end.
But I’m sure it will.
Exit Closed
Another question is whether we are overlooking important changes
in market structure.
A few decades ago, the typical growth company went public as soon as possible because that was the best way to acquire more capital and continue growing. IPOs were a big deal.
Investors would sort through the thousands of
small caps and invest in those they thought had potential.
We have a different pattern now.
Public companies face a variety of new tax and regulatory headaches, making that status less envious.
But more important, the venture capital and private equity industries are better developed.
They can provide growing companies with all the capital they need.
For many companies, the rewards of going public no longer outweigh the hassles and expenses.
IPOs are still necessary, but as more of an ending than a beginning.
The IPO is the “liquidity event” offering insiders and early investors a chance to sell their shares at the highest possible price.
In today’s market, companies stay private as long as possible, hoping for even bigger IPO payoffs.
Or they bypass the IPO process and get acquired by a
larger, already-public company.
But something interesting happened the last few years.
Private equity groups own thousands of companies they would like to sell.
Higher
interest rates present the same problem homebuilders face: High financing costs
reduce the pool of potential buyers, which reduces exit prices.
This isn’t a small problem.
Bain & Co.’s annual private equity report says globally there are about 28,000 unsold companies worth (or so the owners think) more than $3 trillion.
Rather than cut prices, the PE industry seems to be waiting for better times.
This may explain some of Wall Street’s rate cut demands.
They want to have lower rates in the same way homebuilders
want lower mortgage rates.
But the more immediate effect is that it creates a shortage of emerging growth stories to attract investor interest.
The money that would once
have gone into those companies has to go somewhere.
(28,000 companies in private equity hands?
Most are too small to really matter.
If a PE firm buys 200 funeral homes, who cares?
Are you going to invest in your local funeral home?
But 200 of them in one stock? That becomes
interesting. PE companies have their place in the creation of opportunity.)
But there is no escaping the fact that the number, if not size, of public equities is dropping.
Let’s look at two charts.
The first shows
US-listed stocks dropping from 8,090 in 1996 to 4,642 in 2022.
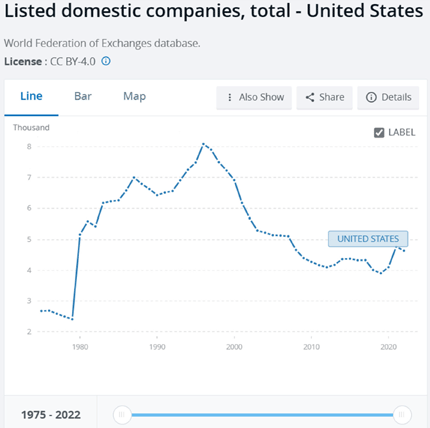
Source: World Bank
It’s even worse when viewed as the number of public companies per
million people in the US:
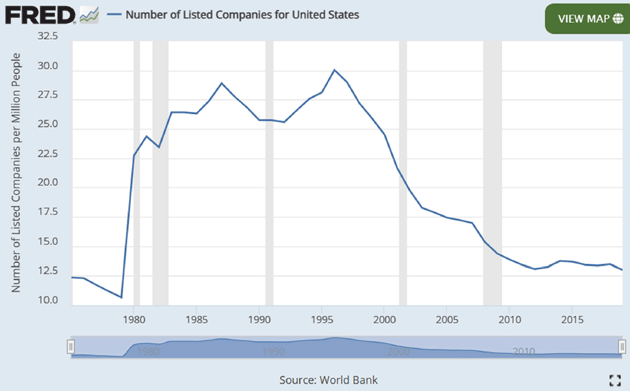
Source: FRED
The number of US public companies is down by more than half.
This
has happened as the number of listed stocks on a global basis has simply
exploded:
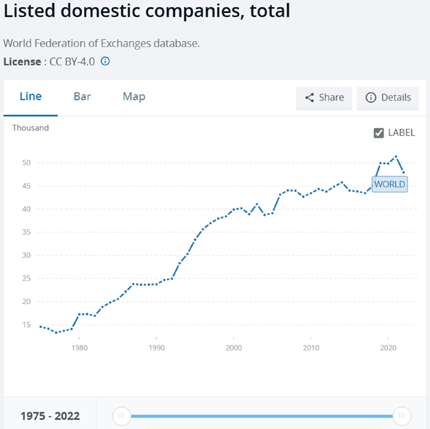
Source: World Bank
This has happened when total money supply has also exploded:
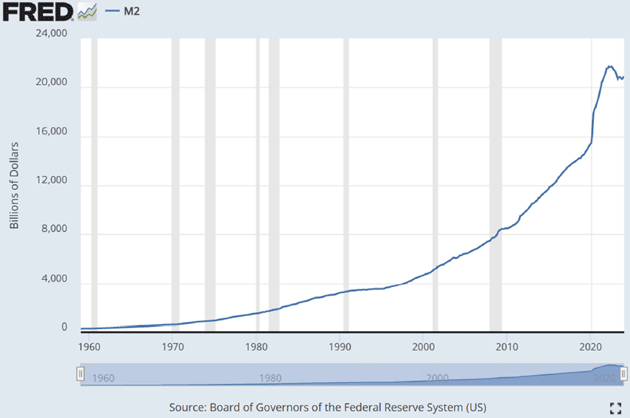
Source: FRED
Too much money chasing too few goods (listed US stocks)?
We should expect the market to rise.
A lot of it seems to be entering the large-cap and mega-cap stocks, raising their valuations in a kind of snowball effect.
This attracts yet more investors at ever higher prices, sending valuations further into the stratosphere.
Big Kahuna
Observation: You can’t buy stocks with your good looks (which would mean I would be out of luck); you need money.
It can be cash or borrowed but money is the fuel that makes the rocket move.
Add more and it goes faster.
What is this market’s cash source?
One contributor is the vast amount of COVID stimulus still working its way through the system.
This let households repair their balance sheets and add to savings.
Businesses, large and small, borrowed boatloads of cash at very low rates which then flowed to shareholders (as buybacks) and to managers, workers, and suppliers.
Some of this cash found its way into stocks.
Rising wages added to the cash flow.
The demographic labor shortage has forced many employers to both raise pay and expand benefits like retirement plans.
This is yet more fuel for the stock market—particularly since
much of it is going to lower-wage service workers who, I must stress, are
wonderful people but often not seasoned investors.
But the Big Kahuna, as always, is the central banks.
Together they provide a lot of cash, as Louis Gave highlighted in a report last week.
“I never tire of quoting Beat Notz,
who many decades ago told me ‘it’s an easy business: just figure out if there
is more money than fools, in which case asset prices rise, or more fools than
money, in which case asset prices struggle.’
“Looking at the world through this prism leads to an old Gavekal favorite: the ratio of market cap to local M2 broad money.
As the chart below indicates, the ratios of fools to money in the US and Japan are starting to look stretched.
China is the mirror image, with
way more money than fools.
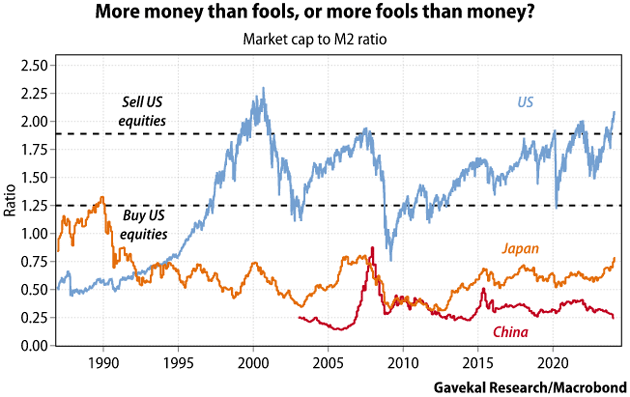
Source: Gavekal
“But in a global world, is this still the right way to look at things?
With capital able to move around ever
more easily, perhaps we should add together the monetary aggregates of the Big
4—the US, the eurozone, China and Japan—in our crude attempt to monitor the
fools-to-money ratio?
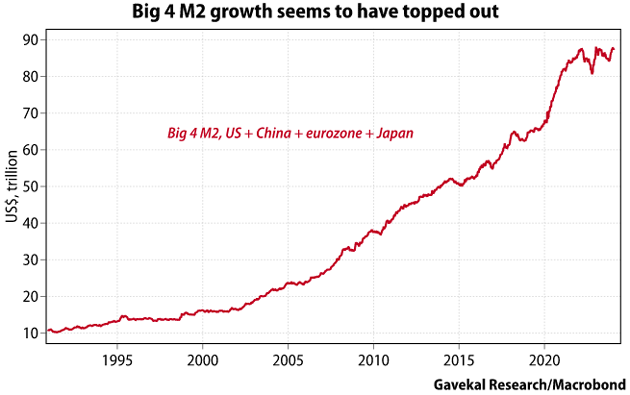
“The chart below shows what Big 4 M2 looks like.
Note the dip in 2022, a year in which bonds and equities both
fell, and the apparent topping out.
Source: Gavekal
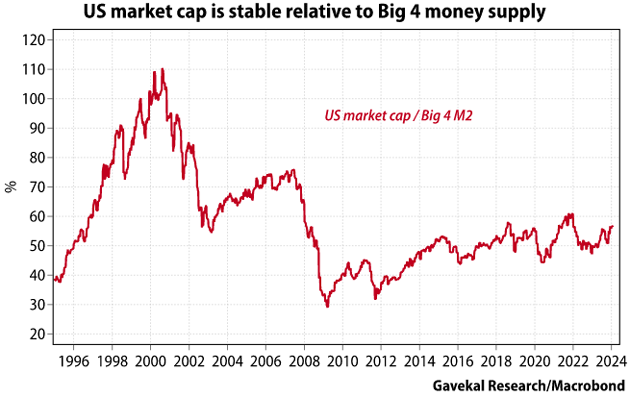
“Using this aggregate as a proxy for ‘money,’ US equity market cap does not look excessive.
This is testimony to a lack of equity issuance.
A unique feature of the last decade’s bull market is
that Wall Street has been busier arranging acquisitions or taking companies
private than in arranging new listings.”
Source: Gavekal
John here again.
Louis makes an important point here.
Total US stock market capitalization as a percentage of global money supply hasn’t changed much.
Some of the price gains we see may just be the natural result of monetary expansion.
Which even in the US hasn’t significantly reversed, despite rate hikes.
Now, add what Louis and I both observed about equity issuance.
The same percentage of a stable or growing money supply going into a smaller number of stocks will, on average, mean more demand for each stock.
Rising prices and
valuations are the natural result.
Further, the nature of capitalization-weighted portfolios will concentrate most of the demand on the largest stocks.
Which is exactly what
we’re seeing.
This arithmetic says we shouldn’t be surprised to see rising stock valuations.
The bigger surprise would be if they weren’t rising.
But that doesn’t mean they will
keep rising.
Look again at how M2 growth seems to be topping.
The market’s fuel tank is beginning to run dry.
It may get drier still if, as rumored, the Bank
of Japan starts exiting from its negative rate policy and yield curve control
next week.
The BOJ is kind of the last man standing from the old NIRP/ZIRP era.
They haven’t needed to tighten because local inflation in Japan has been slow to increase.
But it is finally picking up and, if not next week, the BOJ
seems likely to begin at least some modest tightening soon.
If so, the impact may spread far beyond Japan.
Washington, DC, NYC (?), The Baltics (?)
The tentative plan is to be in DC and then NYC in the middle of April.
I have mentioned I am doing a speech in Cape Town in early June.
Shane and I would like to plan a side trip to Europe either before or after, and the Baltics are on top of my wish list.
There used to be cruise ships which would do the Baltic states and Helsinki (and pre-war to St. Petersburg).
Can anyone
point us to something like that?
Tiffani was with us this week for her 40-something birthday.
We are working together on a project or two, which feels good.
I am making good progress on my book on cycles.
A mountain of research to be done.
The SIC is consuming lots of time as it is really becoming a big deal!
So much but I am grateful for all the opportunities to stay purposefully busy, and healthy enough to do so.
Life is fascinating.
Time to hit the send button.
You have a great week.
Don’t forget to follow me on X.
Your needing more gym time analyst,
|
|
John
Mauldin |
0 comments:
Publicar un comentario