What’s wrong with the Shiller Cape benchmark for markets?
The ratio is wheeled out to support bold claims about future returns. It cannot bear the weight of such expectations
Toby Nangle

Will the stock market go up over the next year or two?
Your answer is likely to depend on any number of things, including whether you think today’s valuation is cheap or dear.
According to Graham and Dodd’s 1934 investment bible, Security Analysis, analysts should average earnings of “no less than five years, preferably seven or ten years” when constructing valuation metrics.
More than half a century later, in 1988, economists Robert Shiller and John Campbell investigated whether this approach could help predict aggregate stock market returns.
They found that it could.
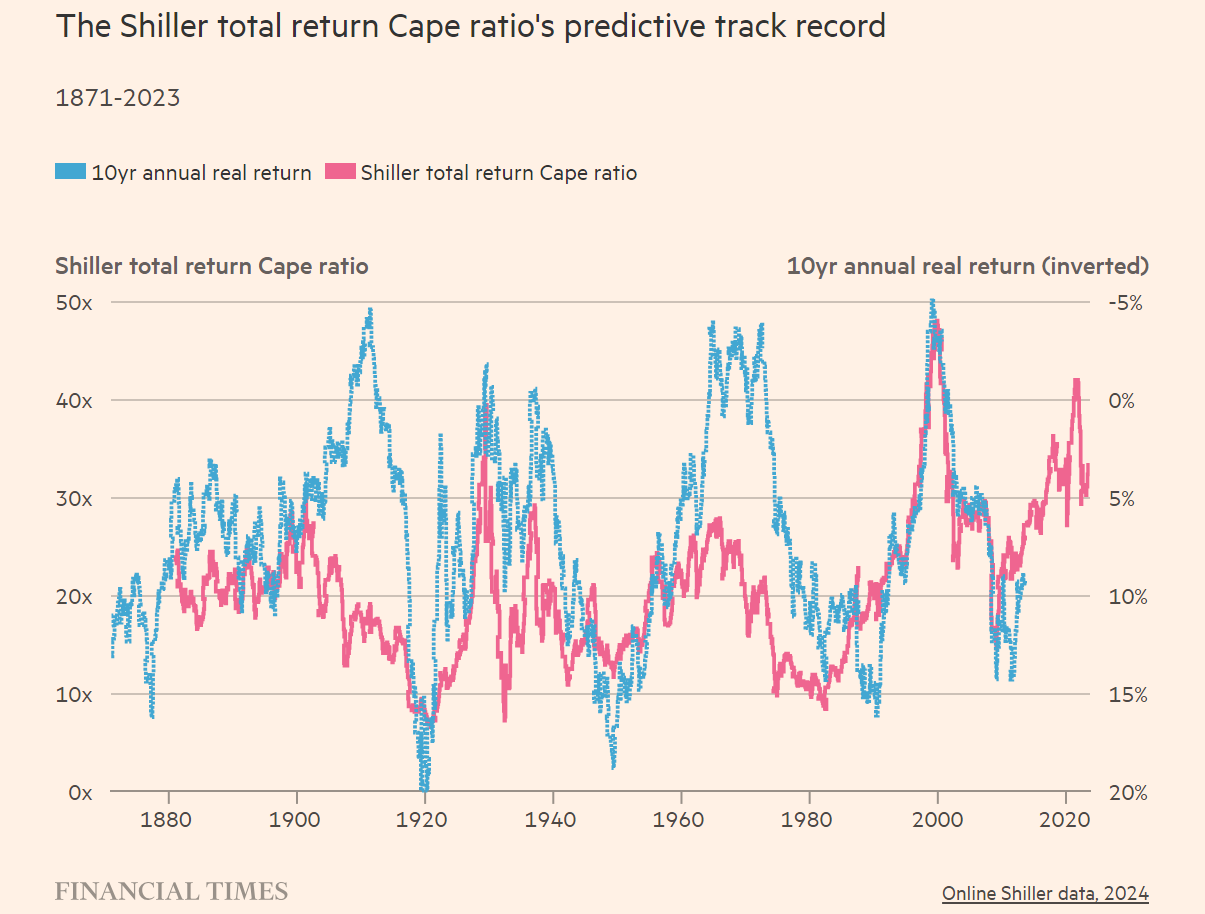
Their Cyclically Adjusted Earnings Ratio – or so-called Shiller Cape – based on ten years’ trailing earnings was born.
The new valuation metric proved far more predicative of future returns than standard price-earnings ratios, explaining over 40 per cent of the variation in market returns over subsequent ten-year holding periods.
But despite negligible predictive powers over shorter one-to-three-year periods, Cape was popularised as an immediate measure of the market.
Leaning heavily on Cape, Shiller and Campbell delivered an emphatically bearish analysis to the Federal Reserve Board in December 1996.
Two days later Alan Greenspan famously asked whether stock prices reflected “irrational exuberance”.
Despite Greenspan’s intervention, the S&P 500 went on to more than double, destroying the careers of any money managers who shared the professors’ conviction.
But the index’s subsequent near-halving is better remembered.
And its collapse entrenched the reputation of Cape as a go-to trusted market barometer.
The latest reading of the Shiller Cape Total Return ratio puts it at 33 times.
This is a flashing red light by historical standards, close to levels seen prior to the 1929 Wall Street crash.
Stock market bears take this as a portent of doom.
But there are good reasons why many asset allocators do not share the same view.
First, while statistically significant, Cape lays no claim to destiny.
The original research found the starting Cape ratio had almost nothing to say about the next single year’s market return.
Second, the Shiller Cape is by design backward-looking and underpinned by the notion of mean-reversion.
As such, the relationship between a Cape ratio and subsequent long-run market returns is distinctly episodic.
Had it existed in the 1960s and 1970s, historically low Cape ratios would have provided no warning to investors of the dismal long-term real returns in store for them.
“The moment you take a 10-year look-back, you are tacitly saying that the forward-looking period will be the same as the last 10-years,” explains John Bilton, head of global multi-asset strategy at JPMorgan Asset Management.
Regimes change, making the measure next to useless at turning points.
In recent times equity markets have continued to rise strongly even when the Cape ratio has suggested overvaluation.
Since 2014, the metric has sat belligerently in the richest decile of its historical record almost without break.
If investors pulled out of equities as a result of this backward-looking valuation, they would have missed one of the strongest bull markets in history.
During the pandemic, Shiller himself pivoted away from the Cape ratio, and towards the so-called Excess Cape Yield.
This is the difference between inflation-adjusted Treasury yields and the cyclically adjusted earnings yield — the long-term average of aggregate earnings per share divided by average share prices, or the Cape ratio flipped.
The logic of the switch appears sound.
Assets are priced in reference to one another, and central bank policy that delivered extraordinarily low after-inflation bond yields could explain why investors might rationally pay more for stocks. In late 2020, the excess yield measure made equities look cheap even after their strong rally.
This measure now makes them look on the rich side of average.
But by my estimate, the explanatory power of the excess yield in forecasting excess returns has been weak.
Perhaps this assessment comes across too negative. Cape ticks many boxes you’d want from a rule-of-thumb: simplicity, comprehensibility, and clarity.
Its relationship to long-term returns is statistically significant but for short-term forecasting it is next to useless.
And even longer-term forecasting accuracy depends on the future looking like the past.
We should celebrate it as a superb starting point for market analysis — one that furnishes market outsiders with probing questions to put to their fund managers.
But let’s not overburden it with unrealistic expectations of precision.
The writer is an FT contributing editor
0 comments:
Publicar un comentario