The liquidity gusher is gushing a little bit slower
Robert Armstrong
This line goes pretty much straight up lately:

What you are looking at is volume of reverse repo.
The Fed has been selling, oh, half a trillion dollars in Treasuries overnight for cash, with an agreement to buy them in the morning at a slightly higher price.
To put it differently, investors have been making very short-term collateralised loans to the Fed.
This is interesting because at the same time, in a separate operation, the Fed is still buying $80bn in long-dated Treasuries a month.
Here is the New York Fed definition of reverse repo:
In a reverse repo transaction [the Fed] sells securities to a counterparty subject to an agreement to repurchase the securities at a later date at a higher repurchase price. Reverse repo transactions temporarily reduce the quantity of reserve balances in the banking system.
This is a way for the Fed to (in everyone’s favourite phrase) “mop up excess liquidity”.
There is so much cash in the financial system that short-term rates, including the repo rates, Treasury bills, and the Fed’s policy rate, are all threatening to fall below zero.
The Fed has long said it does not like negative interest rates, so it has brought out the mop.
Why that is important to investors is that the amount of liquidity in the financial system and asset prices seem to be linked.
I spoke about this on Monday with Michael Howell, whose research at CrossBorder Capital focuses on global liquidity.
Howell noted that there is a debate among liquidity watchers as to whether the Fed’s half-trillion reverse repo operation is simply “technical” (a response to a particular issue in market functioning) or is in fact a backdoor way to begin tapering quantitative easing.
He doesn’t have a strong view either way.
The point for him is that, in part because of the Fed’s reverse repo, global liquidity growth is decelerating.
That is very likely to affect asset prices.
Indeed he thinks it already has.
Howell sees the imprint of the change in liquidity in the sideways equity markets of the past few months, and in the flattening yield curve.
There are various ways of measuring the slowdown in global liquidity, but the simplest is to observe, as Howell does, that global central bank balance sheets expanded by $483bn in May, less than half the April expansion and well below the levels of May 2020.
Howell also provides the chart below, showing the annual change in the global monetary base (in yellow) slowing down from 35 per cent to 20 per cent in recent weeks (the red line is an index of the total stock of savings and newly extended credit in 80 countries):
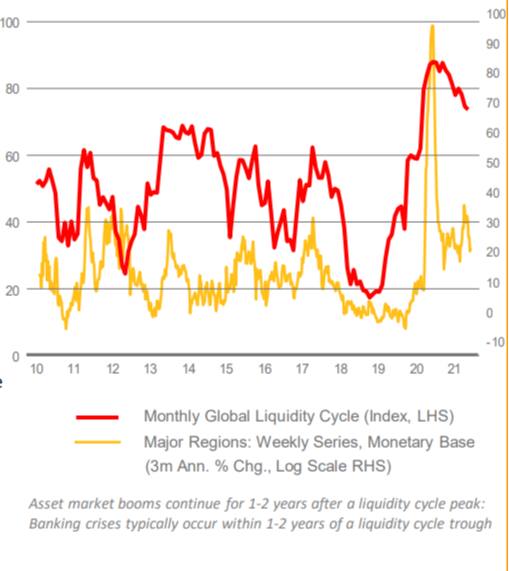
The punchline, of course, is that when the amount of liquidity goes down, investors' portfolio preferences change — they are happy to hold less risk.
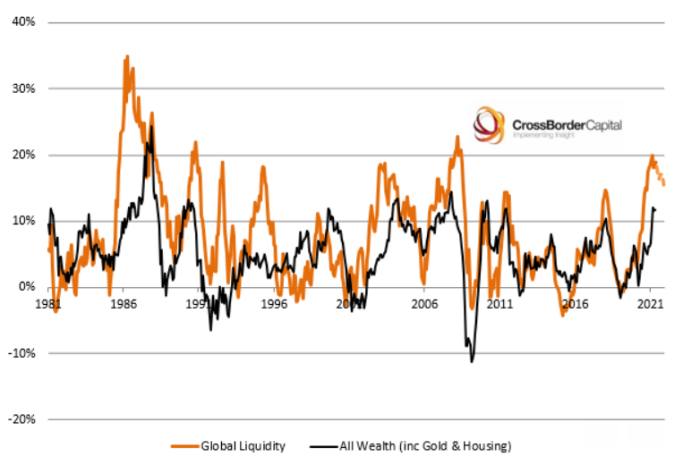
Hence this long-term rough relationship between changes in global liquidity (again, savings plus newly issued credit instruments) and changes in total wealth (stocks, bonds, gold, real estate):
Howell’s way of thinking about things is new to me, so I’m not sure if I am getting it quite right.
But it might be useful to think of them in contrast to Robert Shiller’s classic model from Irrational Exuberance.
Shiller’s view is that the valuation of assets, relative to their cash flows, varies around a fairly stable mean, with the divergences from the mean caused by changes in investors’ level of optimism.
Howell says the variation around the mean is largely the product of liquidity flows, which change investors’ portfolio preferences.
Of course the two models may be complimentary.
Another view on the dollar
On Monday I wrote this:
The US buys a lot more stuff from the rest of the world than the world buys from the US.
That difference has to be financed; as a matter of mathematical identity, there has to be an inflow to match that outflow.
There could be inflows in the form of, for example, direct foreign investment in US real assets or, as is more often the case, investment in US securities, most often our sovereign bonds.
I was trying to give a characterisation of one popular view of why the dollar has to fall — the “twin deficits” hypothesis — rather than give my own, considered opinion.
But still I should have been more careful.
That paragraph assumes that the trade imbalance causes a capital account imbalance.
But all we really know is that the trade account and the capital account must sum to zero, as a matter of accounting.
We don’t know which way the causality runs.
It could be that the capital account surplus causes the trade deficit.
The person who called me out on this is the financial economist Michael Pettis, in a series of tweets:

Thinking about the trade imbalance as the cause is easy and intuitive, as I demonstrated on Monday.
The story is that Americans are fat, lazy consumers who don’t make stuff any more, but buy lots of things that lean, hard-working foreigners make.
That drives a trade imbalance that has to be offset by capital inflows to the US — bond purchases by the Chinese, and so on.
Pettis’ point (put with maximum simplicity if not accuracy) is that there is a lot of excess savings around the world, particularly in China, Germany and Japan, mostly resulting from bad economic policy.
A lot of these excess savings get funnelled towards the US because there are no other capital markets open or deep enough to take them.
America becomes the “shock absorber” for the world’s imbalances of savings and investment (or if you prefer, its insufficient demand).
The capital account, the massive inflow of excess global savings, determines the trade balance, not the other way around.
This story is hardly intuitive.
How are US consumers forced to buy stuff, or the US forced to borrow, simply because capital from the rest of the world wants to come to America?
Well, for one example, foreign capital could find its way into US consumers’ hands, and turn into consumer spending, by way of financial institutions that offer them very cheap loans to finance consumption.
As the economist Amir Sufi pointed out to be, think of the insane American rebranding of second mortgages as “home equity loans”.
That’s a symptom of global capital pushing its way into the US and incentivising US deficit spending using good old marketing.
For our purposes, the point is that if you think US deficits are caused by international savings gluts, rather than by domestic profligacy, you are probably less likely to think the dollar is doomed to depreciation.
Yet another view on the dollar
On Monday I used a chart from Strategas’ Jason Trennert, showing that price/earnings ratios tend to vary with the dollar in the last 30 years — which makes sense, conceived in terms of global capital flows.
Ian Harnett of Absolute Strategy Research emailed me to point out that if you go back further, the correlation does not hold at all:
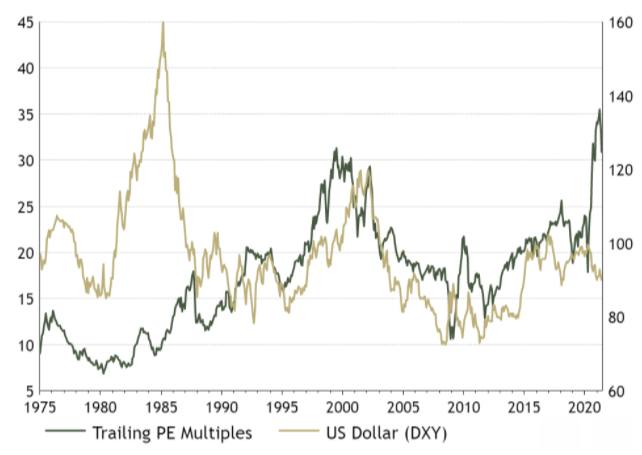
There was a regime change in this relationship in the late 80s.
Are we having another now?
0 comments:
Publicar un comentario