by: Austrolib

Summary
- Silver has been in a bear market for 9 years, but record deliveries are happening on the Comex and silver is dipping in and out of backwardation this month.
- Silver has been in a bear market for 9 years, but record deliveries are happening on the Comex and silver is dipping in and out of backwardation this month.
- Silver outperforms gold, but only at the tail end of bull markets, as in August 1979-January 1980, and August 2010-April 2011.
- Silver's 50WMA just moved above its 200WMA for the first time since 2003, when it started a 10x rally to the 2011 top.
- I believe the next 10x rally is starting now, but the top should come much quicker this time.
Silver is in backwardation.
Physical deliveries of silver this month, July 2020, are at all time records, and July isn't even half over yet. Something big is happening in silver, and it's best if gold bugs don't miss it by paying too much attention to gold.
.
Us precious metals guys, we know the gold numbers very well, but silver gets lost in the mix.
.
The silver rallies tend to be so fast, furious and short-lived that we tend to forget what actually happened, making it difficult to prepare for the next one.
How long has silver been in a bull market, using that hackneyed 20% off lows definition for bull markets? How long was the bear market?
.
The answer to the first question is actually less than 4 months.
.
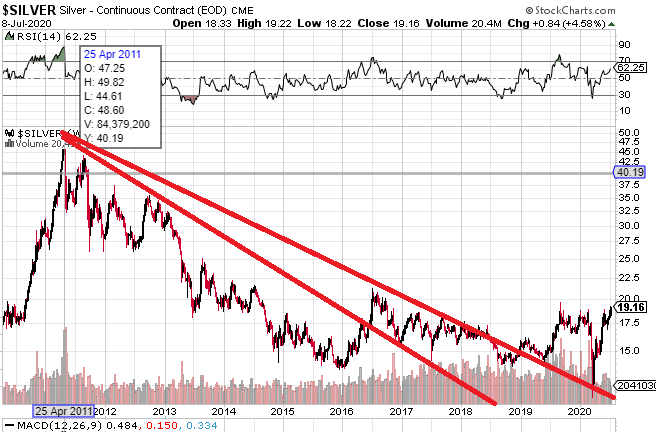
The bull market in silver began on March 16, 2020. Technically speaking, since silver hit its peak of $49.82 on April 24, 2011, gold's volatile cousin has been in a nearly 9-year bear market.
.
Not without what turned out to be bullish head fakes in hindsight, but the lows of $11.64 were only hit in March.
.
Not without what turned out to be bullish head fakes in hindsight, but the lows of $11.64 were only hit in March.
.
.
Could this be another bullish head fake? Anything is possible in commodities - heck we just saw negative oil prices - but it would be a historic stretch to say this is another silver head fake.
.
Could this be another bullish head fake? Anything is possible in commodities - heck we just saw negative oil prices - but it would be a historic stretch to say this is another silver head fake.
.
In fact, about a month before oil hit negative $35, silver was hitting its own all-time record lows in gold terms at 131.41 ounces of silver per ounce of gold. See below.
.
.
Nothing close to this ratio has ever been seen before in all of human economic history, so unless gold is in a major bear market, silver's bear market is almost certainly over.
In fact, the 1980 gold:silver low at 15 was actually the standard set during most of the 19th century.
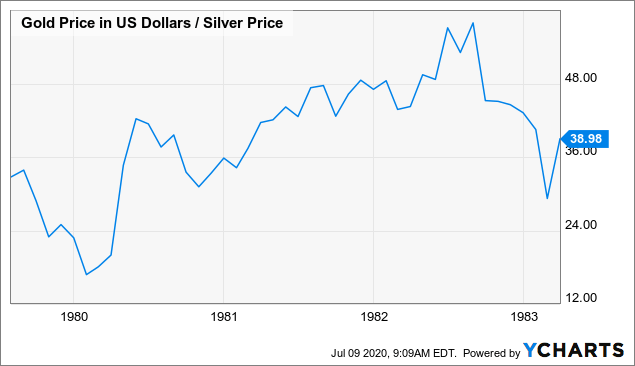 Data by YCharts
So what happens now?
Well, if history rhymes, I believe silver is at the very beginning of a historic rally that should take it to all time highs in the triple digits.
The rally should be fast and furious as were the previous two in 1980 and 2011, my guess taking about 2 years or less this time.
First let's look at the last two major silver rallies and how they unfolded, to give us a hint about how this next one could unfold.
April 1978 - January 1980
The 1978-1980 bull market in silver was like an approaching storm climaxed by a tornado.
Here's what it looked like, relative to gold, from beginning to end:
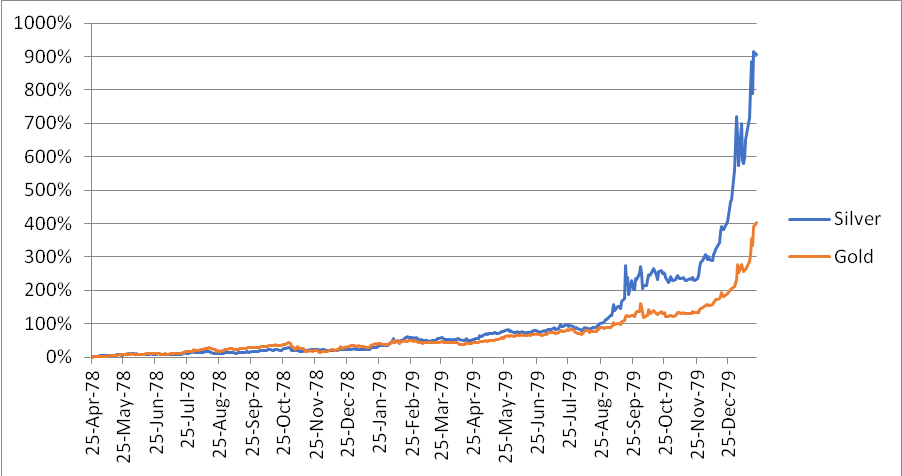
It is often said that silver magnifies the moves in gold about 2x.
That's true over the course of an entire bull market as you can see above, but it doesn't happen at an even pace.
We can divide this run into two parts.
Part one, 16 months from April 1978 to August 1979, when the two metals traded at pretty much an even pace.
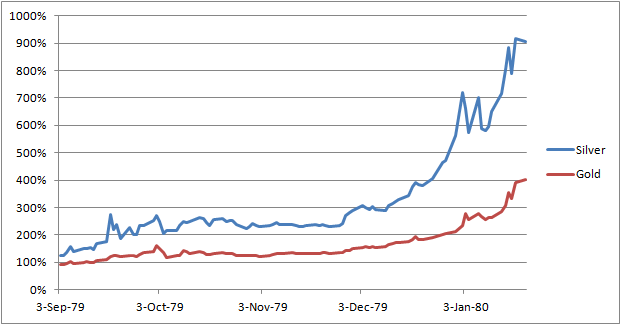
Then, the 5 months from September 1979 to January 1980 when silver went ballistic.
Here's a zoom-in on the first 16 months so you can better see what happened.
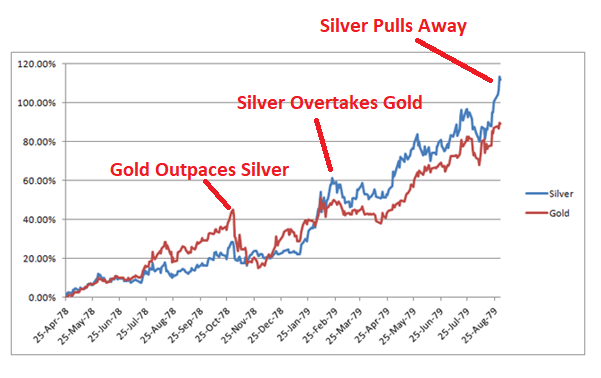
For most of 1978 until October, gold actually outpaced silver by about 100%.
By February, silver overtook gold, and by the end of August, silver began to pull away.
Then for the next five months, silver went totally berserk.
October 2008 - April 2011
Something similar happened from the 2008 financial crisis bottom on precious metals on October 31, 2008 until the silver peak in April 2011.
Here's the full chart of that run.
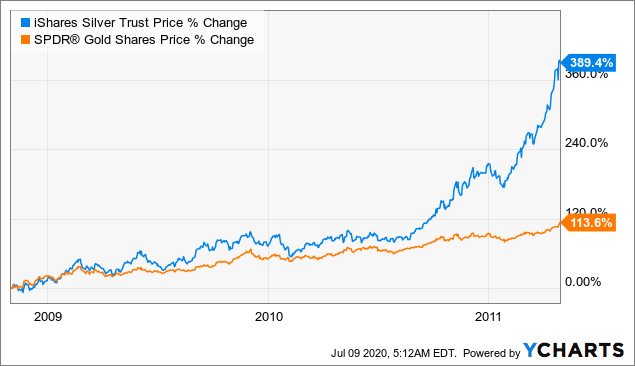
From October 2008 until around August 2010, the two metals traded mostly evenly.
Silver outpaced gold on occasion, but corrected back down towards it repeatedly during that time.
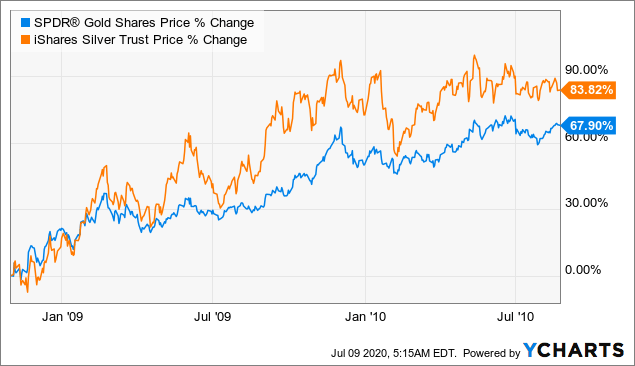
Around the end of August 2010 though, silver began to pull away with complete abandon.
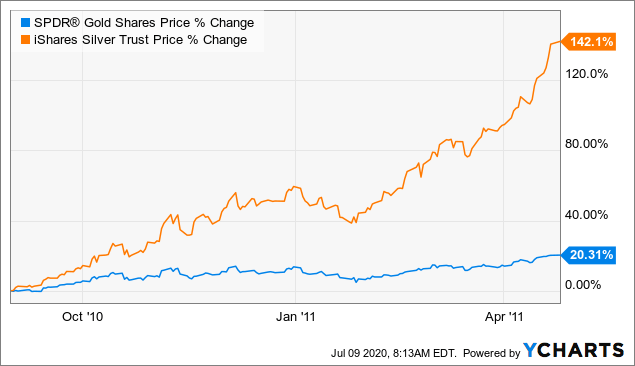
This is how silver tends to outperform gold.
The bulk of the outperformance happens at the end of a bull rally, not throughout.
Since gold bottomed in late 2015 though at $1,044, silver has not confirmed.
If March 16, 2020 was the bear market bottom in silver, then we may now be entering the initial stages of the real gold bull rally that should be led by silver.
Here's where we are now, counting March 16 as the equivalent of the post 2008 financial crisis precious metals lows on October 31, 2008:
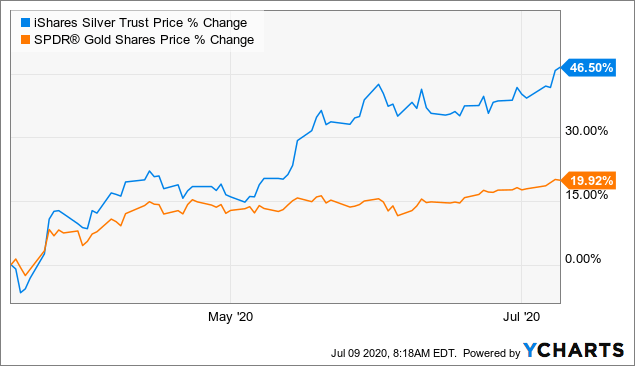
It looks like silver may be already pulling away from gold.
If, during the next gold correction, silver doesn't fall hard, we may be much nearer the parabolic stages than we were in the last two rallies.
Technical Indicators Pointing to Something Big Brewing
I don't pay all that much attention to technical signals, most of the time at least.
But signals that happen once in a decade I do pay attention to.
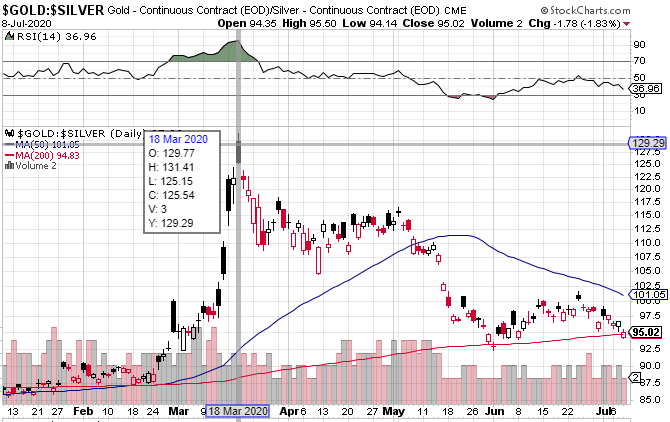
First though, on the short-term daily chart, the 50 day moving average in silver just moved above the 200DMA.
This could be a nice sign for technical short-term traders who may have their algorithms pinging at them that something is happening in silver. See red circle at the right.
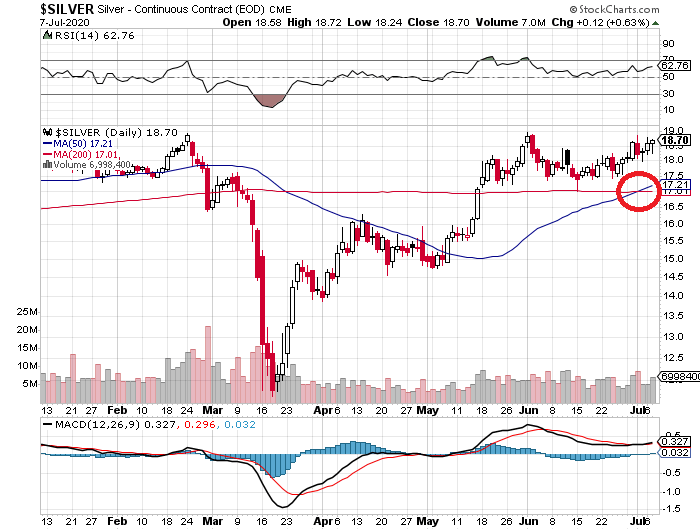
This by itself isn't much, and doesn't point to anything long term.
However, something much more significant is happening on the long-term chart.
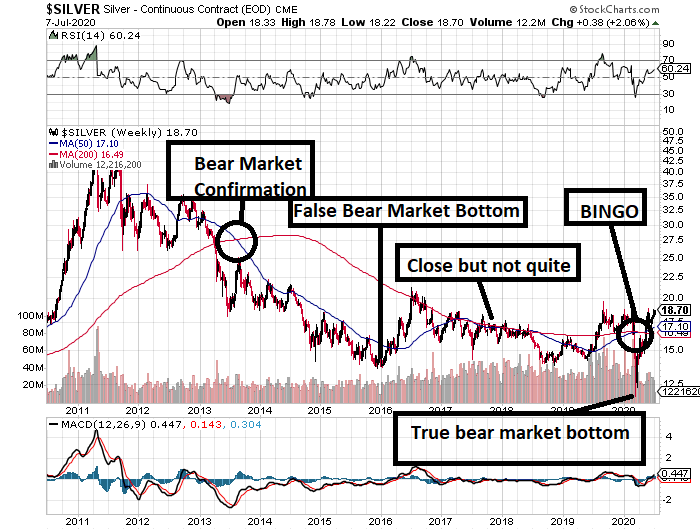
From the above silver chart, we see the 50 week moving average (blue line) first fell below the 200WMA way back in the summer of 2013.
From that point until the end of the gold bear market in late 2015, the 50WMA acted as resistance for silver.
You can see that from 2013 until 2016 price just could not get above that blue line.
Then the new bull market in gold began, but this new bull market in gold was never confirmed by silver.
After the initial stages of the gold bull market from December 2015 to July 2016, silver indeed broke out but once it hit the 200WMA, that red line began acting as major resistance.
The final historic washout for silver was in March during the COVID-19 liquidity crunch,
which we can count as the actual bear market bottom for a bear market that has lasted 9 years.
which we can count as the actual bear market bottom for a bear market that has lasted 9 years.
But here's what may be the really big deal: On the long-term chart above, you can also see that the 50WMA has just broken decisively above the 200WMA.
This, for the first time since…
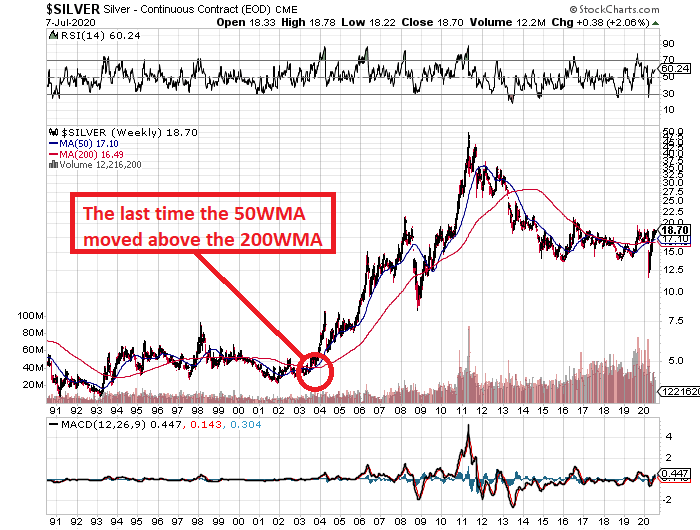
October 2003. (Excluding a very brief dip and break back above in 2009 post financial crisis.)
From that point in 2003 over the next 7 and a half years, silver skyrocketed 10x, an order of magnitude.
That can, and I believe will, happen again, with the starting point being this month, July 2020.
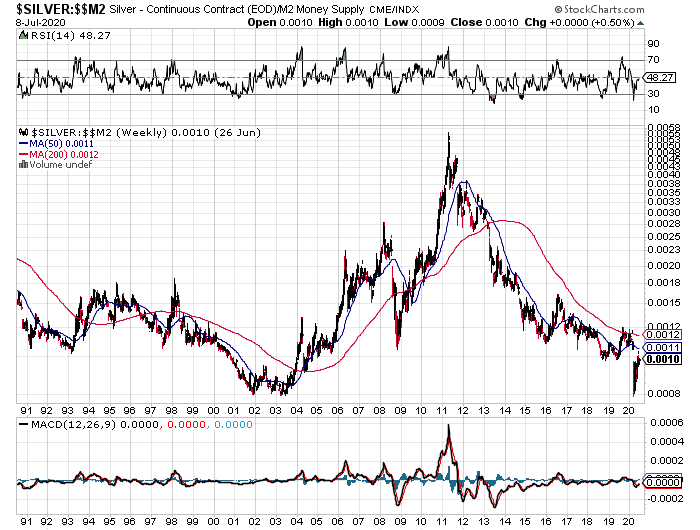
But something else also happened in March, another historic record in silver.
Relative to the US M2 money supply, the price of silver is coming off all time lows also not seen since 2003.
If silver does nothing but stay where it is in money supply terms, it will still rise significantly.
Money supply is not going to stop rising any time soon, not with the Fed printing as much as it is.
Physical Demand Rising
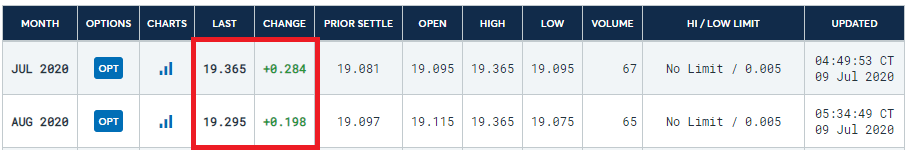
This impending rally is being confirmed, I believe, by the physical markets. I don't believe the backwardation we saw in the silver market the morning of July 9, 2020 is a coincidence.
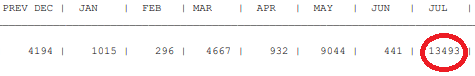
Deliveries from the Comex are also hitting records.
Keep in mind that July is only a third of the way done.
Here's the silver backwardation already happening, with timestamps.
Notice spot price is above the August contract.
This indicates high demand for physical delivery.
If silver could make a 10x run from 2003 to 2011, I believe it can make another 10x run from $11 to $110, but much faster this time, to keep pace with the expanding money supply.
If silver really is in a bull market, then it should go above $50, as that was the 1980 top as well, and approach the 15:1 gold to silver ratio that is closer to historic norms.
If we count by tops, silver has been in a bear market for 30 years now.
I believe silver is about to finally break out, in a big way, way past all time record highs in dollar terms.
0 comments:
Publicar un comentario