by Marin Katusa
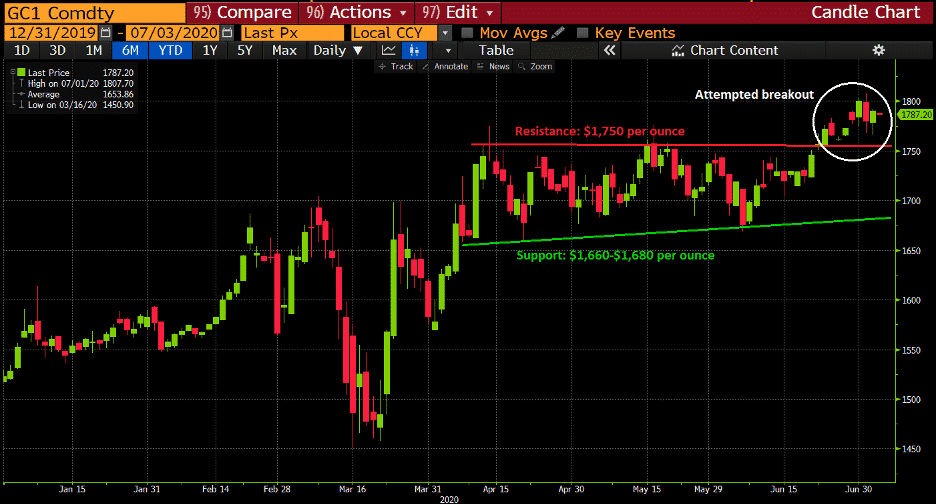
For the first time since 2011, gold traded hands above $1,800 per ounce.
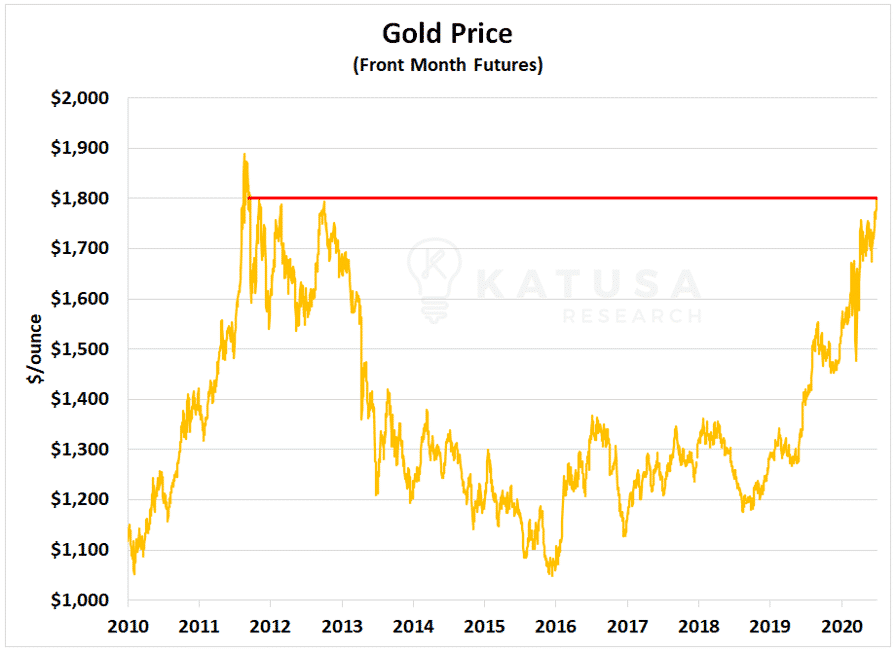
Naturally, this has every goldbug and self-proclaimed expert on YouTube shouting from the rooftops.
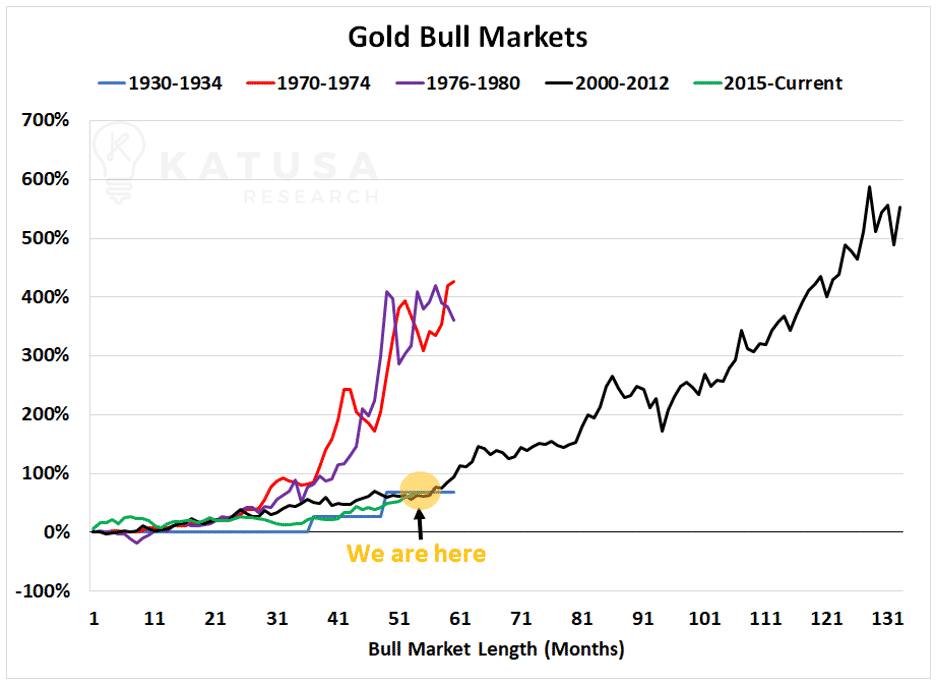
Before we jump into what is going on in the gold markets, let’s first take a look at past bull markets.
Below is a chart that shows the previous major bull markets in gold. You will see that all but one of the major gold bull markets resulted in gold appreciating at least 400%. Using January 2016 as the low point for the current gold bull market, gold is up 69% from its lows.
History may not repeat itself, but it’s critical to understand what is driving the price of gold right now.
What is Driving the Gold Market Higher?
Right now, there are several major economic factors driving gold higher.
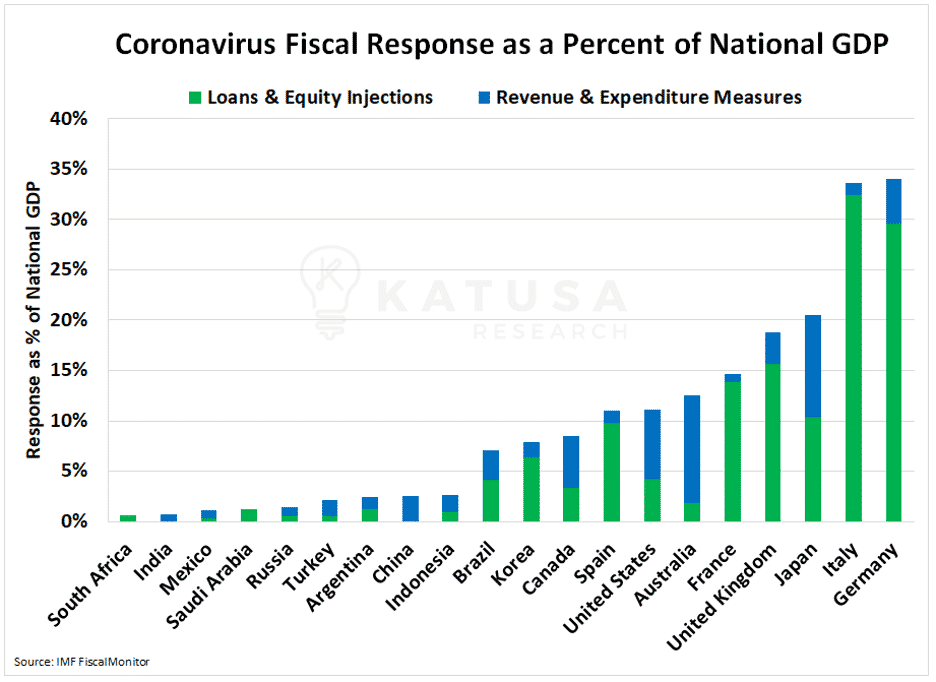
1) Large Government Stimulus Packages Around the World
This leads to currency devaluation. The global fiscal-policy response to the coronavirus is $9 trillion to date and likely to climb further. This is supportive of assets like gold, which are a store of value.
Below is a chart that shows the fiscal-policy response of major economies around the world.
The fiscal-policy response is illustrated as a percentage of the country’s GDP.
2) NIRP – Negative Interest Rate Policy
Around the world, central banks are cutting interest rates. Starved investors are clamoring for any bond trading with a reasonable yield. This drives bond prices higher and bond yields lower.
Low interest rates discourage investors from investing in government bonds and forces them to look elsewhere for safe-haven investments—such as gold.
Below is a chart that shows government bond yields around the world.
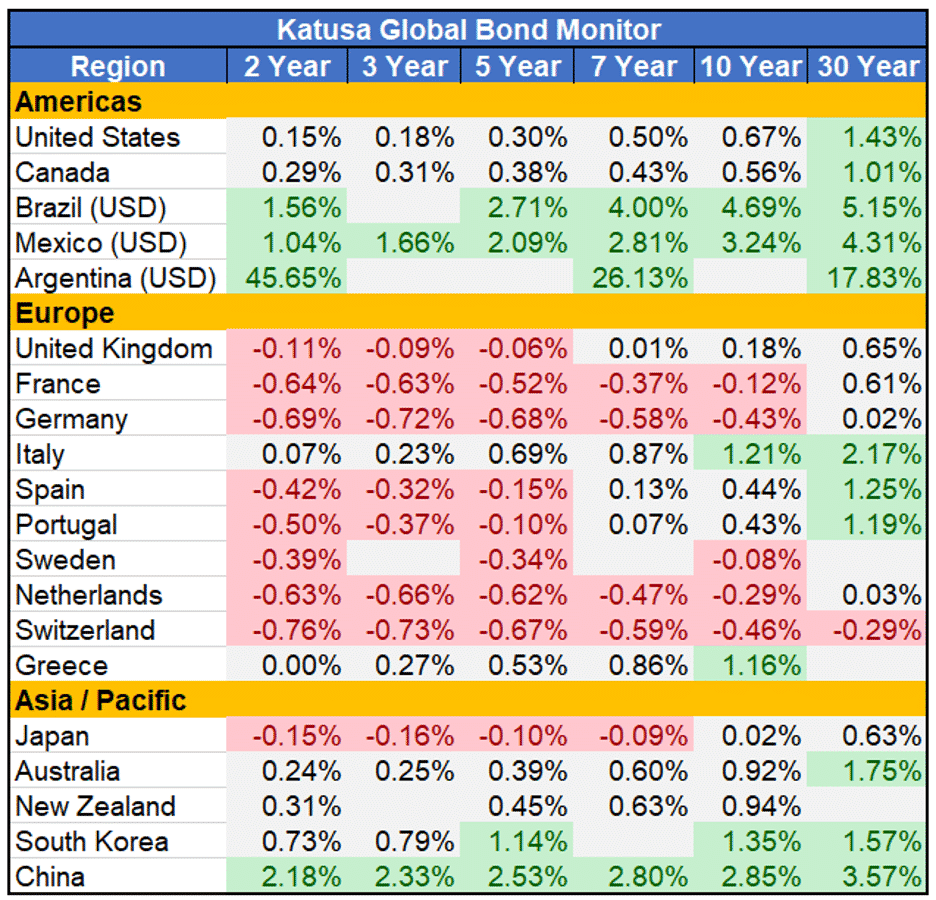
You’ll notice that Europe is nearly all red.
The combination of investors starving for yields and central banks’ NIRPs has driven most government-bond yields into negative territory.
The rest of the developed world is not far behind.
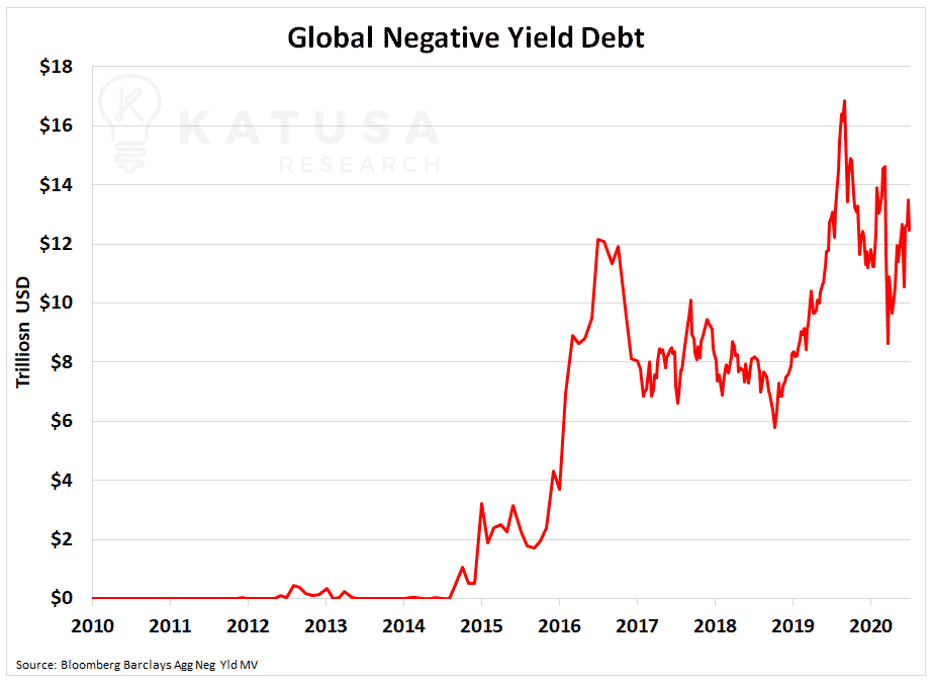
These low rates have driven the total amount of negative-yielding debts to levels we’ve never seen before.
In the past 5 years, global negative yield debt has soared from zero to over $12 trillion.
3) The Deflation and Stagflation Trade
I have written extensively about the weak productivity and GDP, high unemployment, and high costs of primary goods (food, water, shelter).
This type of economic environment incentivizes investors around the world to buy safe-haven assets, which are stores of value.
The International Monetary Fund (IMF) is projecting a deep recession and slow recovery.
In its most recent remarks on June 30th, the IMF revised its forecast for global GDP to -4.9%.
What is more worrisome is that the IMF forecast for developed nations is comprised of nations like the United States, Germany, and China.
The IMF forecasts they will contract by 8%. Also, the IMF projects that total business losses will be over $12 trillion.
Below are the 2020 projections for the gross domestic product of major economies.
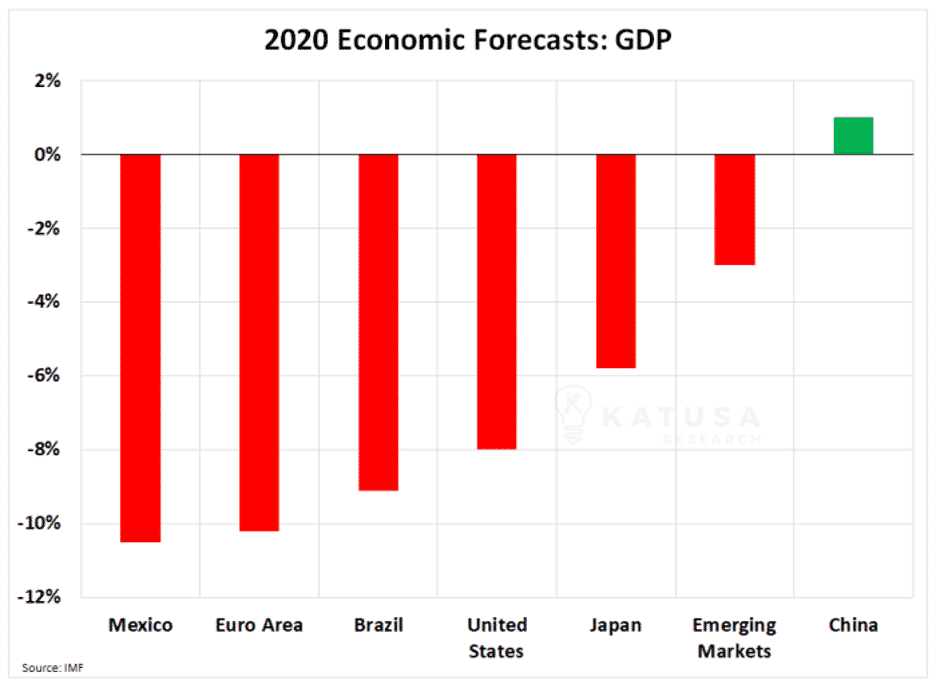
Let’s not forget that Mexico is a very important trading partner for the U.S. There are many troubling signs in the market.
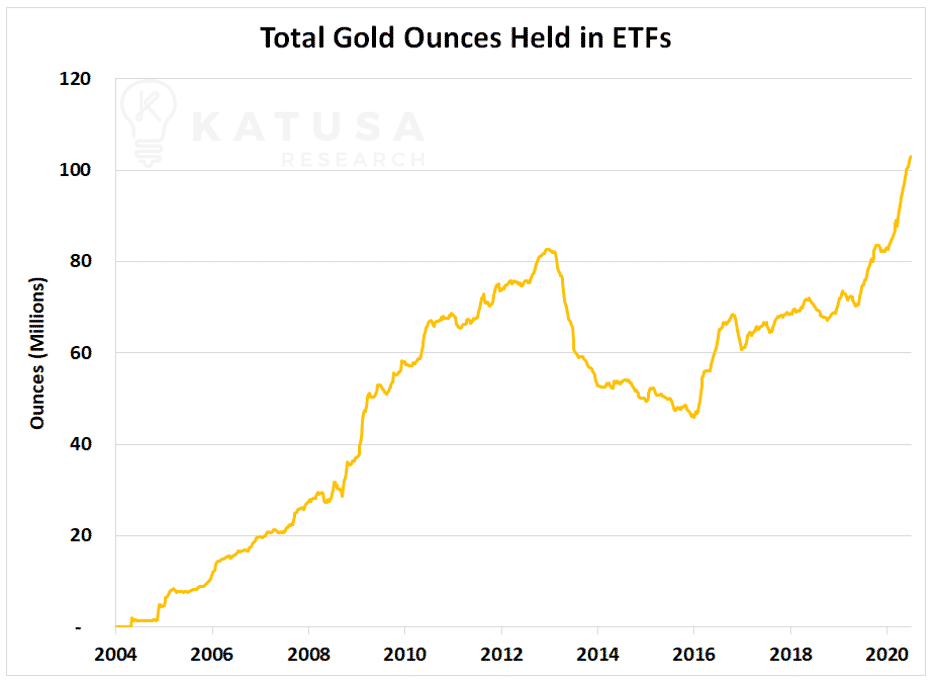
4) ETF Inflows Continue to Hit New Highs
Gold-backed ETFs have seen record inflows for weeks on end, as investors clamor for exposure to the metal.
As ETFs create new units, each of which is backed by gold, this requires the ETF to purchase more gold.
What’s Next for Gold?
I don’t see the Federal Reserve bank, or any other major central bank around the world, slowing the money printing presses.
Nor do I see any central banks of developed nations having the ability to raise interest rates.
This type of currency devaluation provides a solid, long-term thesis for gold.
I do think gold needs more time to consolidate in this upper range before making a sustainable move higher.
Could Silver Play Catch Up?
Using January 2016 as the start of this bull market, it is clear that silver has drastically underperformed gold.
The chart below shows silver is only up 30% from January 2016, compared to gold, which is up 67%.
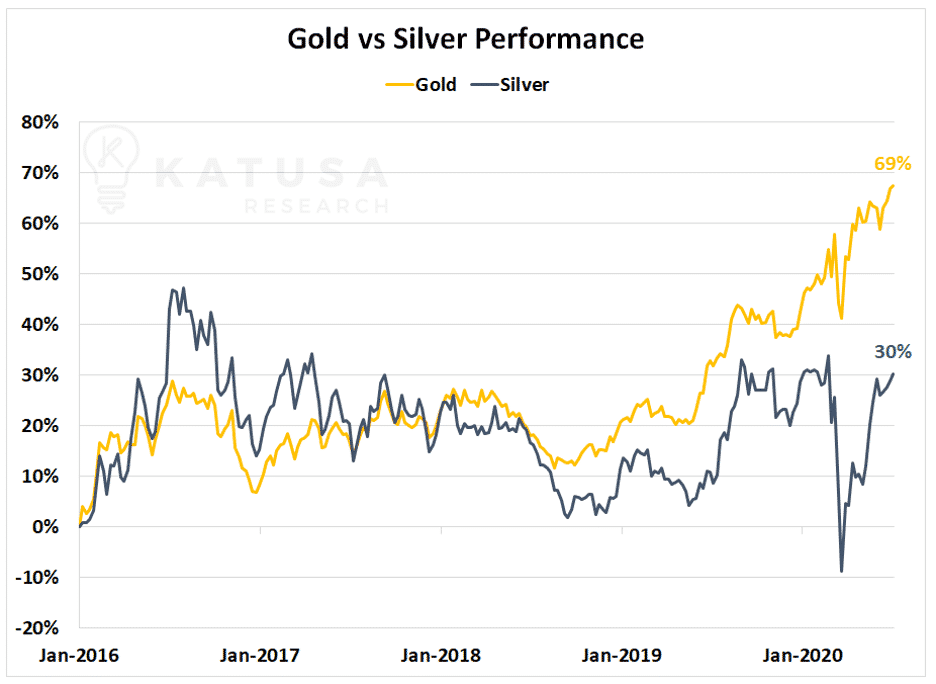
This has led to a record diversion between the valuation of gold and silver.
And this is demonstrated by the gold-to-silver ratio.
Much to the chagrin of silver bugs, the ratio has continuously made new highs, meaning that gold is taking off—leaving silver behind.
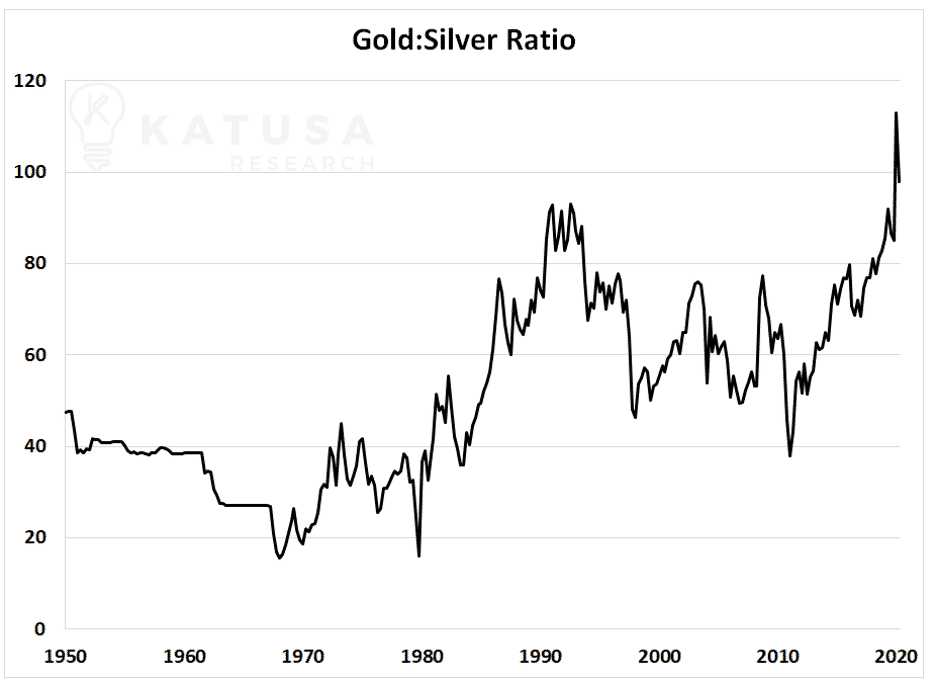
In fact, I don’t think the gold-to-silver ratio is particularly helpful as an investment tool.
The gold-to-silver ratio reminds me of the oil-to-natural gas ratio of the mid-2000s…
For decades, the oil to natural gas ratio was fixed at 6 to 1 because the pricing was fixed on an energy equivalent basis.
The shale revolution changed that when in 2007, the shale produced so much gas that the ratio became irrelevant.
Silver is an industrial metal with some precious metal attributes.
Don’t forget there is very little primary silver production.
That means a lot more silver is produced as a by-product of existing mines.
Also, a slower global economy does not bode well for industrial metals.
Silver will do okay, but gold is where the action is and will continue to be.
How is Marin Katusa Investing in Gold?
I have spent two decades in the resource space as a professional fund manager and investor.
I make 99% of my income from investments within the resource space.
I’ll let you in on a simple formula for achieving big success in resource markets…
Here are two of my most important criteria:
• Management team quality and track record of success
• Assets located in +SWAP Line Nations.
A bad management team can screw up a good deposit.
On the other hand, a good management team possesses both intellectual and physical capital.
This allows it to create situations with exceptional upside and less risk.
My old rule was to avoid the AK-47 nations.
Those are nations where AK-47s are required to feel safe, both for traveling and as a local.
Having traveled to over 100 countries, I’ve strapped on the bulletproof vests and hired ex-military for security.
I avoid that now.
It might make for a good story, but in reality, it’s not worth it.
I’ve taken my thesis a step further during the COVID-19 pandemic, with my +SWAP and -SWAP Line Nations argument.
This suggests that nations with access to US-dollar SWAP lines will receive preferential treatment and trade agreements versus those without access to US-dollar SWAP lines.
I think this is a trend that will build over the next 3–5 years before coming to fruition.
Positioning yourself in the resource game requires more than throwing a dart at the board.
Buying an ETF like the Junior Gold Miner ETF will give you some exposure, but not a lot.
The sniper approach is simply the best.
0 comments:
Publicar un comentario