Gold: Look Out Below
by: Equity Management Academy
Summary
- Gold is becoming a currency, separating itself from the US dollar. The stock market also broke away from Main Street.
- Now the market is having a problem making higher highs, right where the VC PMI is telling you to expect sellers to come into the market.
I- t is a question of leadership, whether the gold mining shares are catching up to the price of gold or are they leading the way to a new bull market.
- Gold appears to be consolidating in the area of $1,700 to $1,800. If gold can’t reach new highs, it indicates that the buying pressure is weak and there will be pressure to the downside.
We use the proprietary Variable Changing Price Momentum Indicator (VC PMI) to analyze markets.
The VC PMI is based on artificial intelligence and an advanced algorithm. It can be used to trade stocks, ETFs, futures or options. We specialize in the precious metals and the E-mini, looking for day, swing and long-term trades.
Gold: Weekly Data and Triggers
Summary
The weekly trend momentum of $1,727 is bullish.
The weekly VC PMI of $1,736 is bullish.
A close below $1,736 stop negates this bullishness to neutral.
If long, take profits $1,772-$1,791.
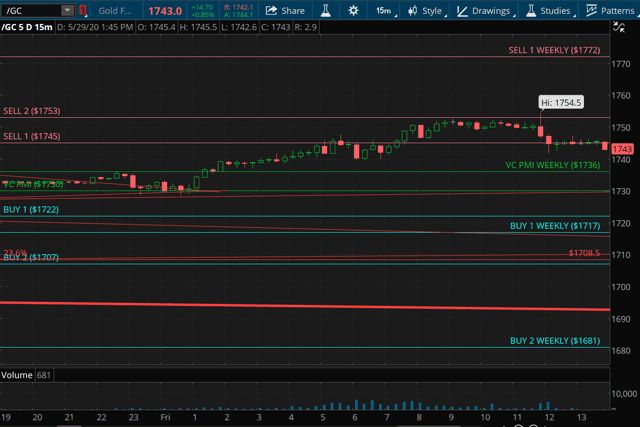
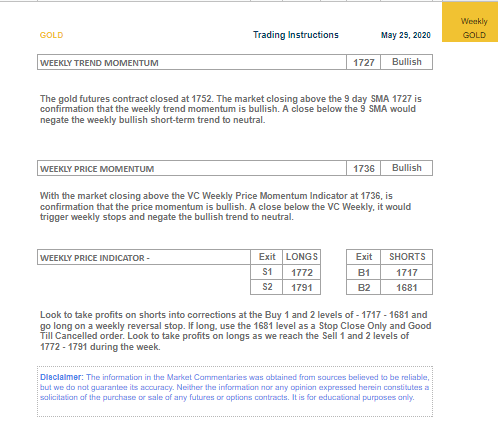
The weekly trend momentum is bullish. The weekly VC PMI of $1,736 is also bullish because the market closed above that. A close below $1,736 stop negates this bullishness, so that is the first level of protection you can use. If the market comes down below $1,736, it would activate a weekly bearish price momentum.
The market is trading around $1,745, which is an area of resistance. It did not reach the weekly target of $1,772. Take profits at $1,772 to $1,791, if you are long. It is still in the bullish bias until that $1,772 is activated.
The market closing above the 9-day moving average of $1,727 means that the trend is bullish. A close below that level would negate that bullish trend. The Sell 1 level is $1,772 to the Sell 2 level of $1,791.
If the market closes below $1,736, it negates the bullishness to neutral. Another close below activates the Buy 1 level of $1,717 to the Buy 2 of $1,681.
Gold: Monthly Data and Triggers
Summary
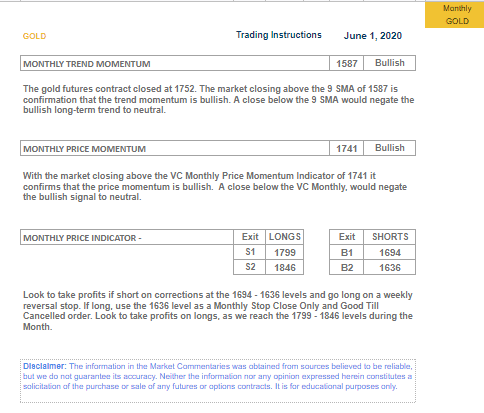
The monthly trend momentum of $1,587 is bullish.
The monthly VC PMI of $1,741 is bullish.
A close below $1,741 stop negates this bullishness to neutral.
If long, take profits $1,799-$1,846.
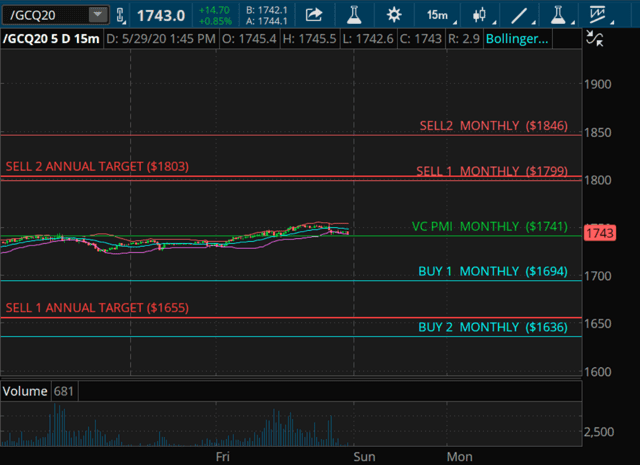
The monthly trend momentum of $1,587 is bullish. This is the 9-month moving average. The monthly VC PMI or average price is $1,741, which is bullish. You can use $1,741 as a stop level.
If the market closes below $1,741, it would negate the bullishness to neutral. If you are long, begin to take profits at the monthly Sell 1 level of $1,799 to the Sell 2 level of $1,846.
Gold: Annual Data and Triggers
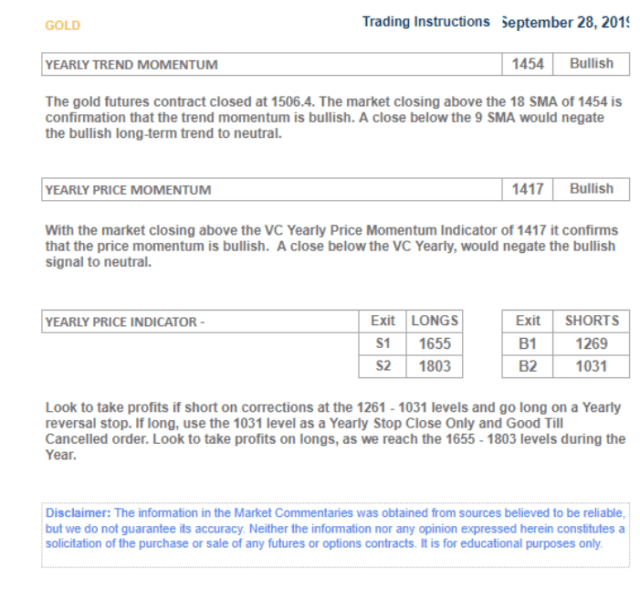
We published an annual report in September, when the market was at about $1,505. The report said that the Sell 1 level for the year is at $1,655 and the Sell 2 is at $1,803. We completed the initial target of $1,655 on February 21, 2020.
The market then met resistance. At that level, supply or sellers began to come into the market.
Around March 9 the market reached $1,694 and then the coronavirus hit and gold dropped to $1,454 based on the August contract.
In late March, buying came into the market on the basis of tight physical supplies. The spread between the spot and paper market spread, with a premium of about $80 for the spot market.
Gold then started its trend to trading as a currency. It almost reached the Sell 2 target of $1,803 reaching $1,788. The artificial intelligence of the VC PMI tells you that the higher a price goes, the higher the probability that supplies or sellers will come into the market.
The Sell 1 monthly target of $1,799 fits right into the monthly target of $1,803. When the monthly and annual targets align, it is a very powerful sign that the market will revert to the mean from that level.
Even if the market breaks into the higher levels, it is very likely to reach a ceiling right above those levels. You do not want to buy at those high levels, since you are likely to be buying into an overbought market. The best time to enter the market long is when the market is trading at an extreme below the mean, such as at $1,465 on March 20 after gold collapsed.
The VC PMI is contrarian, so when the market collapses, it advises to buy. When the market races up, it advises to sell. Now the market is having a problem making higher highs, right where the VC PMI is telling you to expect sellers to come into the market.
Fundamentals
Gold is becoming a currency, separating itself from the US dollar. The stock market also broke away from the US dollar.
It made a bottom at about the same time as gold. It is almost as if the market discounted any economic damage from the coronavirus very early.
The GDX (VanEck Vectors Gold Miners ETF) is up 53, while the gold market is down and most gold mining shares are trading higher. This is a bit of an anomaly.
It is a question of leadership, whether the gold mining shares are catching up to the price of gold or are they leading the way to a new bull market. This will happen in metals, where the paper market is the leading indicator depending on the availability of physical gold.
The paper market and physical market appear to have become disconnected, which is why the physical market went up about $80 over the futures because people could not get physical gold on the physical market. For a long time, institutions have sold short on the paper market, driving the physical price down and then they have closed out the short selling and made billions. They can no longer do that as demand for physical gold has greatly increased.
The stock market also appears to have been separated from the real economy. Even as the economy has collapsed, stocks have risen back to almost where they were before the pandemic.
Main Street is reeling and is in a depression, yet stocks are trading as if nothing has changed.
Even the protests and looting triggered by the horrible George Floyd incident have not caused the stock market to fall significantly. We have a pandemic on top of a broken system, yet the stock market continues to go up.
Stock prices do not appear to be correlated with the true state of the economy. Earnings reports are going to show declines of 50% or 60%, which should cause stocks to fall precipitously.
When investors realize the true state of the economy, money will flow into the precious metals.
That is why we are bullish on precious metals long term.
Gold appears to be consolidating in the area of $1,700 to $1,800. If gold can’t reach new highs, it indicates that the buying pressure is weak and there will be pressure to the downside. If we get down below $1,736, it will activate new short triggers. If you have profits, take them or protect them.
We use the 15-minute close for the daily, weekly, monthly or annual data to execute the signals.
Silver
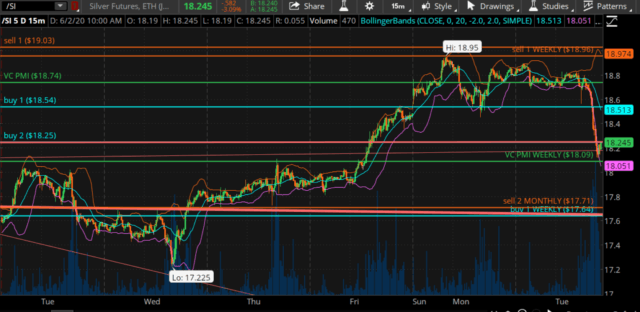
Silver is very much in the same area as gold, making a high of $18.95. It completed the weekly Sell 1 target of $18.86. Gold and silver are trading in areas where it is likely that sellers or supply will come into the market.
0 comments:
Publicar un comentario