Navigating The Conclusion Of This Economic Slowdown
by: Eric Basmajian
Summary
- A massive monetary deceleration started in late 2016, spreading to manufacturing, housing, and big-ticket consumption.
- A massive monetary deceleration started in late 2016, spreading to manufacturing, housing, and big-ticket consumption.
- The slowdown was of sufficient magnitude to impact services and employment growth.
- Global central banks flipped from tightening to easing which is aiding the housing sector.
- The ongoing employment slowdown poses a risk to an easing cycle that likely began too late.
Navigating The Conclusion Of This Economic Slowdown
Secular economic cycles, business cycles and the short-term 12-36 month growth rate cycle are all highly influential to asset prices depending on the time frame of the analysis.
The 30-year decline in sovereign bond yields can be largely attributed to a secular decline in the rate of population growth and productivity growth while "crashes" in the stock market tend to revolve around the realization or acceptance of a business cycle recession.
The growth rate cycle, the focus of this note, represents the 12-36 month fluctuations in the growth rate of the economy that occur within a business cycle.
Below we will take a deep dive into the sequence of growth rate cycles, the basis for leading economic indicators and the overlap between the growth rate cycle and the business cycle.
Economic cycles have a fairly predictable sequence that if followed correctly, can provide early warning signs of accelerations in broad economic growth or decelerations in closely followed coincident data.
By following the sequence of economic cycles and focusing most closely on the early movers of the cycle, a significant advantage is gained over analysts and investors that rely on the end of the sequence to provide color on the economy.
Central bank policy and monetary tightening/easing typically start the process. It is commonly reported that central bank policy works with long and variable lags. This is true. The problem, however, is that most analysis ends here and skips to the end of the sequence, or coincident data, overlooking the steps in between monetary action and coincident data.
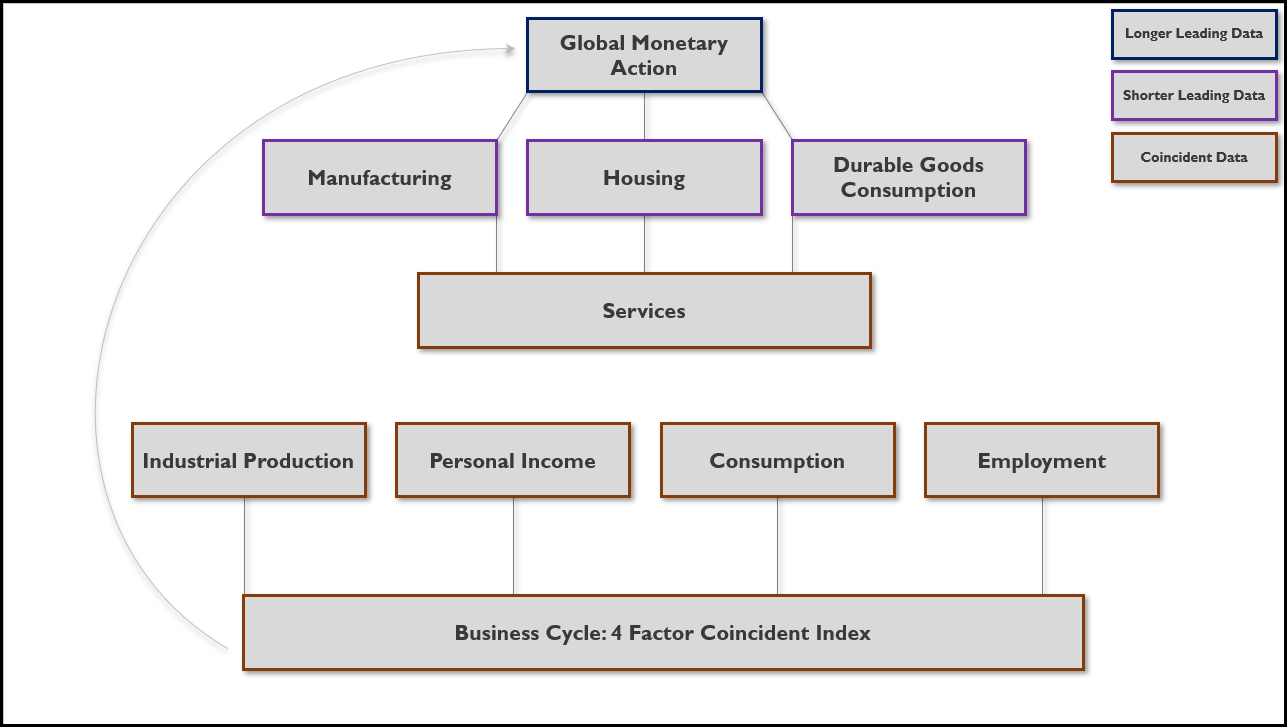
As the diagram below shows, after monetary action has rippled through various monetary aggregates, sectors of the economy that respond most quickly include manufacturing, housing, and durable goods consumption.
Growth Rate Cycle Sequence Overview:
 Source: EPB Macro Research
These sectors are early movers in the sequence, responding to changes in monetary policy (interest rates) because they are capital intensive industries, are highly cyclical and all have a heightened level of interest rate sensitivity.
After the monetary action flows through these early cyclical sectors, should the slowdown persist long enough and be of sufficient magnitude, changes in employment, income, and activity in these cyclical sectors flow through the less cyclical and less interest-rate sensitive service sector.
Lastly, the four coincident indicators that we all follow, industrial production, income, consumption, and total employment are impacted. These data points, when aggregated, provide a real-time gauge of the business cycle. This final stage is where the growth rate cycle (early cyclical sectors) and the business cycle (coincident data) overlap.
It is critical to hold these separate and at times opposing thoughts simultaneously.
With this sequence in mind, let's dive into the cycle and understand where we are today, what the risks are, and two possible ways to invest through the next several months.
Monetary Action
The current business cycle expansion that began in 2009 has come with 3 very distinct economic slowdowns (growth rate cycle) that can be closely tied to monetary action.
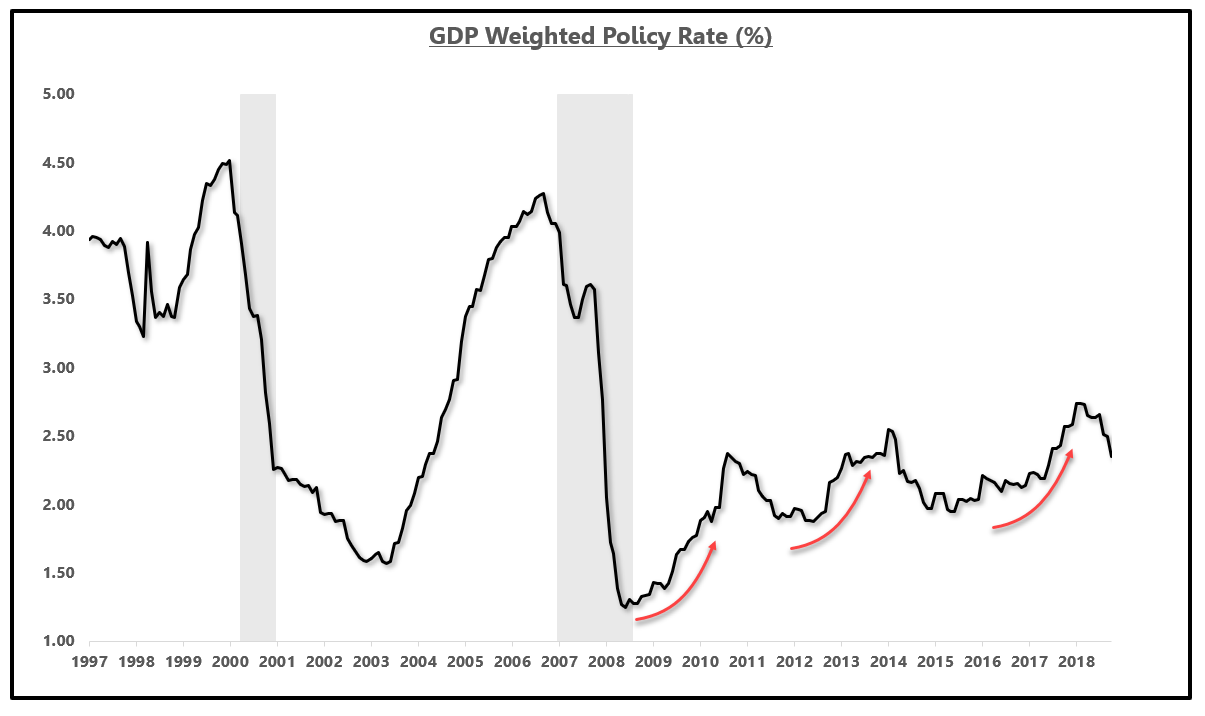
The chart below shows the GDP weighted global policy rate. In other words, an aggregation of all "fed funds rates," weighted by GDP.
As the chart shows, this cycle came with three attempts by central banks to tighten monetary policy.
When each tightening carried through the sequence described above, recession fears flared and central banks reversed course before the slowdown sufficiently impacted coincident data to be recessionary.
GDP Weighted Global Policy Rate:
 Source: Bloomberg, EPB Macro Research
Each tightening attempt translated to a deceleration in global money supply growth. The chart below shows the growth rate in the money supply for 27 countries, weighted by GDP.
If we look at the prior two recessions, we can see that global money supply growth, an early mover, troughed before or during the recession, responding to the change in monetary policy upon realization of the recessionary threat. In these two instances, monetary tightening was too aggressive or the Fed did not act in time to prevent a recession.
In each of the prior two recessions, before the recession was over, global money supply growth soared, an early indication a recovery was on the way.
GDP Weighted Global Money Supply Growth:
 Source: Bloomberg, EPB Macro Research
This stage is not the time to change portfolio positioning. We must see confirmation across short leading indicators in the next phase of the sequence.
Global money supply growth peaked at the end of 2016 before a massive monetary deceleration. The magnitude and severity of this current monetary deceleration was the first clue that the upcoming slowdown would be recessionary or near-recessionary.
By the middle of 2017, several months of monetary deceleration were clearly evident.
At this point, by the middle of 2017, understanding the global monetary tightening and the reaction in global money supply growth, the focus should be shifted to the early cyclical industries, most likely to be impacted by the change in policy impetus.
Cyclical Industries & Monetary Policy Impact
Starting with manufacturing, by the middle of 2017, we should have been on high alert for a change in trend.
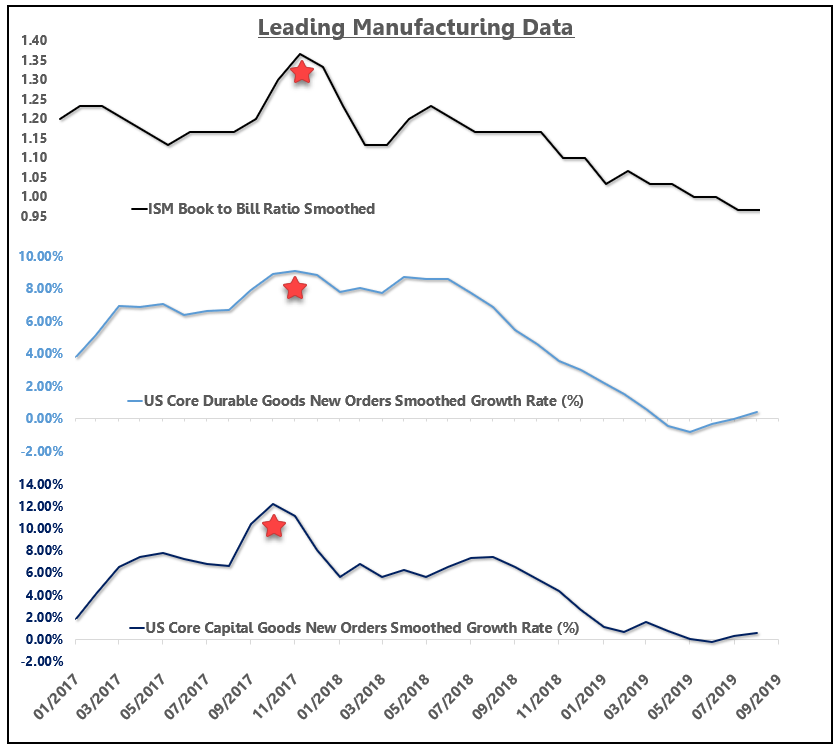
The three-pane chart below shows the ISM Book to Bill ratio, core durable goods new orders growth and core capital goods new orders growth.
These three indicators all provide a short lead time over industrial production growth.
Right on cue, short leading manufacturing indicators peaked in Q3 and Q4 of 2017.
By Q1 of 2018, a slowdown in long leading data was confirmed by short leading manufacturing data.
This slowdown was baked in the cake long before any discussion of a trade war or tariffs.
Analysts and pundits attributing a majority of the economic slowdown on the trade war ignore the typical sequence of economic cycles and discount the impact of a massive monetary deceleration that began as early as December 2016.
Manufacturing Sector:
Source: Bloomberg, EPB Macro Research
Similarly, at the end of 2017, the housing market experienced an undeniable correction.
Pending home sales declined 12% peak-to-trough and total building permits fell 11%.
Building permits in the West, perhaps compounded by tax changes, plunged 17%.
In response to higher interest rates and tighter lending standards caused by monetary tightening, the housing sector corrected as expected.
Furthermore, it should be noted that from November 2017 through January 2019, the median sales price of a newly constructed home fell 11%.
Housing Sector:

Source: Bloomberg, EPB Macro Research
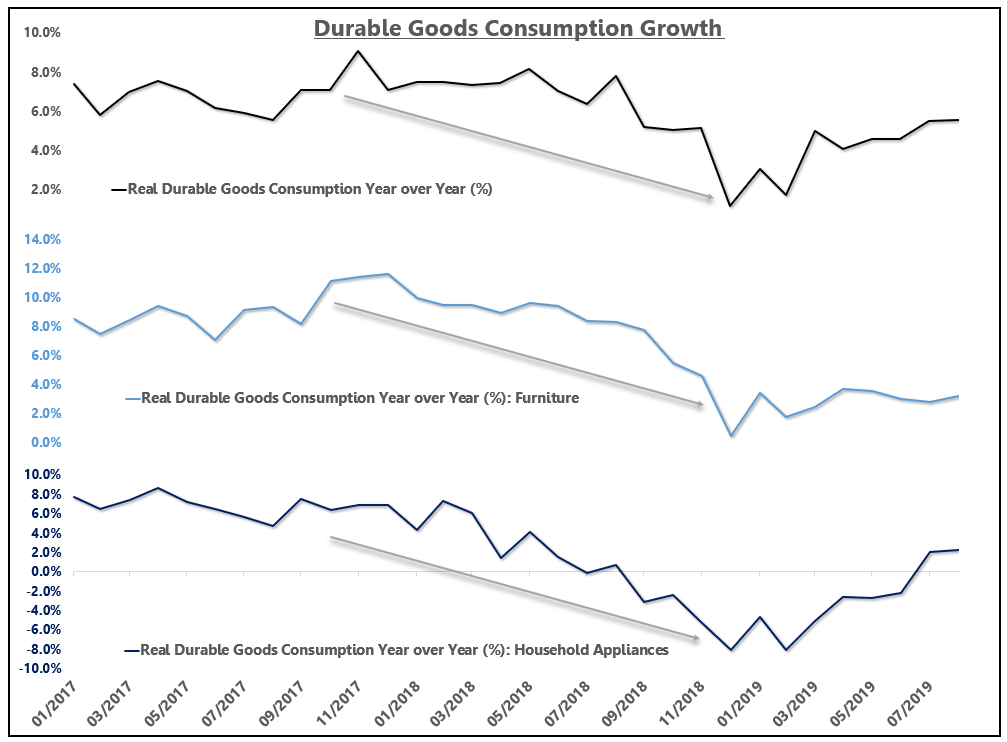
Durable goods consumption growth, which includes motor vehicles, home appliances, and furniture, all peaked at the end of 2017 in response to higher interest rates and tighter financial conditions.
Durable Goods Consumption Sector:
Source: Bloomberg, EPB Macro Research
Considering the classic economic sequence, by the start of 2018, a major monetary deceleration spread through all three cyclical sectors we'd first expect to see a change in conditions.
Attributing the current economic slowdown solely to the trade war is empirically misguided.
Not many analysts of the business cycle would argue that causing supply chain disruptions and denting confidence was a helpful policy in regards to economic growth. However, the prevailing wisdom that suggests fixing the trade war will solve the slowdown in growth overlooks the real cause of the economic deceleration that started over two years ago.
Summary Of The Growth Rate Cycle
To summarize the sequence above, starting in late 2016, a major monetary deceleration began which spread through the manufacturing, housing, and durable goods consumption sector. This slowdown was large enough and lasted long enough to impact services and all four critical areas of the business cycle, including employment growth.
Global central banks are now in a race to ease conditions and spark a recovery in the cyclical industries shedding jobs (manufacturing) before the decline in employment growth starts the vicious cycle of lower income growth, consumption growth, and employment growth.
0 comments:
Publicar un comentario