I'm Still Loading Up On Gold And Gold Stocks. Here's Why
by: Lyn Alden Schwartzer
Summary
- People have worried about federal deficits for decades, but recent catalysts are making the problem more acute.
- Domestic institutions are being fed excess government debt, and it's becoming an increasingly acute liquidity problema.
- Two potential outcomes analyzed.
I've written a couple articles this year here on Seeking Alpha about why, in addition to investing in a variety of normal equities, I began allocating a portion of my portfolio into gold and gold stocks starting in the autumn of 2018.
And in my most recent article, Recession Obsession, I examined how these gold stocks have been the best-performing asset class within my portfolio since they were added, with some ups and downs along the way.
During the past couple months, after the quick rise of gold and the rather meteoric rise of high-quality gold stocks (many of them up 30-50% or more within the year), I have naturally started to receive emails about whether I think precious metals are still worth having exposure to.
My short answer is yes, I'm still buying gold stocks for multi-year exposure. I'm a bit more cautious at these levels than I was earlier this year, focusing on dip-buying and dollar-cost averaging, but I still think we are well within the bounds of an attractive risk/reward profile for long-term investors. We could easily see further dips and corrections, but I would be a buyer of those.
However, I'm also long cash and cash-equivalents like very short-term T-bills, but I don't have any exposure to long-term Treasury notes or bonds. There are two potential outcomes that I see as coming down the path, and this cash/gold split prepares for both.
Updated Gold Charts
Back in February, I wrote an article here about how I approach the topic of gold valuation. As many people readily point out, gold doesn't produce cash flows, so in order to have a frame of reference for what it's worth, it helps to understand the main demand drivers.
Gold often gets confused as an inflation hedge, an inversely-correlated asset, or other things, but the price history is a bit more nuanced than that.
First of all, over very long periods of time, the gold price generally keeps up with the growth rate of money supply per-capita, because the amount of gold per person is relatively fixed while the number of dollars per person in existence keeps growing. This growth of the money supply per-capita is what some might call the "real" inflation rate, although a lot of this money just trickles into financial assets (including gold) and luxury items rather than everyday consumer prices.
The following chart shows the price of an ounce of gold (blue line) relative to the growth of broad money supply per-capita (red line) in the United States, indexed to 100 in 1973:
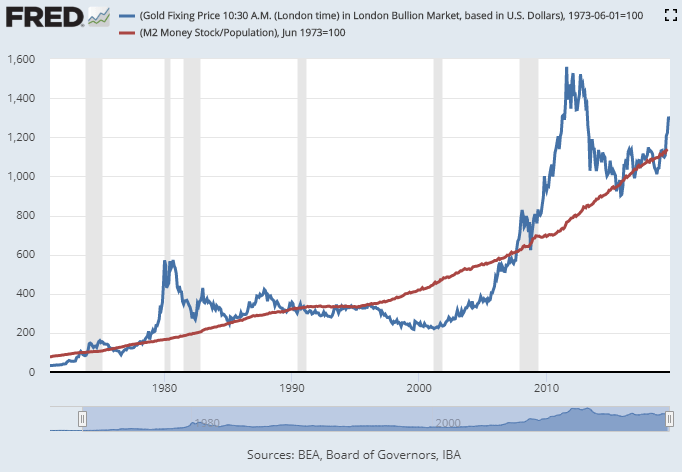 Chart Source: St. Louis Fed
You can see that in 1980 and 2011, gold hit extreme highs. These occurred during periods of negative real interest rates and unusual monetary policy. In 1980, the country had only been off its gold standard for 9 years and was suffering from double-digit consumer price inflation, so people reached toward precious metals. In 2011, the country was recovering from the subprime mortgage crisis, the European sovereign debt crisis was reaching its peak, and the Fed was performing quantitative easing which people feared would lead to inflation, so again they reached toward precious metals.
On the other hand, during the 1990's and early 2000's, gold went below its long-term trend line.
This was during a period of rapid GDP growth and high real interest rates, which means bonds and banks paid you a high real rate of return for saving in them, which makes holding gold less attractive as a store of value.
This second chart outlines more clearly the inverse relationship that the year-over-year change in the gold price has with real 10-year treasury rates (10-year yields minus inflation):
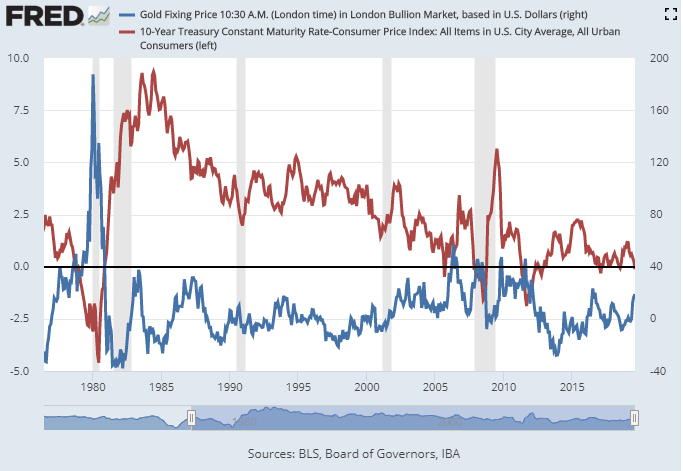 Chart Source: St. Louis Fed
Gold is a dense long-lasting store of value (a currency, essentially) that roughly keeps up with monetary inflation (which is different than, and usually faster-growing than, consumer price inflation). Since gold's main competition are cash and bonds, gold tends to lag this trend a bit when real interest rates are high, because the opportunity cost of holding gold is high. In contrast, gold tends to go up faster than the trend when real interest rates become low or negative, or when investors anticipate that weird monetary policy is happening, because the opportunity cost for holding gold goes away, and the safety of holding cash or bonds starts to receive some skepticism.
Currently, gold is a bit above its trend compared to money supply growth since 1973, but only by a marginal amount, and this is a rough measure to begin with. I mainly watch for big deviations from the trend rather than worrying about little deviations. In a world with negative nominal bonds, negative real interest rates, and continued quantitative easing out of Europe and Japan, I consider this mild premium to be justified.
Gold is certainly vulnerable to pullbacks at this price level, and could retest support in the upper-$1,300's per ounce, but I'll leave those details to the technical analysts. As a long-term investor, I'm a gradual buyer at current prices of gold, silver, gold royalty and streaming companies, and to a small extent, gold miners. But I also have some cash in case I get a chance to buy it (or other asset classes) materially lower.
It's becoming more likely that the Fed will need another round of quantitative easing, perhaps in 2020, but for somewhat different reasons than the previous three rounds. I consider this an intermediate and long-term catalyst for gold.
Deficits Don't Matter, Until They Do
People have been worried for decades about U.S. federal debt and deficits. When debt was 40% of GDP they worried, then when it was 80% of GDP they worried, etc. But the sky never fell, even decades later. Now it's over 105%.
Deficit hawks have become the people that "cried wolf", because the more that people call out the growing U.S. government debt without it causing any acute problems, the less credibility those concerns will be given over time. It's always something that is considered a distant future problem rather than a practical issue that we can make or lose money from.
But let's focus on a specific issue that is more intermediate-term in nature.
Due to tax cuts and other factors, U.S. deficits as a percentage of GDP have accelerated in recent years after a period of reduction:
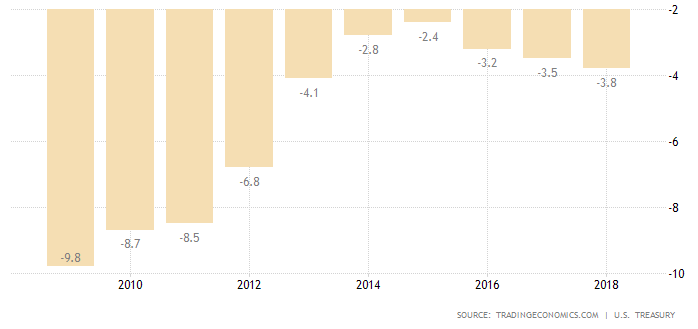 Chart Source: Trading Economics
In 2019, the $1 trillion deficit is in the ballpark of 4.5% of GDP, even though we're over 10 years into an economic expansion. These deficits are projected to keep growing by the CBO and others, even without a recession in the forecast. A recession would result in decreased tax revenue and increased spending, which would further widen the deficit beyond the baseline forecast. And so far, the deficits have been coming in a bit bigger than the CBO has been forecasting.
As this chart from Goldman Sachs shows, the United States currently has an increasing federal budget deficit during a period of low unemployment and strong economic growth outside of wartime, which is a major deviation from 70 years of U.S. fiscal policy:
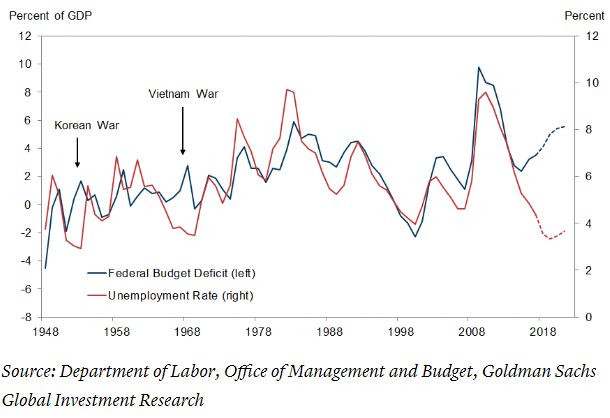
Chart Source: Goldman Sachs, Retrieved from CNBC
So, this time it is a bit different, and the question is, who is buying all of this extra debt, and at zero real rates?
From the early 2000's until 2015, the U.S. government was reliant on more and more foreign funding.
However, foreign buying of U.S. government debt has leveled off since 2015, and only mildly ticked up in 2019. Around the same time just before 2015, the Federal Reserve ended its last round of quantitative easing, and stopped buying government debt as well.
So, during the past four and a half years, domestic investors (mostly banks, insurers, and pension funds) have been soaking up all of the U.S. debt growth, alone.
This chart shows the federal debt held by domestic institutions/investors (blue line), the Federal Reserve (red line), and foreign sources (green line). I marked the start of 2015 for emphasis:
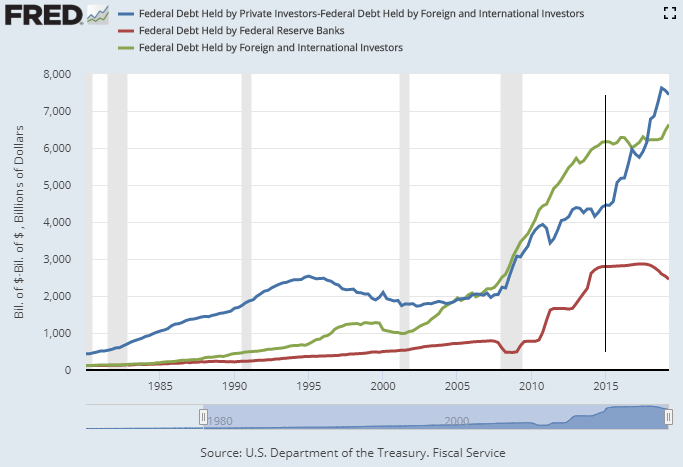 Chart Source: St. Louis Fed
Since 2015, private U.S. institutions and other domestic investors bought the vast majority of all new debt, and went from holding $4.4 trillion in U.S. debt to $7.4 trillion. They've soaked up $3 trillion in Treasuries in less than five years, and now are being fed another $1 trillion+ per year going forward, so the problem is accelerating. There have already been a number of messy bond auctions this year where demand was weak, and at this point, it's like trying to clean up a puddle with a sponge that is increasingly becoming too saturated to soak up any more.
This summer, there was a bit of a reprieve due to the government running up against the debt ceiling.
The government juggled their books and drew down their cash reserves to low levels rather than issuing new debt for a time, out of necessity. But now that period is over.
During the second half of 2019, the government expects to issue more than $800 billion in debt, which is a bit more than normal for the period because they are in the process of re-filling their depleted cash reserves in addition to funding the normal course of government. They've already issued part of this but still have the majority to go.
This is causing a liquidity problem. Dollars are being soaked up and replaced by Treasuries on bank books. Overnight repo rates have had occasional higher-than-normal spikes lately, including today, when the liquidity shortage temporarily became very acute due to timing issues. There's only so much debt that they can hold, and debt is growing faster than GDP.
The current rate of domestic institutions sucking up Treasuries is becoming unsustainable for them.
Most likely the Fed is going to have to restart quantitative easing, perhaps in 2020 or so, to prevent a more serious liquidity problem. The precise timing is anyone's guess. It could happen as early as the end of 2019, or maybe they can push it into 2021. The market is very focused on quarter-point or half-point rate cut questions but the bigger question in my view is when the Fed will be forced to restart quantitative easing due to domestic debt saturation.
But What About Japan?
Japan has a higher debt-to-GDP ratio than any other country, at well over 200%. This has pushed the boundaries for how much debt a country can seemingly have before it runs into problems, especially for countries that control their own currencies (unlike Greece, Italy, and so forth). When discussing the problem of growing U.S. debt as a percentage of GDP, people often point to Japan as an example of how far it can go.
However, Japan has a few key differences that make it able to sustain a higher debt load. First of all, their central bank is already monetizing their debt with indefinite quantitative easing.
The Bank of Japan's balance sheet is larger than the nation's GDP (compared to less than 20% of U.S. GDP for the Fed's balance sheet). If the BOJ wasn't doing that, their system would be running into similar liquidity problems because their domestic institutions would be unable to soak it all up.
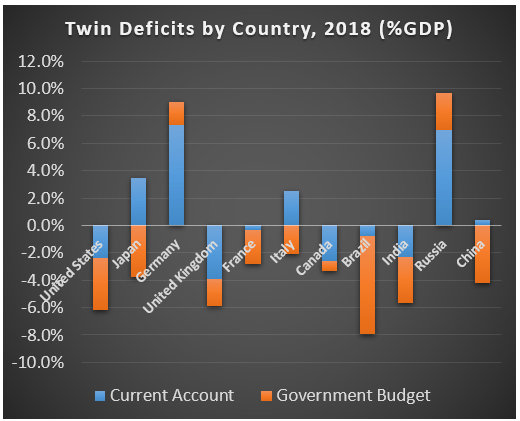
One would assume that this huge level of quantitative easing should weaken the yen, but there are other factors helping to hold it up. In particular, Japan has current account surpluses in most years while the U.S. has a structural current account déficit:
 Data Source: Trading Economics
The Eurozone, despite its many problems, currently has small fiscal deficits and a positive current account. Japan has big fiscal deficits but a positive current account. All of the places that have negative-yielding debt have roughly balanced or positive current account surpluses, unlike the United States.
The United States and the United Kingdom are deep in the red in terms of both fiscal deficits and current accounts, and have the biggest twin deficits as a percentage of GDP among the G7.
Due to decades of current account deficits, the United States has a net international investment position in the ballpark of -50% of GDP:
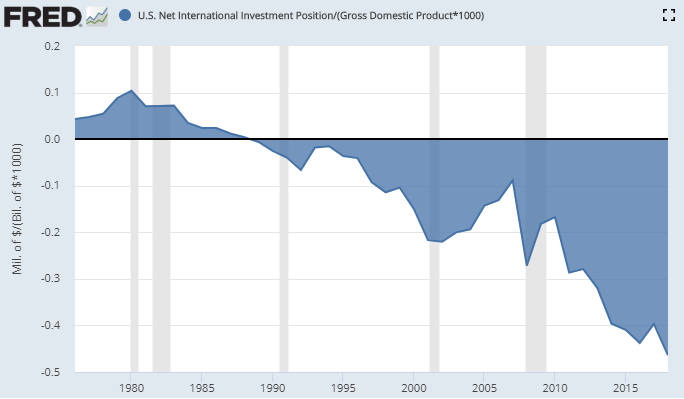 Chart Source: St. Louis Fed
Japan's net international investment position, in comparison, is positive and more than 60% of their GDP.
In addition, the U.S. dollar is already the second strongest currency in the world after Switzerland based on purchasing power parity according to the semi-useful and semi-comical Economist Big Mac Index:
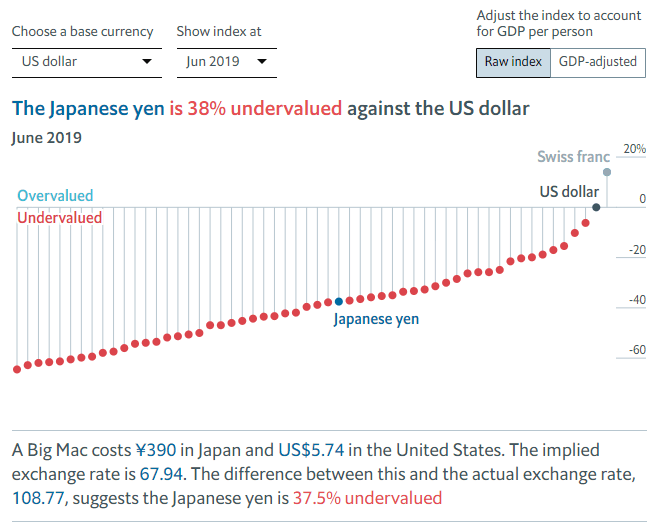 Chart Source: The Economist
Based on that index, the yen is already 38% undervalued compared to the U.S. dollar, or just 25% undervalued when adjusted for GDP per-capita differences.
Another way to visualize it is to look at nominal U.S. GDP as a percentage of world GDP in both nominal and purchasing power parity terms over the past three decades:
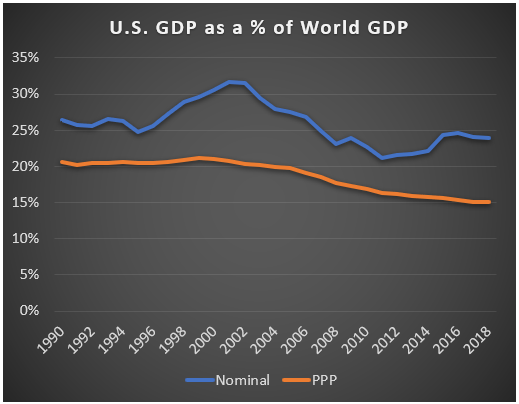 Data Source: World Bank
The purchasing power figure as a percentage of GDP (orange line) is a representation of how much goods and services the U.S. produces as a percentage of the world's total goods and services. We've gradually dropped from 21% to 15% of the world's total over the past two decades because although we're growing, the rest of the world has been growing faster on average (due to certain emerging markets, rather than Japan or western Europe). The United States has less than 5% of the world's population, so 15% of world PPP GDP is still pretty good.
The nominal figure is how it translates into U.S. dollars, which means during periods where the dollar is strong against other currencies, the gap between our nominal GDP and PPP GDP widens. Right now, with 24% of the world's nominal GDP, we're in the middle of one of those periods of notable dollar strength, in part because there's a dollar liquidity shortage.
If the ratio of U.S. nominal GDP vs PPP GDP as a percentage of the world's total were to normalize to 2012 or 2013 figures, as an example, it would mean a dollar devaluation in the ballpark of 20% or more.
For the past few years, since early 2015 (after the final round of quantitative easing ended), the dollar has been on the strong side of its long-term declining trend:
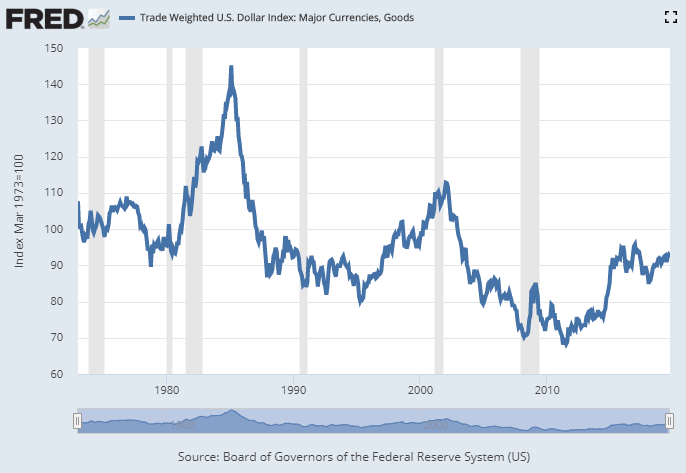 Chart Source: St. Louis Fed
If the Fed resumes monetizing debt like Europe and Japan are already doing, the U.S. has more room to devalue its currency. In addition to the dollar already being relatively strong at the moment, the Fed has positive interest rates and owns a smaller percentage of sovereign debt (under 20%) than either the ECB (about 35%) or BOJ (over 100%). The Fed has more ammo in a currency war, in other words. Unfortunately, all ammo in this war hurts the user as well.
It's an If/Else Problem
Investors often run into trouble when they try to time things perfectly, or think they can accurately predict exactly how things will play out.
I can't tell you exactly how this domestic deficit saturation problem will play out, but I see two outcomes that are high on the list of likely occurrences in my opinion. It's almost an if/else problem due to mathematical inevitability, but there's always a big degree of wiggle-room around the timing.
Outcome 1) The Fed does nothing for a while.
If there is no new round of quantitative easing in the coming year or two, we're likely to really start pushing the limits of how much U.S. debt domestic institutions can stuff onto their balance sheets, to the tune of about $1 trillion per year.
A number of Treasury auctions have already gone poorly this year. This chart from Bloomberg a couple months ago shows a snippet of the problema:
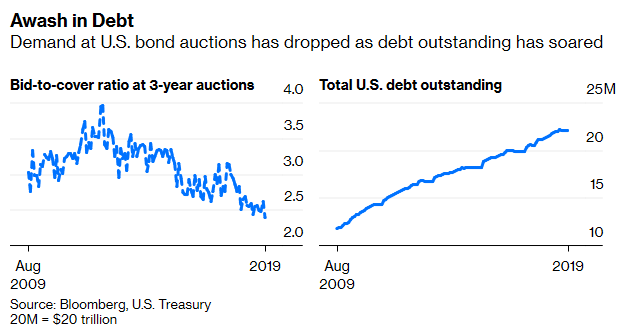
Chart Source: Bloomberg
Investors submitted bids for 2.39 times the $38 billion of three-year notes offered by the Treasury Department on Tuesday, the smallest so-called bid-to-cover ratio for that maturity in a decade. This is no anomaly. In May, the bid-to-cover ratio at a 10-year auction was also the lowest in a decade.
-Robert Burgess, Bloomberg
If bond auctions keep getting weaker, this could put upward pressure on long-term rates (TLT). It's a cyclical reality that during economic slowdowns, bond yields generally go down, but in this case the cyclical trend may be running up against a secular trend in the opposite direction.
Either way, this outcome would continue to tighten the dollar liquidity problem and could push dollar strength (UUP) higher for a time. This would hurt the competitiveness of U.S. exports, and put more and more strain on the U.S. financial system. Emerging markets (EEM), especially ones like Argentina (ARGT) that have a significant amount of dollar-denominated debt, would be further pressured. Places like Russia (RSX) and Thailand (THD) are more fortified against this due to positive current account balances and large foreign-exchange reserves.
Gold (GLD) might temporarily dip against the dollar in this tightening scenario, unless it causes enough problems worldwide that the fear/volatility trade pushes gold up. Hard to say.
We would likely see greater volatility, and more likely to the downside, in U.S. equities (SPY).
Cash and cash-equivalents would be a good form of defense for this outcome, but ultimately this outcome is unsustainable and ends with the Fed forced to be a buyer of last resort.
Outcome 2) Fed restarts quantitative easing.
If the Fed finds itself forced to step up and start buying bonds to relieve the liquidity shortage from domestic institutions, they could drive bond yields lower, at least for some time.
This might or might not give U.S. equities a temporary boost upward, depending on what else is going on. The dollar would likely weaken, which could relieve some pressure from emerging markets and boost foreign stocks in general in dollar terms. The asset class I'd most want to own under this outcome is precious metals. I'd also want to own gold stocks, with one of my favorites being Sandstorm Gold (SAND).
It seems mathematically inevitable that both outcomes lead to this one eventually, but it's a question of timing. Will the Fed jump in before the problem gets too messy, or will they wait until they are absolutely forced to? I don't know.
I'm holding a cash/gold barbell as a defensive slot in my globally-diversified multi-asset portfolio so that as the outcomes play out, I can rebalance towards areas of weakness as they come.
Either way, I suggest keeping an eye on government bond auctions and domestic liquidity during the remainder of this year and into the next. It's starting to get interesting.
0 comments:
Publicar un comentario