Open Interest In Gold Falls - A Possible Sign That A Bottom Is Near
by: Andrew Hecht
Summary
- Gold falls to the lowest level of 2019.
- Open interest tells us about herd behavior.
- Gold open interest rose with the price and fell with the price.
- The long-term trend in gold is bullish in all currencies, but the dollar is currently pushing the price lower.
- A higher low is in the cards for the yellow metal - a golden opportunity to buy gold mining stocks.
Since attempting to stage a recovery and rising to a high at $1314.70 on the June COMEX futures contract on April 10, the price of gold has moved lower and below the $1300 level. The last time the yellow metal was over $1300 was on April 11, and after falling to a low at $1267.90 on April 23, June futures were at the $1279 level on Wednesday, April 24, not far off the recent low.
Gold is a metal that tends to move higher during periods of uncertainty, and lower when market participants are feeling good about other asset classes. The recent rebound in the stock market that put the leading indices above their 2018 peaks has taken some of the shine off of the price of gold. At the same time, higher interest rates in the US, and a dollar that is sitting just below its mid-December high on the dollar index have weighed on the price of the precious metal.
I have been trading in the gold market since 1981. In the late 1980s and 1990s, I ran one of the world's leading precious metals businesses with offices in New York, London, Hong Kong, and other cities in Asia. Even though the price of gold traded at a much lower price level in those days, one thing has remained the same. When gold looks its best, it is usually time to sell, and when it looks like it is going to explode to the upside, it is typically a great time to sell.
The most direct route for a trade or investment position in the gold market is via the physical bars and coins available from dealers around the world. The allocated and unallocated gold market in London is the most liquid physical choice which attracts the world's producers, consumers, central banks, governments, and monetary authorities who buy and sell the yellow metal in significant quantities.
The COMEX division of the CME offers futures and futures options in gold with a physical delivery mechanism. The ability to make or take delivery of gold bars allows for the smooth convergence between the prices of the futures and physical during delivery periods. Many ETF and ETN products that are both unleveraged and leverages do an excellent job replication the price of the yellow metal. Shares in gold mining stocks typically act as leveraged tools in the gold market as the share prices often outperform the price action in gold on the upside and underperform on the downside.
Each mining company has idiosyncratic risks such as their management and the locations of mines around the world. Aside from the political risk of producing gold in a myriad of countries, mining companies also run the risk of property specific issues such as floods in mines, inconsistencies between proven and probable reserves and output, and others. A bundle or diversified portfolio of mining stocks can mitigate some of the idiosyncratic risks, and the VanEck Vectors Gold Miners ETF product (GDX) or the VanEck Vectors Junior Gold Miners ETF product (GDXJ) tend to provide leveraged returns in a rising and falling gold market. As they hold a portfolio of mining shares, the products temper some of the risks when it comes to holding a position in a specific mining company.
Gold falls to the lowest level of 2019
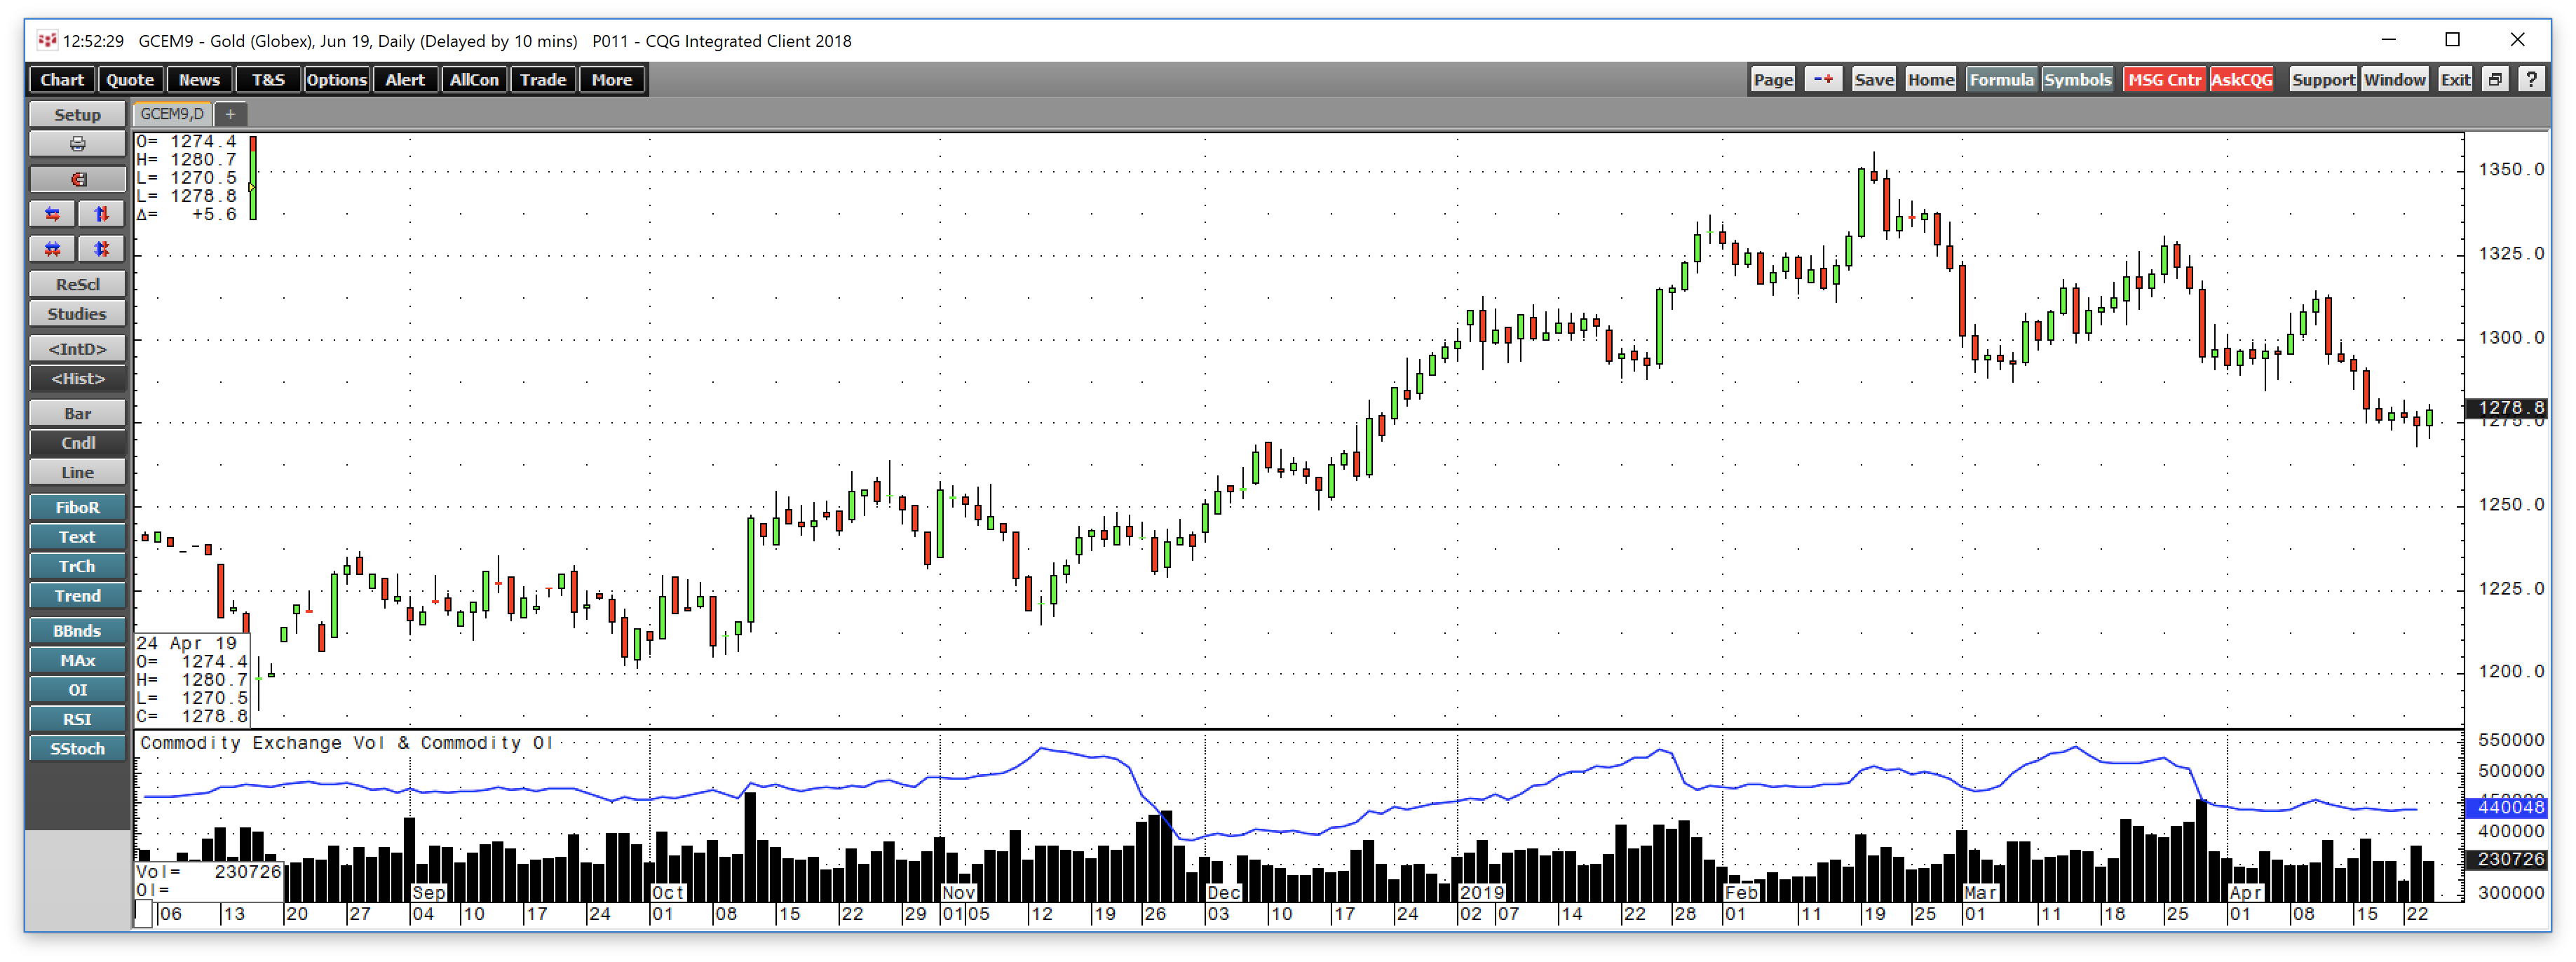
Gold continued to fall to new lows for 2019 on Tuesday, April 23 when the price reached $1267.90 per ounce on the nearby June COMEX futures contract.

Source: CQG
As the daily chart shows, gold looks awful as it has made a new low for 2019 over the past four out of six trading sessions. On April 23, the yellow metal fell to its lowest level since December 20 on the June contract. The next level of technical support is at the December 19 low at $1249 per ounce.
Open interest tells us about herd behavior
Open interest is the total number of open long and short positions in a futures market. The metric tends to rise when trends develop and fall when speculators and investors exit risk positions. In the world of precious metals where sentiment is a primary force that drives prices, open interest can be an effective indicator of what market participants are doing. With the price of gold falling, the metric is telling us that they have moved to other markets that offer more opportunity since March.
Source: CQG
The daily chart with volume and open interest metrics show that after rising to a high at 541,737 contracts on March 14, the metric declined to 440,048 contracts on April 23, a drop of 101,689 contracts or just under 19%. Gold rose to a high at $1330.80 on March 25 and fell to $1267.90 on April 23, which was $62.90 or 4.7% lower.
As the price of gold, the open interest metric is at its lowest level of 2019 and has not been this low since late December of last year. Falling price and declining open interest is typically not a validation of an emerging bearish trend in a futures market.
Gold open interest rose with the price and fell with the Price
The open interest metric displays a pattern of rising with the price of gold and falling during corrective periods. Market participants tend to hop on board of the gold market when the price is appreciating and jump off when the price moves to the downside. From late November 2018 through late January when gold was moving to the upside, the metric rose from 390,899 to 537,605 contracts.
Open interest remained between 470,000 and 541,737 contracts until late March, but the move to new lows for this year in April drove the metric lower. The falling open interest metric may not validate a continuation of lower lows in gold because the decline could mean that the futures market is coming close to a level where it will run out of selling.
Early in my career, a boss who ran the precious metals trading business for a leading world trading company told me that gold and silver move higher when there are more buyers than sellers and lower when sellers outnumber buyers. At the time, the lesson seemed almost too simplistic, but what he was attempting to convey was that the two precious metals move on sentiment and herd behavior is the primary force when it comes to trends. While the metric can continue to decline with the price, at under 400,000 contracts, a bottom could be in the cards for the yellow metal on a short to medium-term basis.
The long-term trend in gold is bullish in all currencies, but the dollar is currently pushing the price lower
The latest correction in the gold market is coming as the yellow metal is taking cues from the dollar index which has risen back over the 97 level as of April 24.
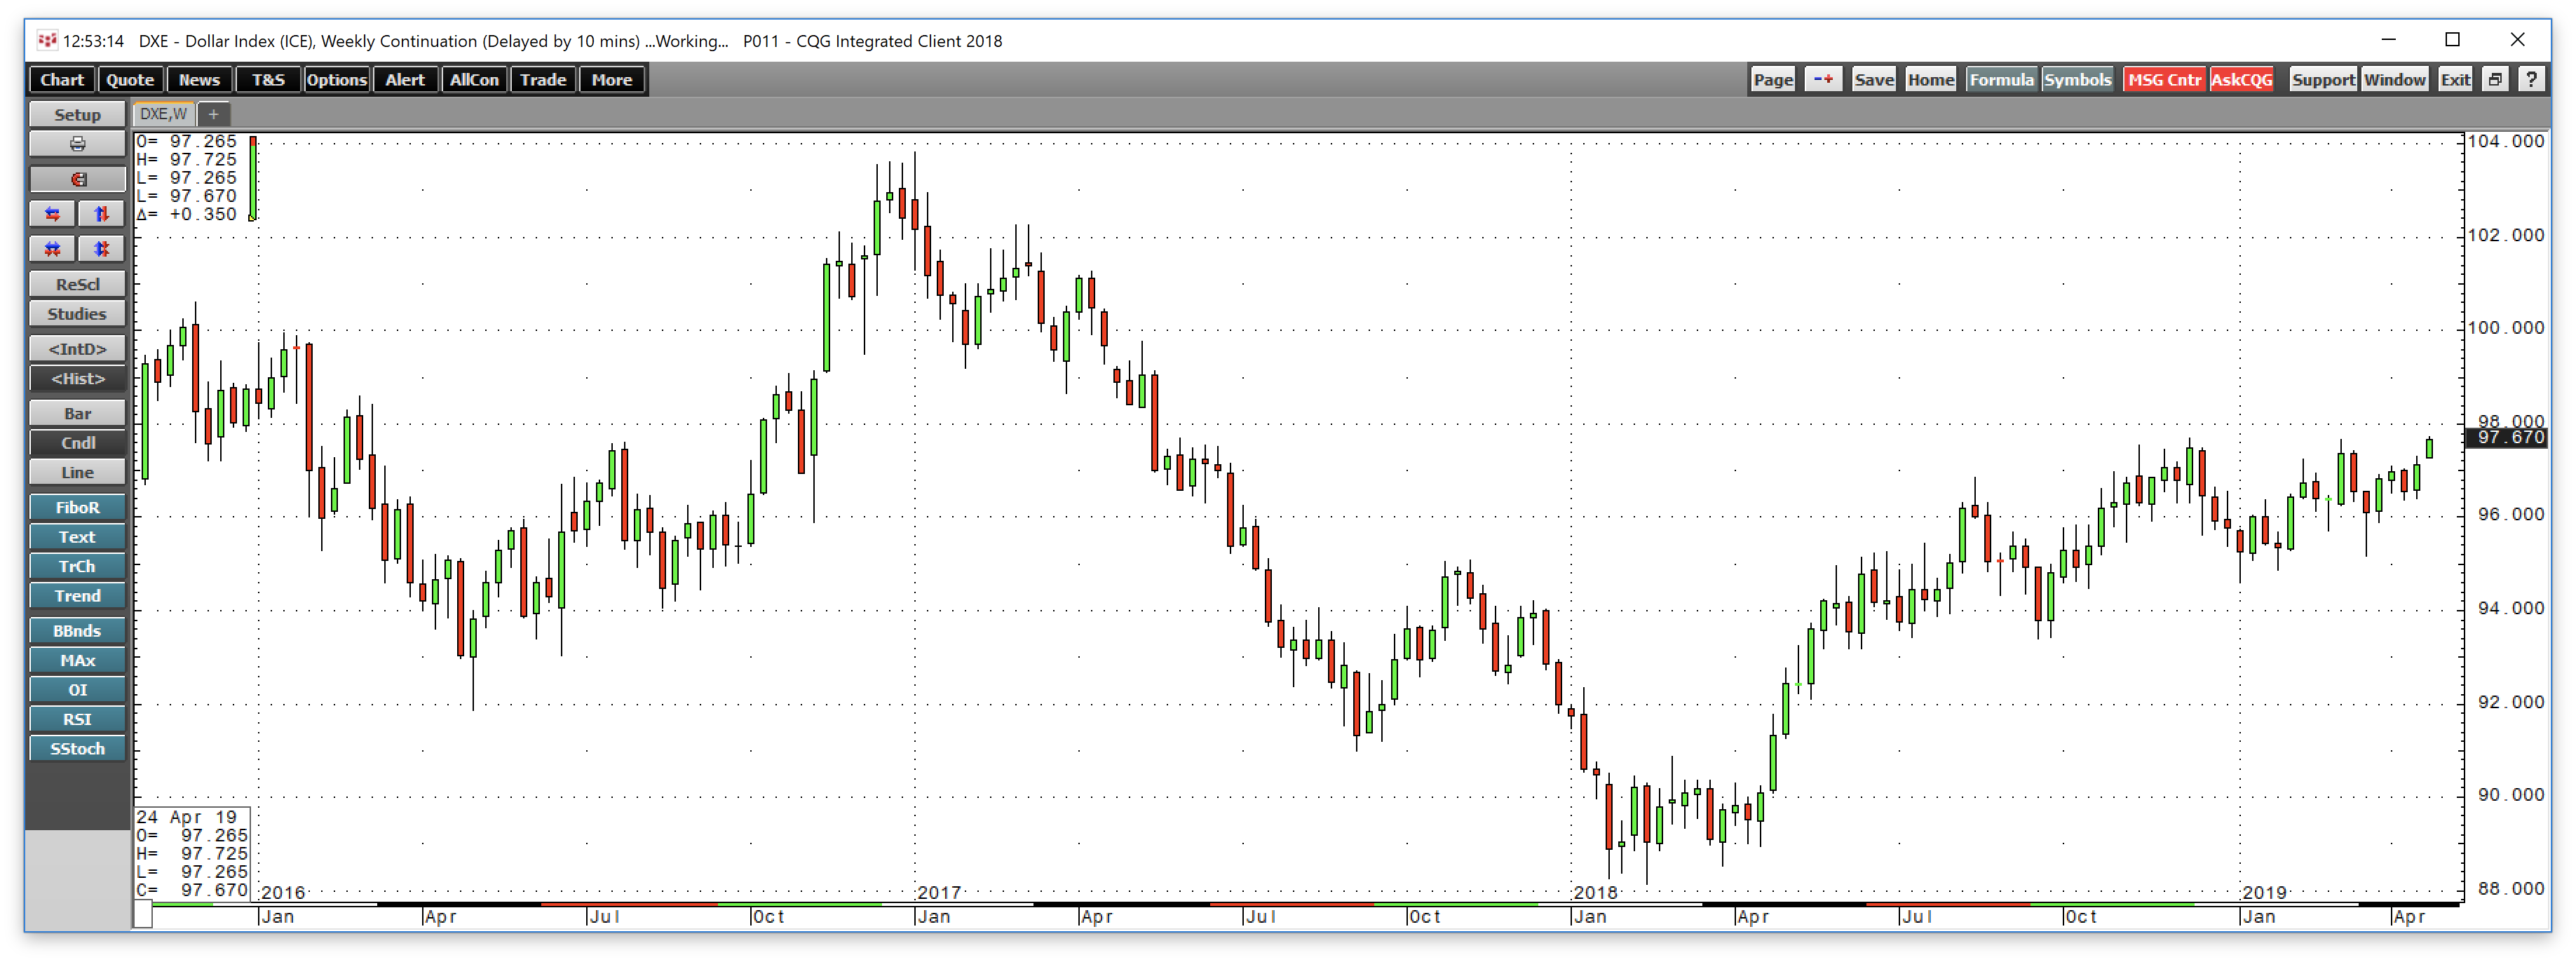
Source: CQG
As the weekly chart of the dollar index futures contract shows, the critical level on the upside for the dollar is at the mid-December 2018 peak at 97.705. Since then, the dollar has made multiple attempts to climb to a new high, but on each occasion, it failed. At 97.670 on April 24, another attempt to conquer the resistance level is currently underway. The inverse historical relationship between the dollar and the price of gold is currently weighing on the price of the precious metal as it is at the lows of 2019. However, a look at longer-term charts of gold in dollar terms and gold in the other leading reserve currencies of the world shows that the trend for at least a decade is higher.
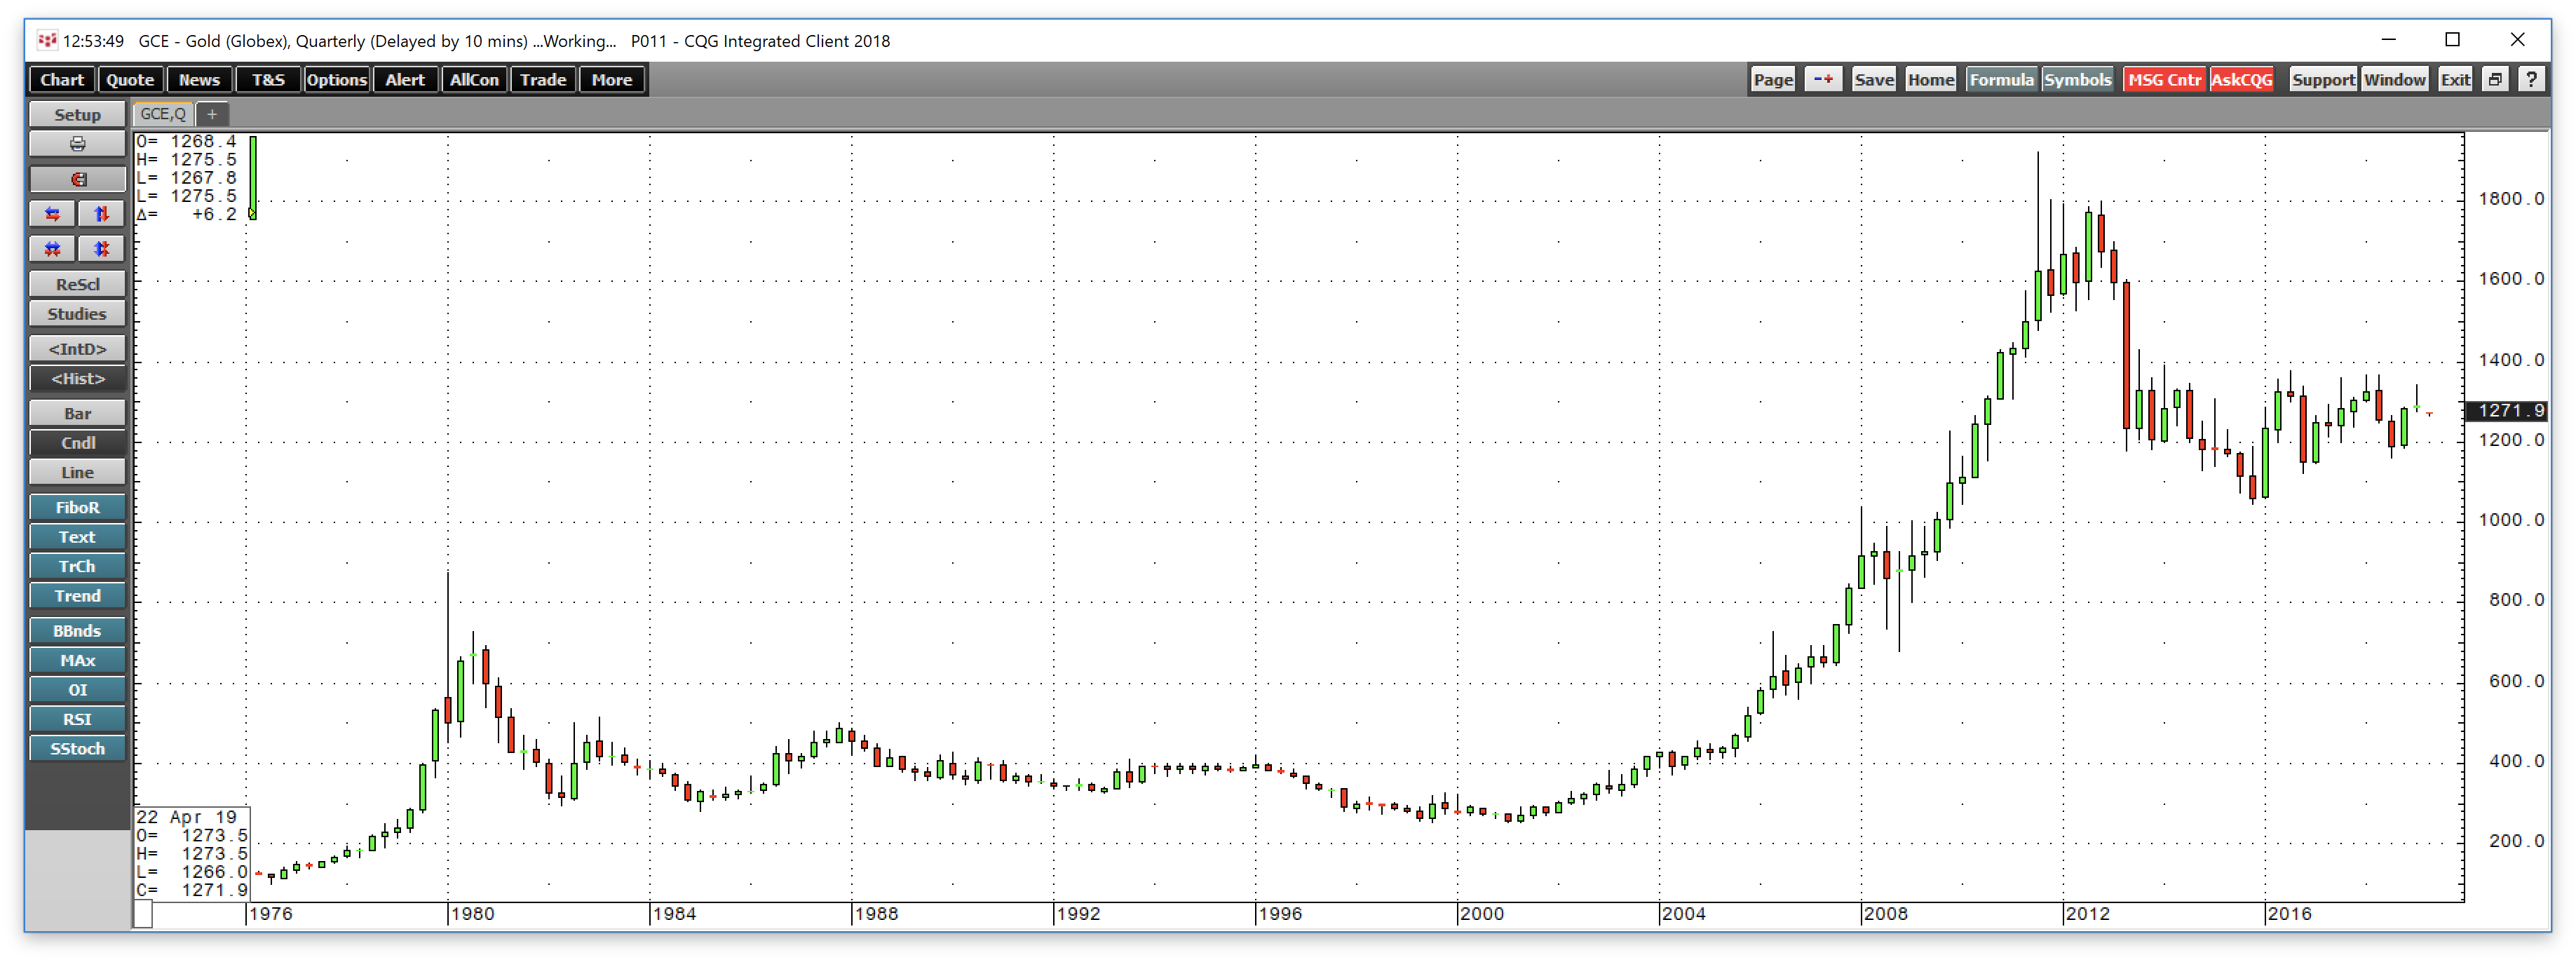
Source: CQG
The quarterly chart of gold in dollar terms displays a bullish trend that has been in place since the price reached a low at $252.50 per ounce in 1999 when the Bank of England decided to liquidate half of their reserves.
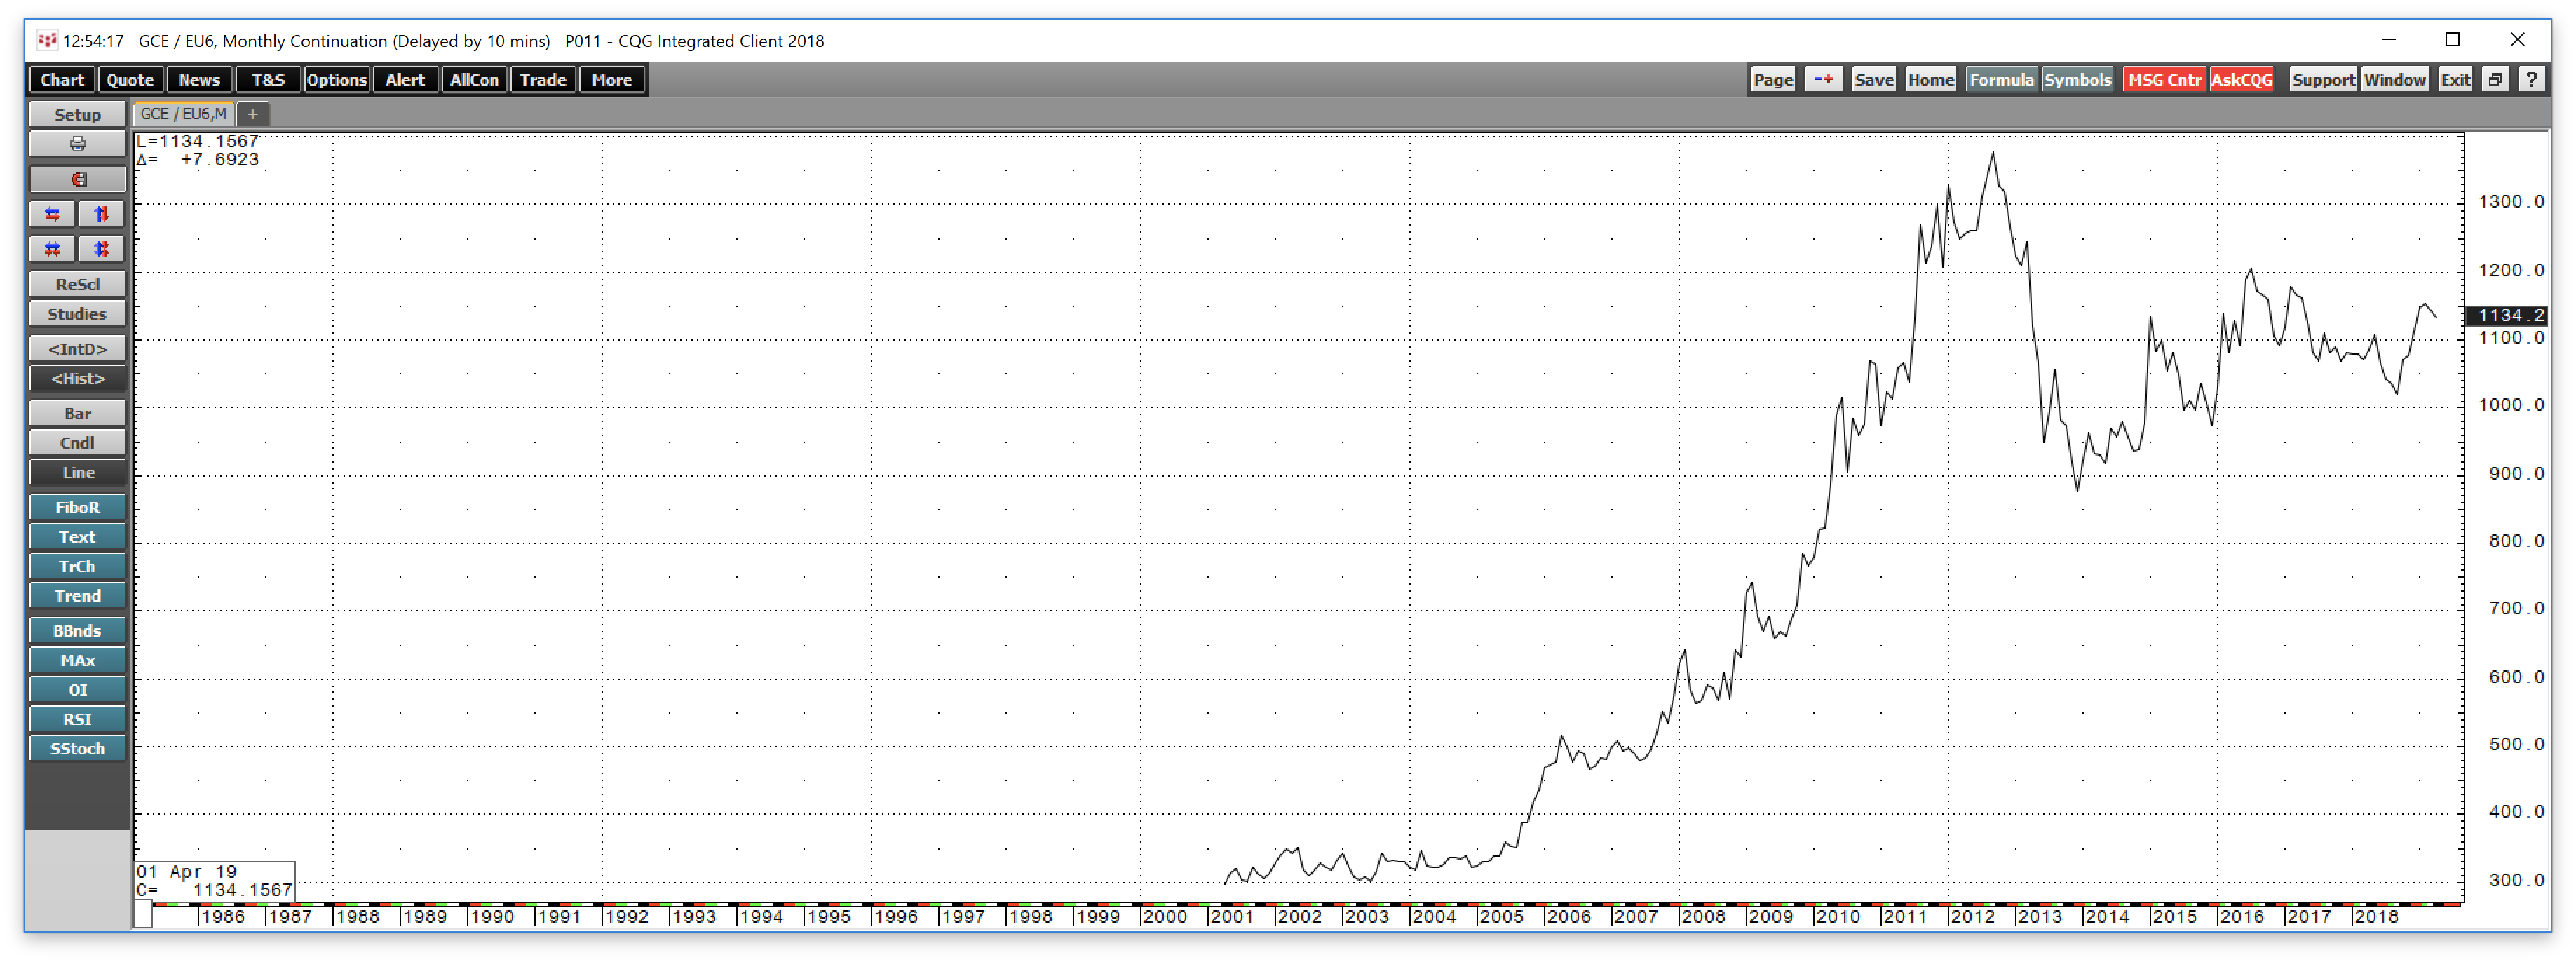
Source: CQG
The monthly chart of gold in euros shows that gold has appreciated dramatically since the turn of this century.
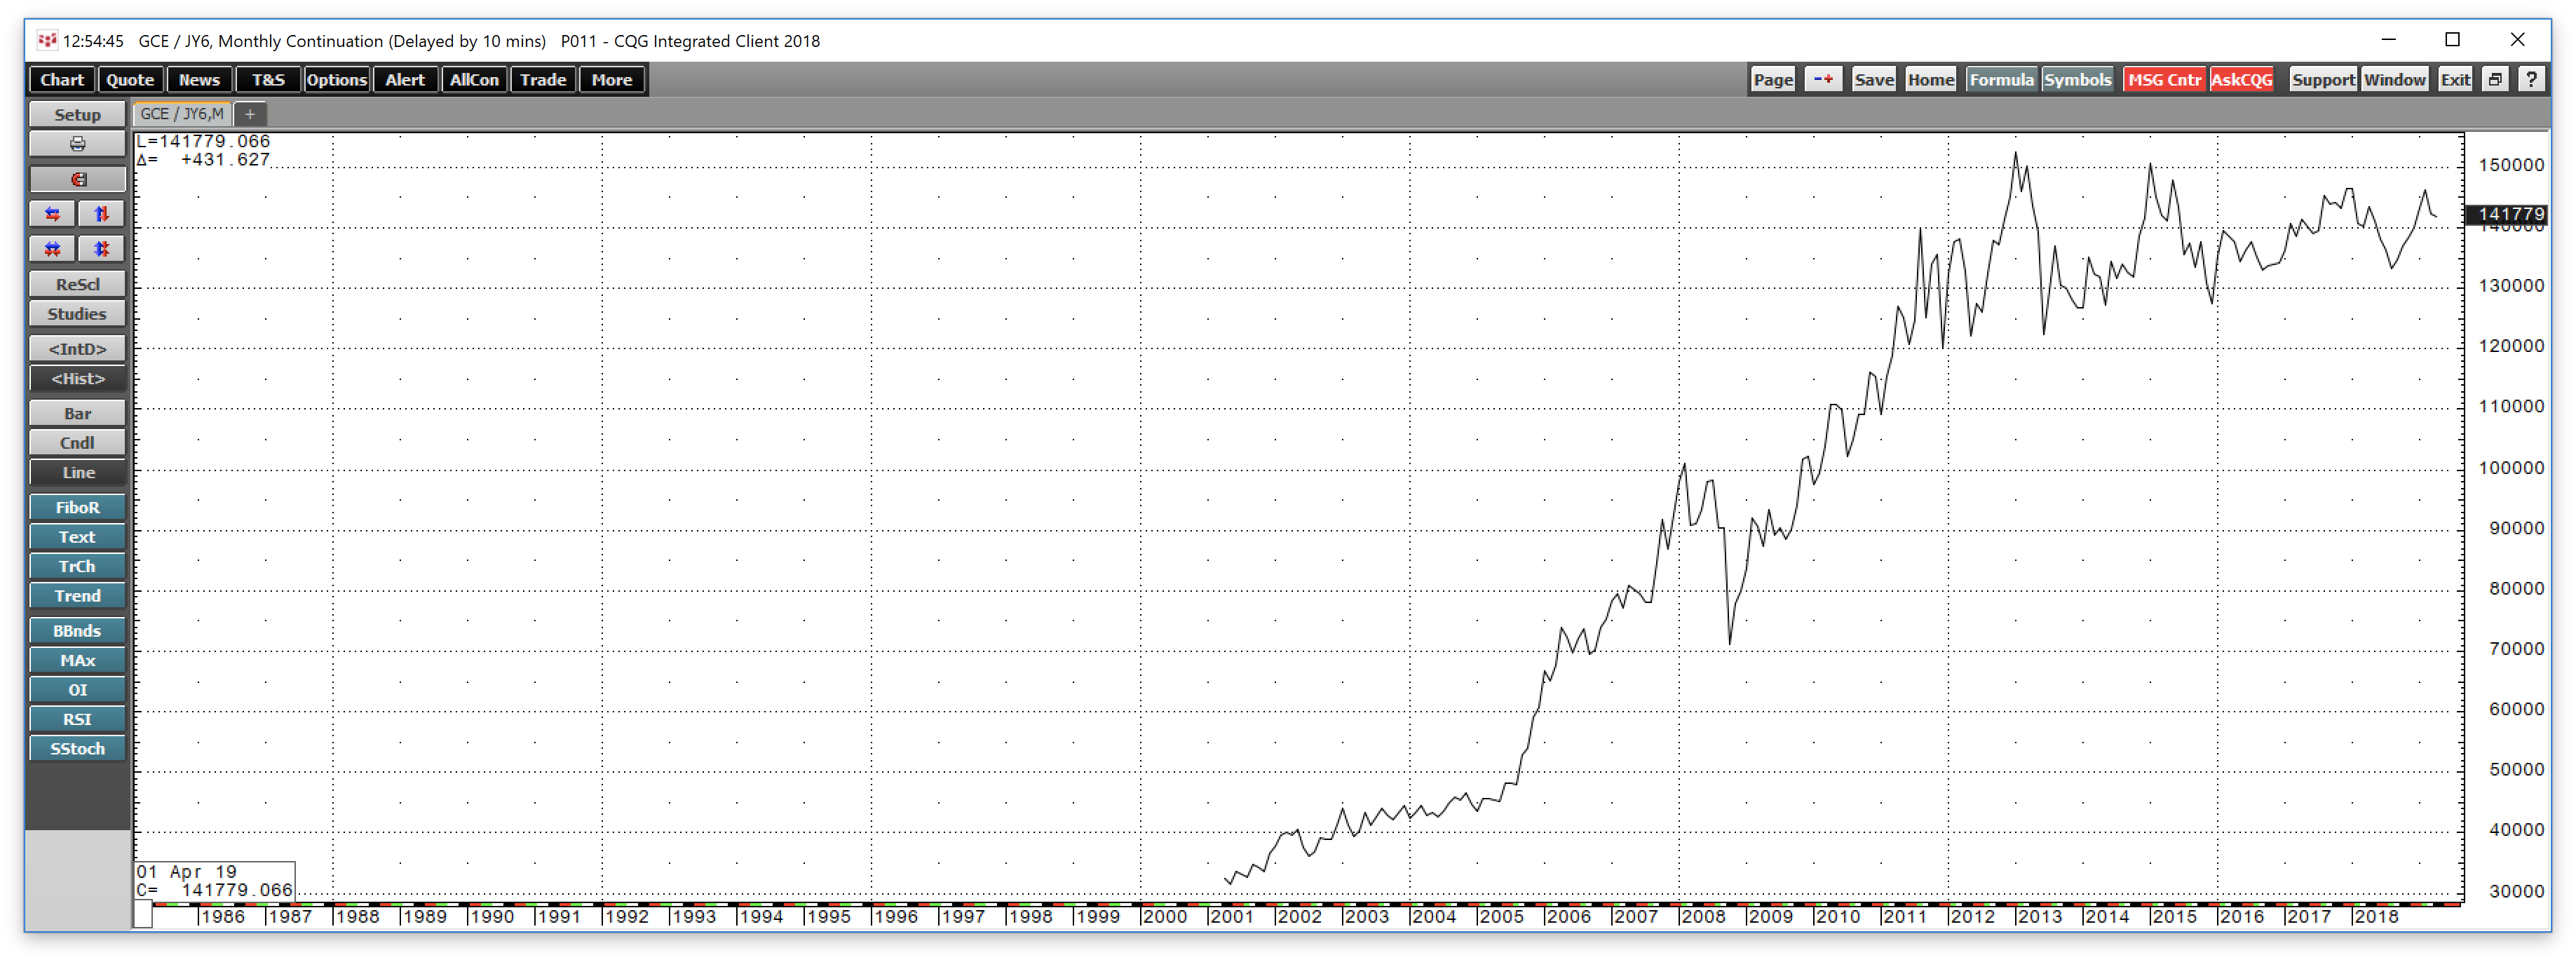
Source: CQG
Meanwhile, the price of gold in Japanese yen shows that it has also rallied since the turn of the century, and in yen, gold is not far off its all-time peak.
The price action in gold when it comes to the three leading reserve currencies of the world provides a reason to pause during the current price correction as the long-term trend is telling us that gold continues to gain value versus the world's leading fiat currencies.
While the Bank of England was selling their gold reserves at the start of this century, central banks have been net buyers of the yellow metal over recent years. China and Russia have built reserves by absorbing domestic output and occasionally purchasing gold on the international market. There have been very few official sector sales of gold which is a sign that central banks and governments still believe that gold is the ultimate means of exchange, a store of value, and is an effective reserve asset.
Even though they do not talk about gold often, the action of the world's monetary authorities speaks a lot louder than their silence on the subject.
A higher low is in the cards for the yellow metal - a golden opportunity to buy gold mining stocks
I am not a gold bug who always believes the price gold is going to move higher, but I do think that the yellow metal is the ultimate means of exchange. As a student of history, the metal has played a leading role as an asset for a lot longer than any currency currently in circulation. For thousands of years, gold has remained a constant symbol of wealth, and it continues to receive validation from governments who hold the metal as part of their foreign exchange reserve assets.
Gold currently looks like it is heading lower which, in my experience, has always been the perfect time to begin accumulating the yellow metal. While most market participants tend to purchase gold as it is moving higher, I have found that a scale-down buying approach has optimized my results. I prefer to sell gold on a scale-up basis when the market becomes overpopulated with buyers. The open interest metric has been a great monitor of the behavior of the herd of investors and speculators in the precious metal. The recent decline in open interest is a sign that the gold futures market is going to run out of selling sooner, rather than later.
Gold mining shares provide a leveraged return on the up and the downside compared to the price of gold. While buying specific mining companies involves idiosyncratic risk, I prefer to use the VanEck Vectors Gold Miners ETF product for a leveraged position in gold or the VanEck Vectors Junior Gold Miners ETF product for even more gearing as the juniors tend to move more on a percentage basis that the leading gold mining companies. With open interest falling, this could be the perfect time to begin building long positions in GDX and GDXJ for the time when the selling stops and gold finds a bottom. The price of gold has declined from a high in 2019 at $1344 on the continuous futures contract to a low at $1266 on April 23, a drop of 5.8%.
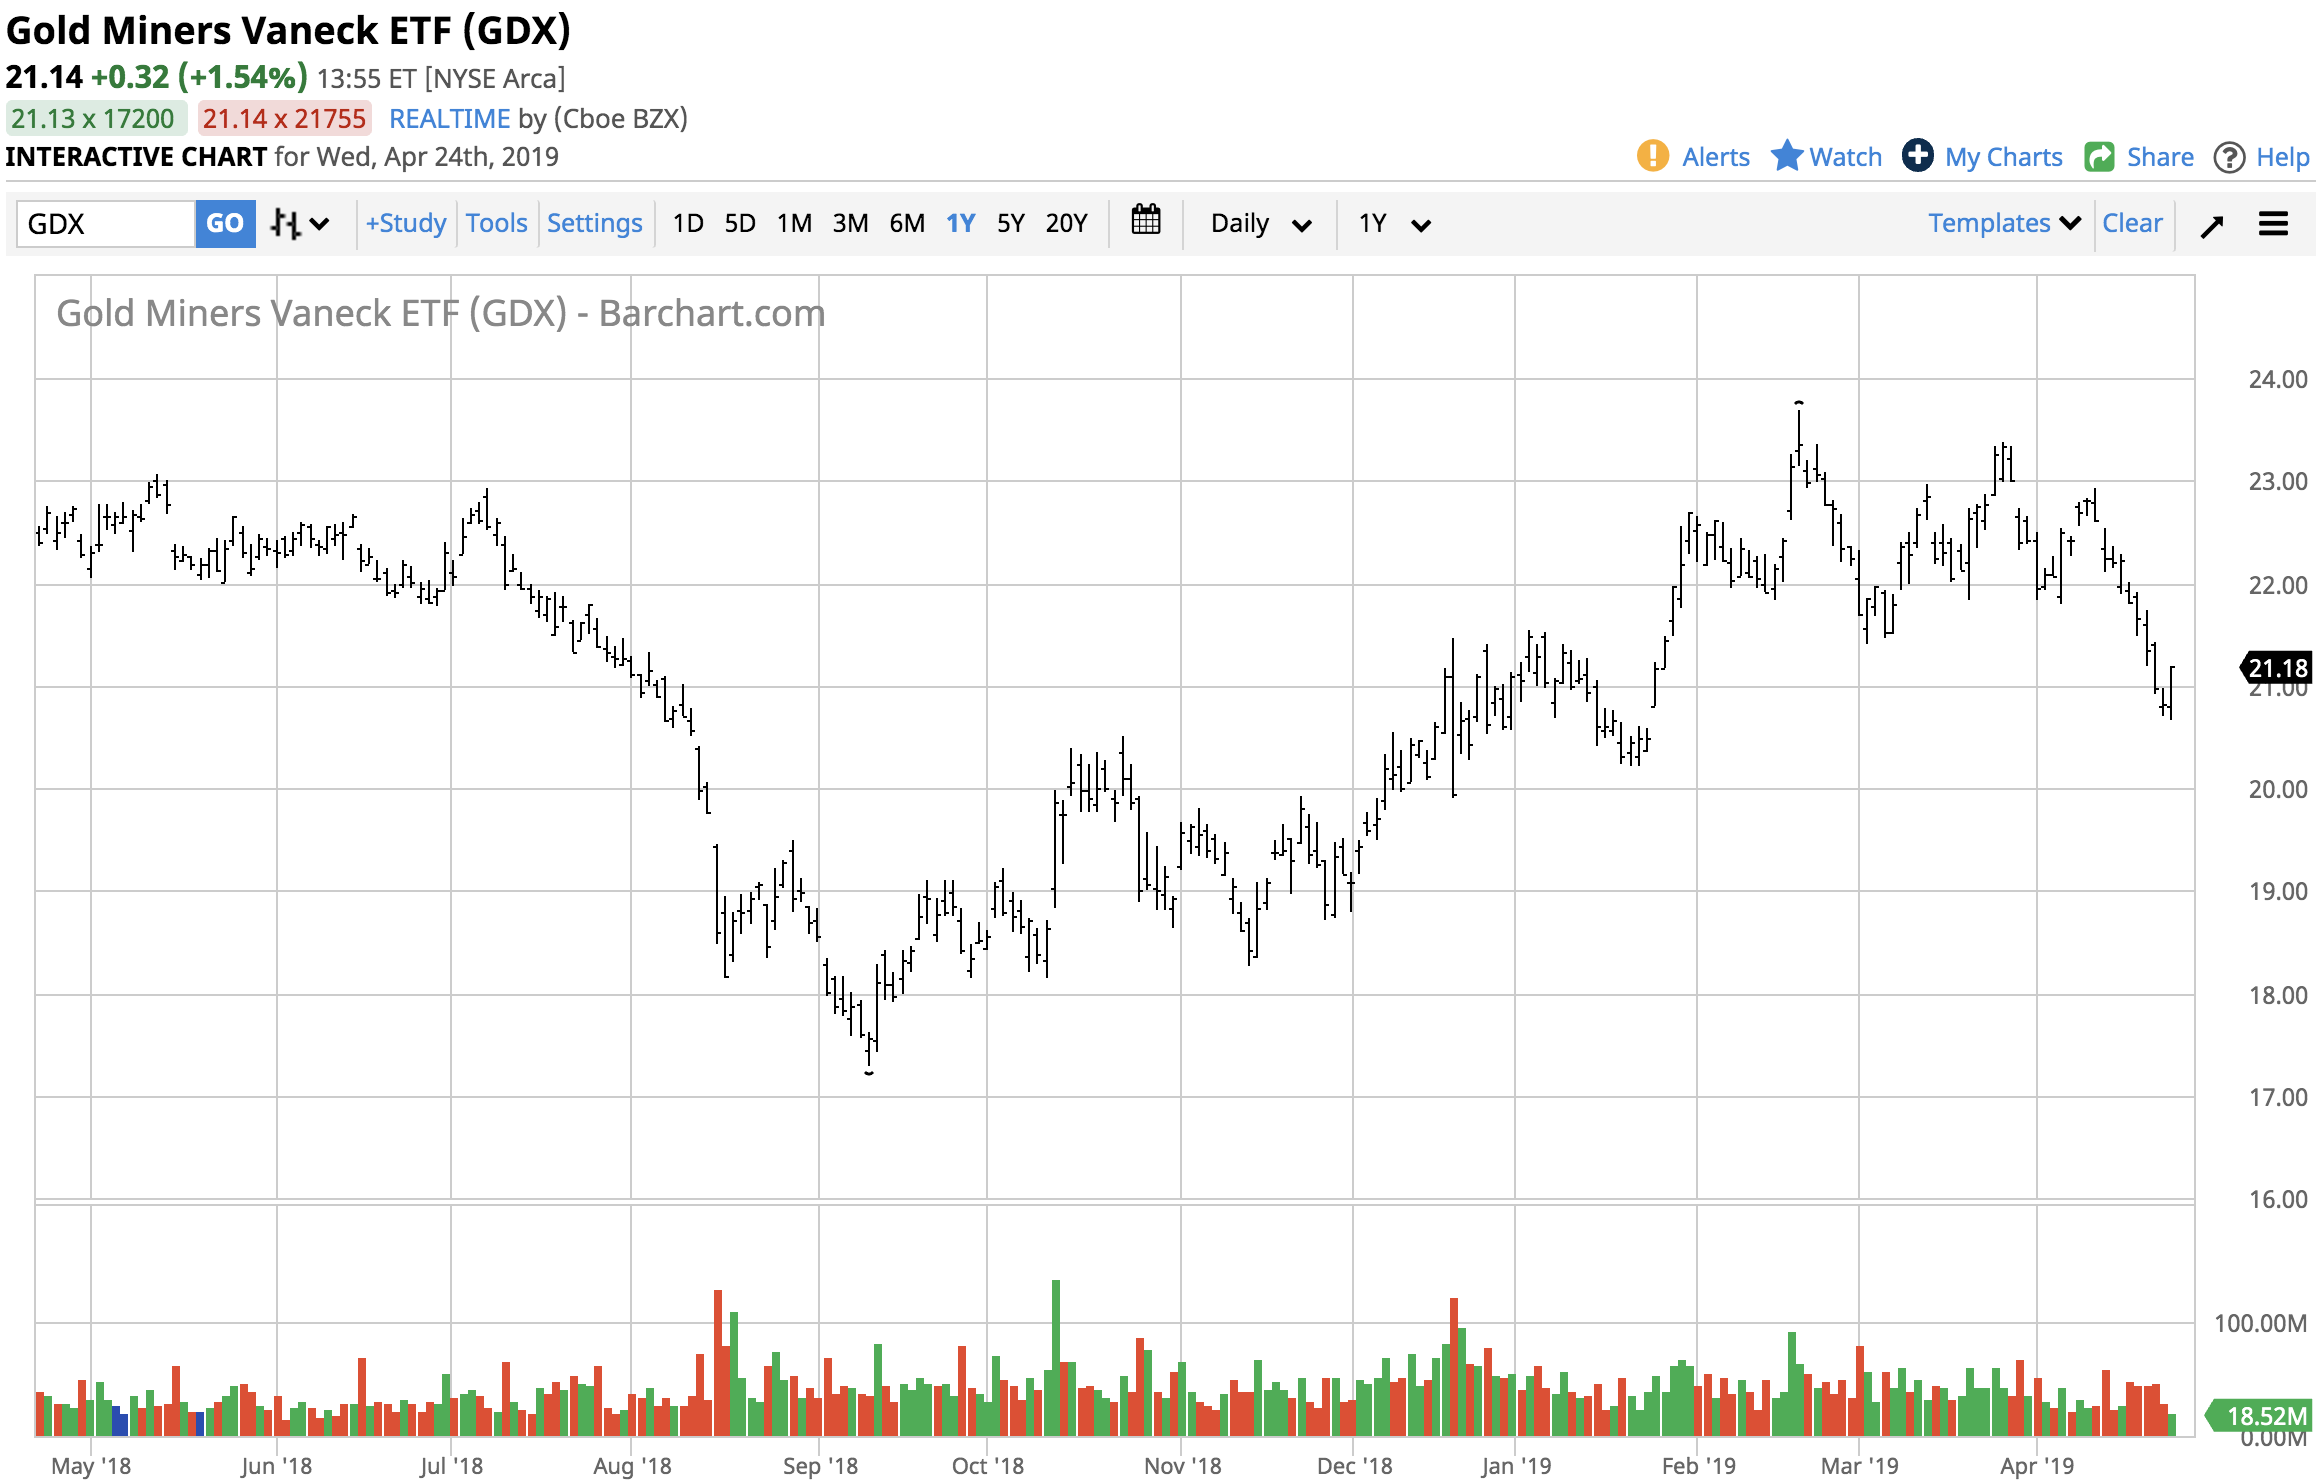
Source: Barchart
As the chart of GDX shows, the mining ETF dropped from $23.70 to $20.67 over the same period, a decline of 12.8% which was reflected the leverage on the downside. The top holdings of GDX include Newmont, Barrick, Newcrest, Franco-Nevada, and Wheaton which as of April 22 accounted for over 41% of the ETF's holdings. GDX has net assets of $10.29 billion and trades an average of over 43 million shares each day.

Source: Barchart
Over the same period, GDXJ dropped from $35.04 to $28.61 or 18.4% which was a leveraged moved compared to both gold and the GDX ETF. GDXJ's top holdings include Kinross, Cia De Minas Buenaventura SAA, Northern Star Resources, Evolution Mining, Gold Filed Ltd, Pan American Silver, and Yamana Gold which account for over 30% of the ETF's holdings. GDXJ has net assets of $3.9 billion and trades an average of over 13 million shares each day.
A higher low may be in the cards for the gold market as it looks ugly enough to buy these days. GDX and GDXJ provided leveraged performance on the downside and are likely to do the same on the upside. Buying the mining ETFs on a scale-down basis could be the optimal strategy as gold searches for a low when open interest falls to a level where the market runs dry of selling.
0 comments:
Publicar un comentario