The World's Economy Is Cooling Off (But It's Not All Bad) - Part I: United States
by: The Fortune Teller
Summary
- This series of articles is looking at the world's four largest economies, touching upon the current negatives (many) and positives (less).
- It's important to remember that the state of the economy and the behavior of the market aren't necessarily walking hand-in-hand.
- Like anything else in life, there are also pros and cons in the US economy, and this is not a black-or-white type of article.
- Having said that, it certainly seems/feels like there are more from the latter.
Prologue
By now, it's clear that the world's economy is cooling off. Almost everywhere one looks at - there are more and more signs of weakness.
In this series, we will touch upon each of the world's four largest economies, trying to figure out how bad (or good) things are.

Part I, the one you're currently reading, focuses on the US (SPY, DIA, QQQ, IWM), the world's largest economy.
Part IV will focus on Germany (EWG), the world's fourth largest economy.
By the way, the ranking isn't expected to change over the next few years.
Investment Thesis
In spite of the past week's positive tone (overall) in the market, it's important to remember that we are:
- Only a few weeks post the market entering a bear market territory. While a bear market doesn't automatically/necessarily lead to a recession - this isn't something that should be easily dismissed.
- Still seeing parts of the yield curve inverting, especially the up tenors up to five years. Once again, although a full inverted yield (usually measured by the 2s10s spread) is neither certain nor guaranteeing a recession - a 10-2 inversion is a very reliable indicator and, if and when we get there, investors should be very mindful of it.
- Keep getting mostly negative/"broken" economic data. As this article suggests, there are many areas within the world's economy (generally speaking) and the US (specifically) that need to be addressed.
In this article, we will touch upon all the recent red signals, but we will also present some points/areas that provide reasons to remain optimistic, or at least not totally pessimistic.
Our approach over the past year was to remain fully invested, but to shift:
- From a more aggressive approach to being more defensive.
- Less growth (e.g. technology), more income (e.g. REITs).
- Reducing risk and HY, adding safety and IG.
- Dumping long-duration, focus on short-to-medium duration and relatively shorter tenors/intervals.
- Increasing the floating-rate exposure at the expense of fixed-rate.
- Employing more hedges by using pair trades, option-trading, and short selling.
Such a shift, although it provides no protection against a market correction, has put us in a much better position to withstand the -20% drop stocks went through over a short period of time.
We strongly suggest for readers to keep their eyes wide-open and adhere to the most important thing when it comes to investing: Risk management.
Risk management isn't a recipe to avoid losses, but it's an ongoing process of asking yourself many "what IFs" type of questions. For example: What if there's no trade deal agreement? Are you ready for this?
The most important virtues any investor should strive for are: Patience, Discipline, Consistency, and Flexibility, or (as we like to call this) P-DCF.
As most of you probably know, DCF also stands for "Distributable Cash Flow". If we decide that the "P" stands for "Proven", we can say that adopting the P-DCF virtues may lead to a better, certainly safer, and Proven Distributable Cash Flow.
Ten Recent Signs of Weakness
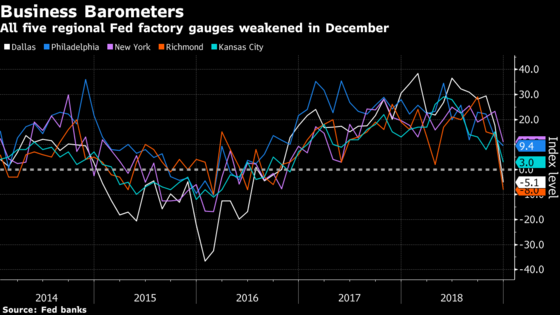
1. Five Fed indices of regional manufacturing all slumped together in December, the first time they've fallen in unison since May 2016.
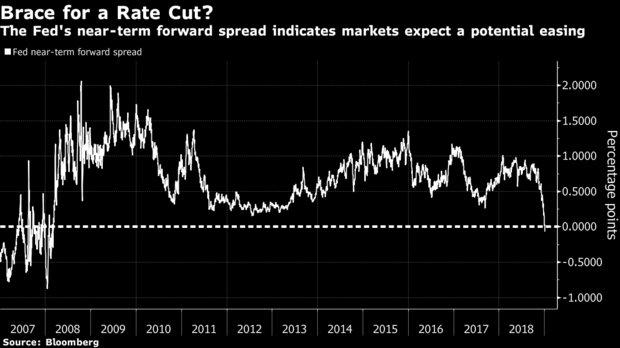
2. A market indicator closely watched by the Fed as one of the most accurate gauges of economic health is pricing in lower rates for the first time in more than a decade.
3. Some may view this as a sign of (recent-past) growth, but it's hard to argue that this is not a cause for a (future) weakness.
It certainly seems like the Fed is going to pause, or at least be very cautious with future hikes. Once again, hard to argue this isn't a result of a weakness, not strength.
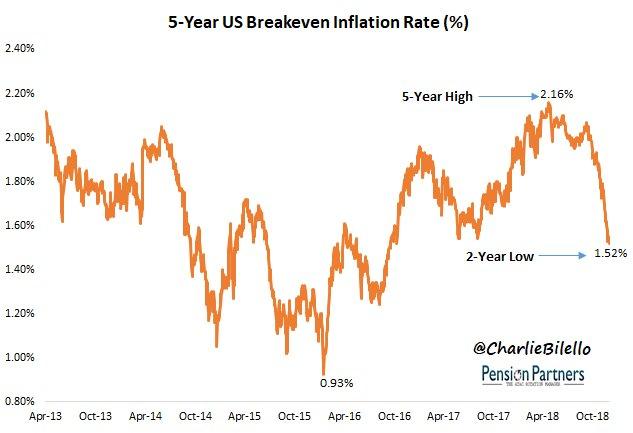
4. Inflation expectations (5-yr break-even) are now at a 2-year low: 1.52%. Safe to say that the Fed will be on hold for a while.
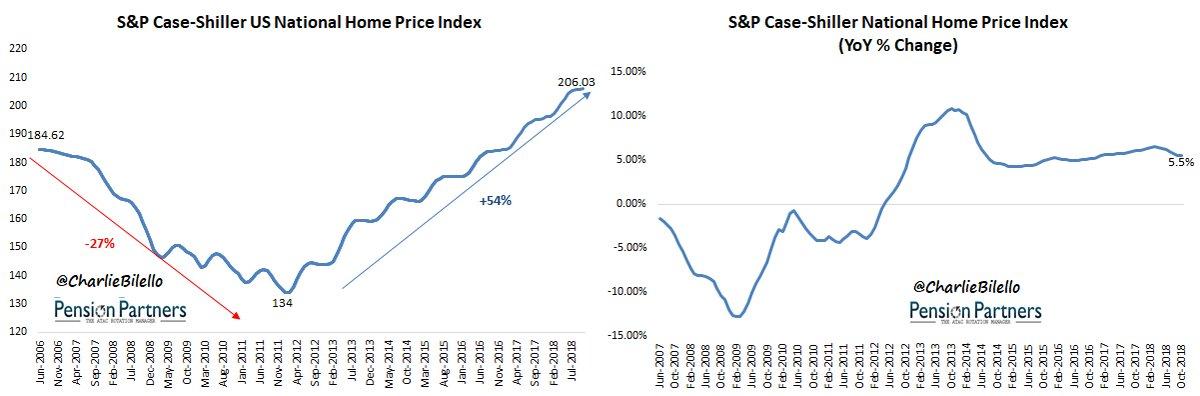
5. US Home Prices continue to hit new highs, but rate of change is slowing. Prices are up 5.5% in the past year, lowest growth rate since December 2016.
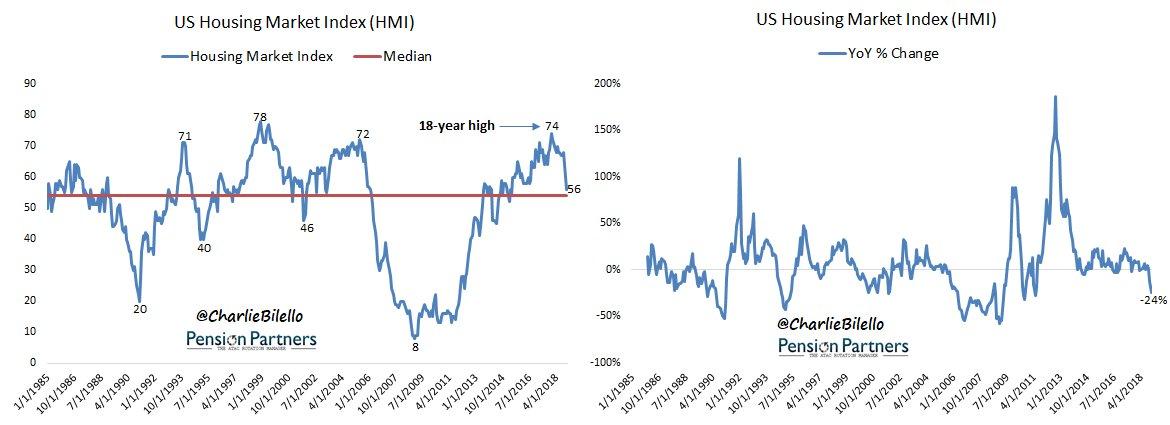
Speaking of... the US Housing Market Index (XHB) has declined 24% since hitting an 18-year high last December, its largest Y/Y drop since 2011
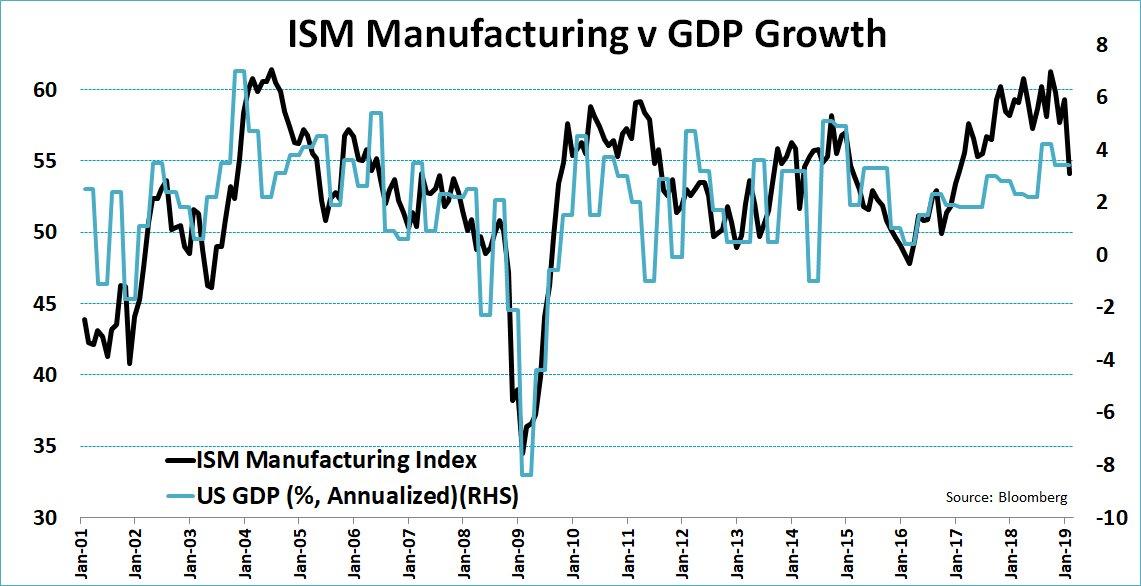
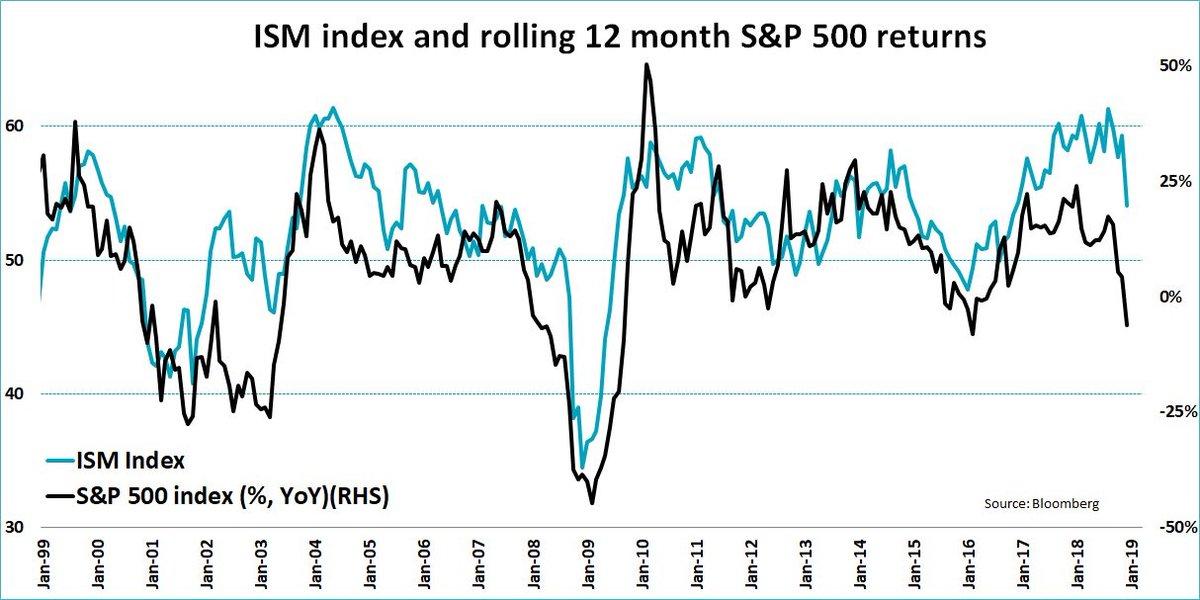
6. The ISM Manufacturing Index posts its biggest one-month drop since 2018!
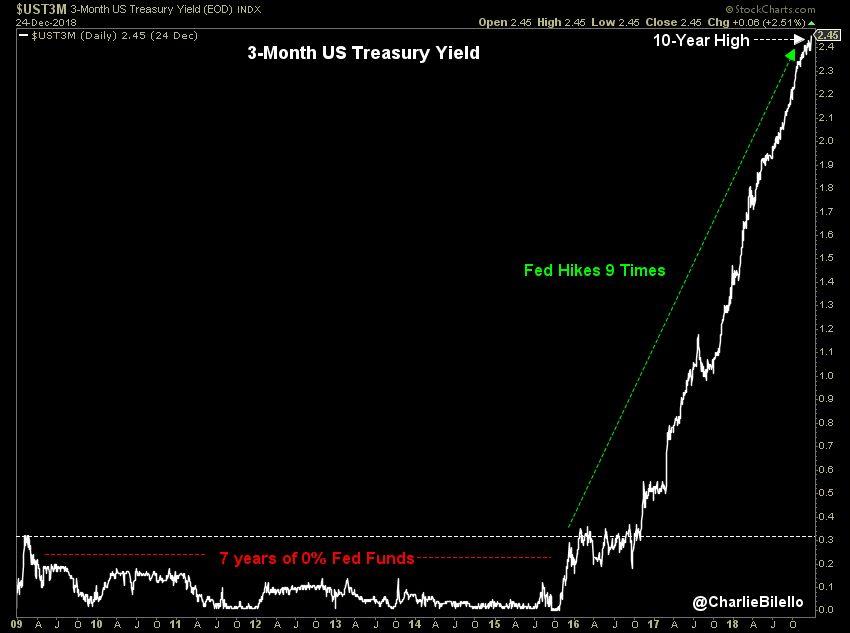
7. In one word: Debt. The US national debt is closing fast on $22 trillion.
On one hand, you may wish to claim that higher debt assists higher growth.

On the other hand, when debt rises at a much faster pace than growth itself - it's clear that something is broken.

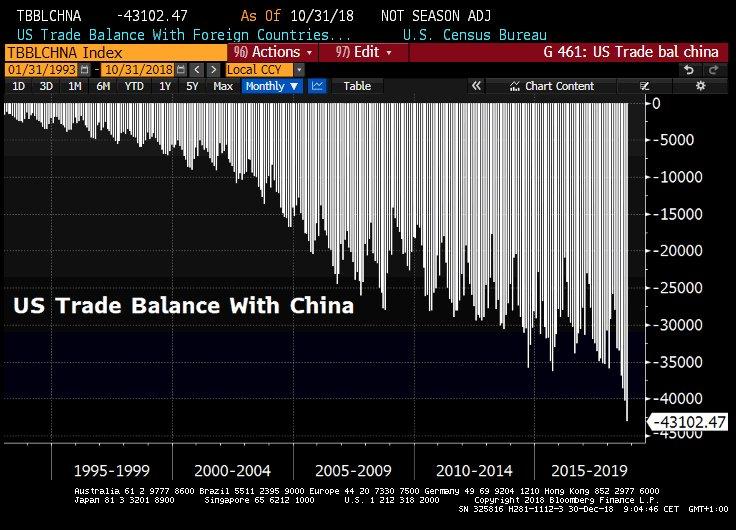
8. A war the US is unlikely to win. Trump says "big progress" on possible China trade deal as US trade deficit with China hits fresh high.
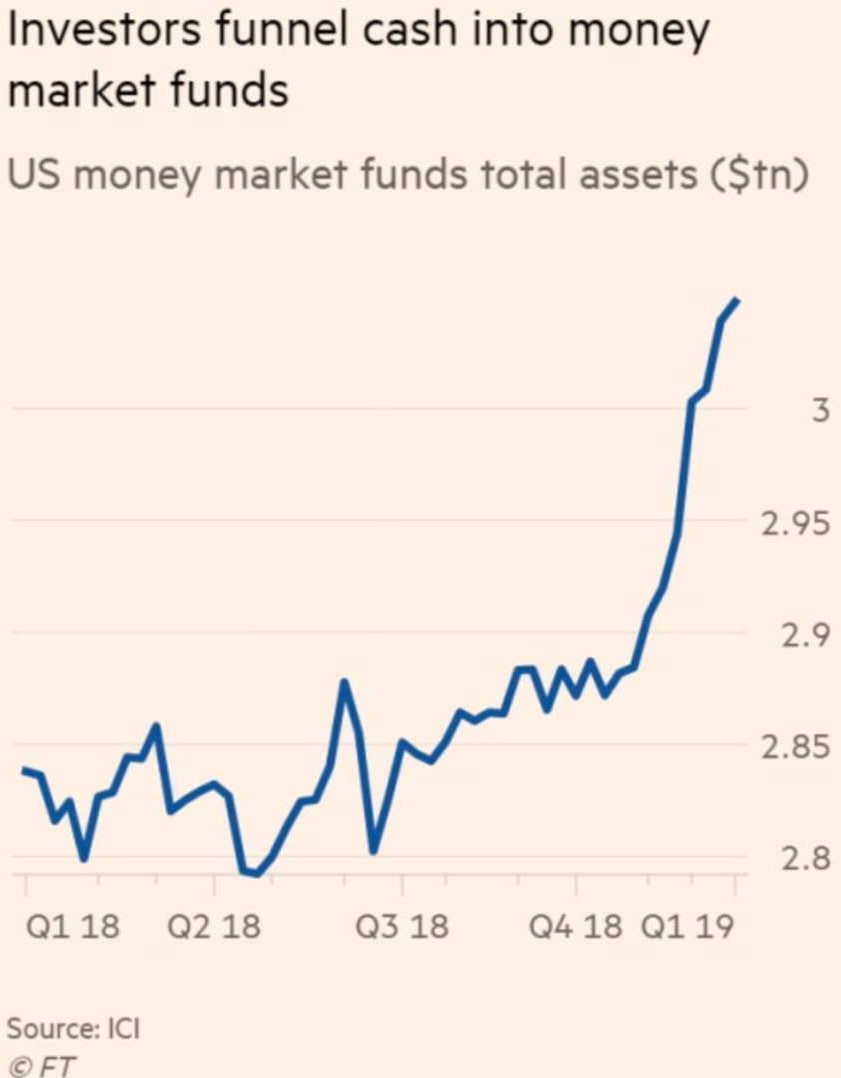
9. Cash is king! (and this is no good news)
It's not supposed to be, but out of 15 major asset classes, only one finished higher in 2018, and you already know who.
So much so, that the pile of cash jumped about 10% almost unnoticed…
US money market funds have seen $175 billion of inflows over nine straight weeks, the longest such streak since October 2008.
10. The whistle-blowing sector. US Financials (XLF) are down 25% from their January high.
During the 2015-16 correction, they lost 23%. During the 2011 correction, they lost 34%.

Five Signs that Things Aren't that Bad After All
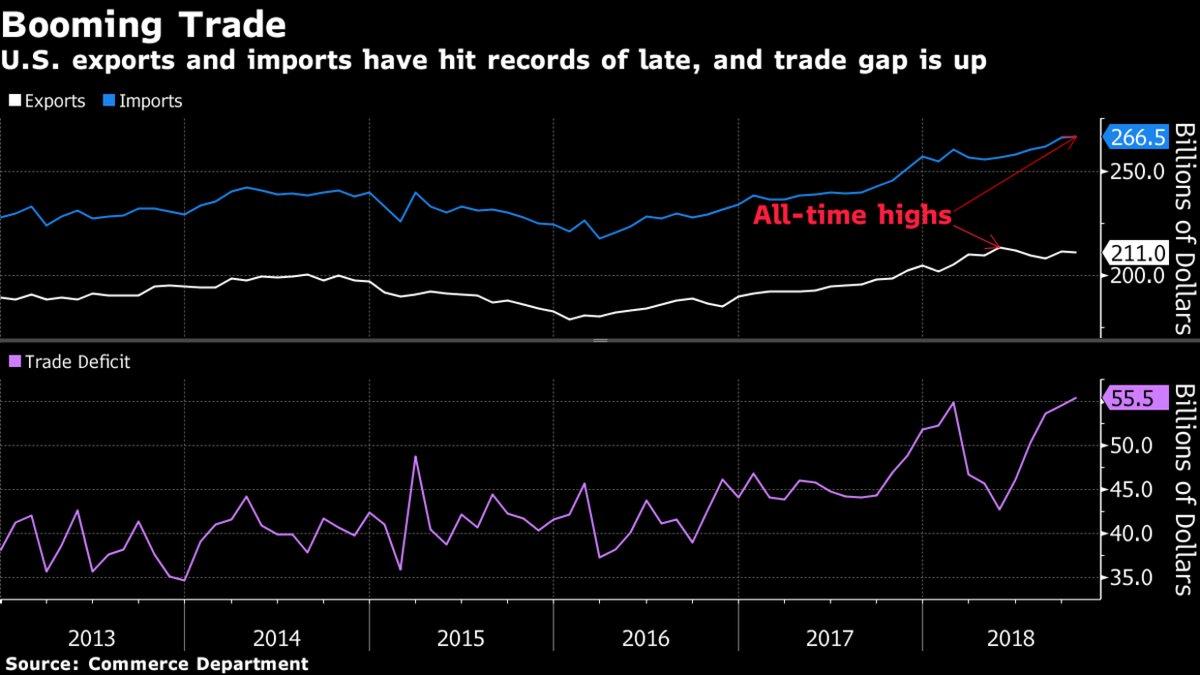
1. Trade boom/End of trade war seems near.
Trump's trade war has come with an unexpected bonus: more trade. A rush to get ahead of higher tariffs, particularly on US imports from China, has motivated American companies to increase orders, which has helped boost volumes at the country’s ports
What would it take to re-balance US-China trade? I still think it requires FX realignment (somewhat like the Plaza Accord) — which could be achieved by simply cutting and pasting the USMCA's FX chapter into a G-2 trade agreement.
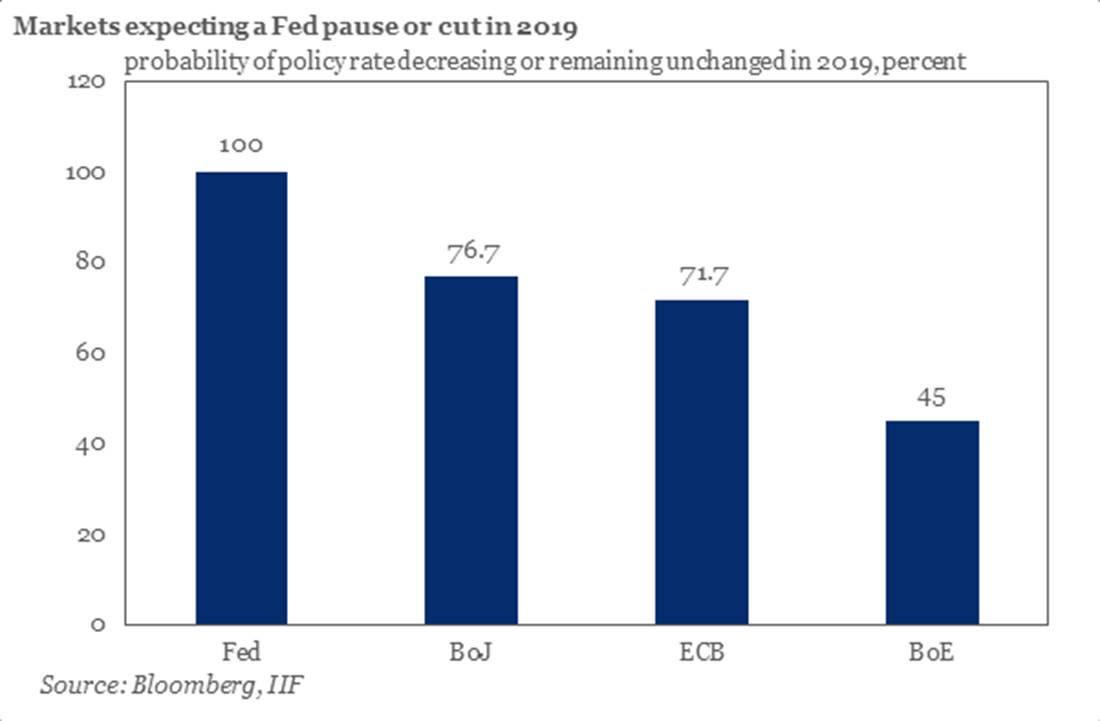
2. Monetary policy is likely to shift.
It's no surprise then to see Robert Kaplan, President of the Federal Reserve Bank of Dallas, saying the US central bank should put interest rates on hold until uncertainty clears.
Consequently, the Fed Funds futures curve is now looking like this:
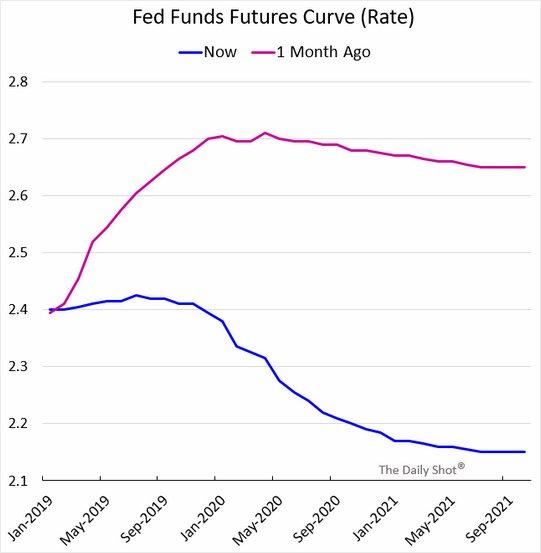
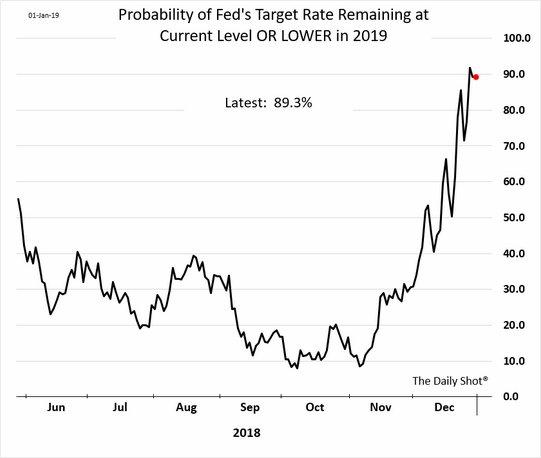
As a result of tighter financial conditions, lower inflation expectations, and soft economic data, markets are now pricing in an 89% probability that the Fed will not hike rates this year (and may even lower them).
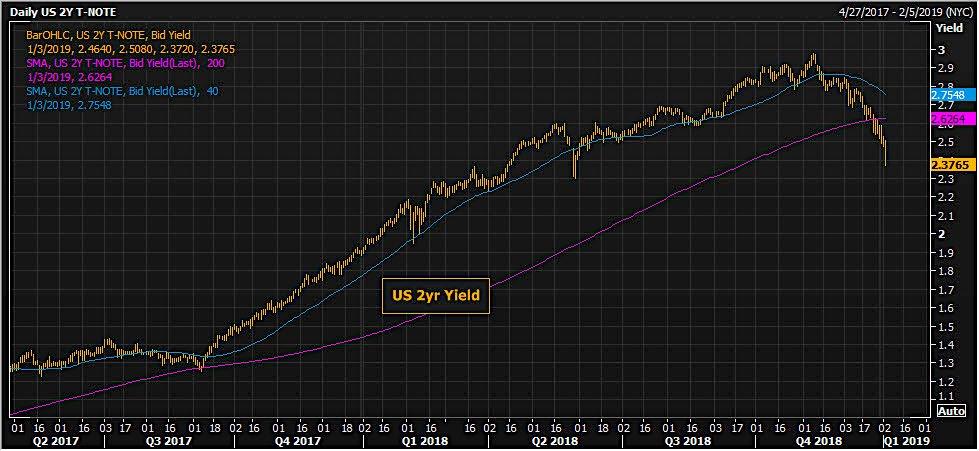
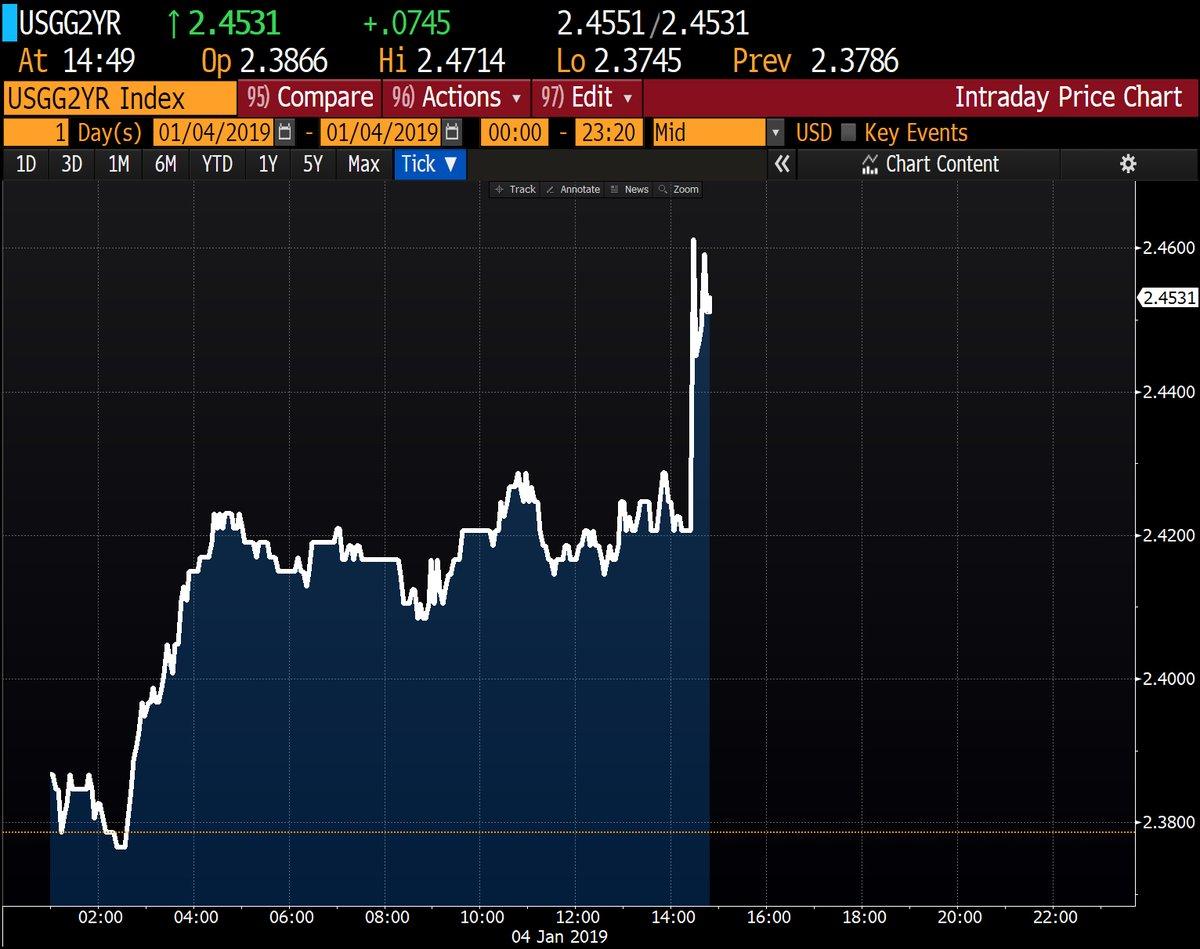
Trading 60 bps off its high water-mark (less than 2 months ago), the US 2-year yield is implying that the Fed is done. At 2.37%, below the Fed Funds future rate, the market is expecting a rate cut within the next two years. As a matter of fact, traders are now fully pricing in a Fed rate cut by April 2020.
All in all, the markets are most dovish on the Federal Reserve; too dovish probably...
3. Overreaction.
The US stock market is pointing to a massive reduction in GDP growth, the ISM Manufacturing Index is not. But which one is right?
Stocks are already pricing in a severe downturn in manufacturing input. Unless we have another big crisis, stocks may offer an interesting entry point here.
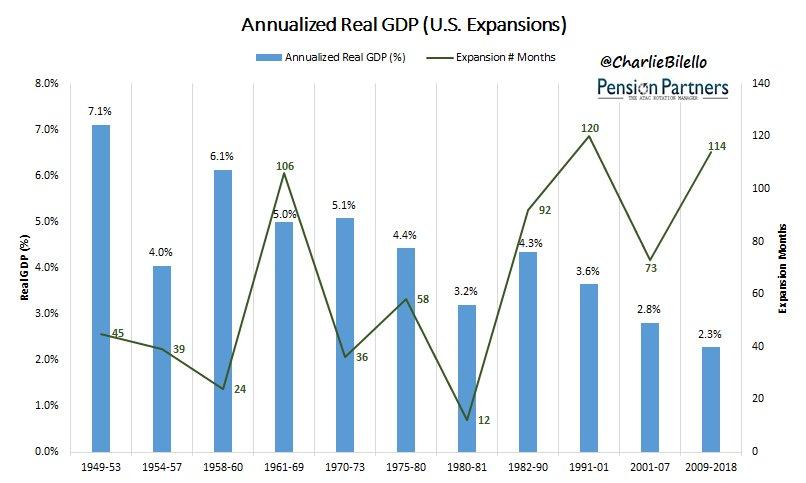
Let's not also forget that the US economic expansion is now 114 months old. If it lasts for another just 7 months, it will set a new record, breaking the prior run from 1991-2001.
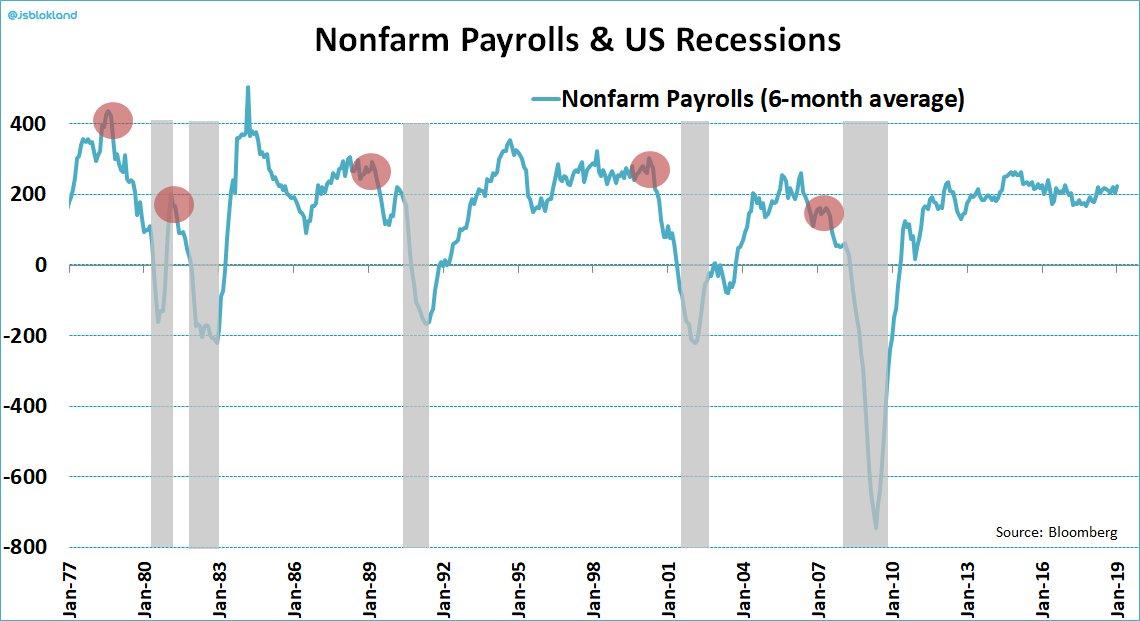
4. Employment situation.
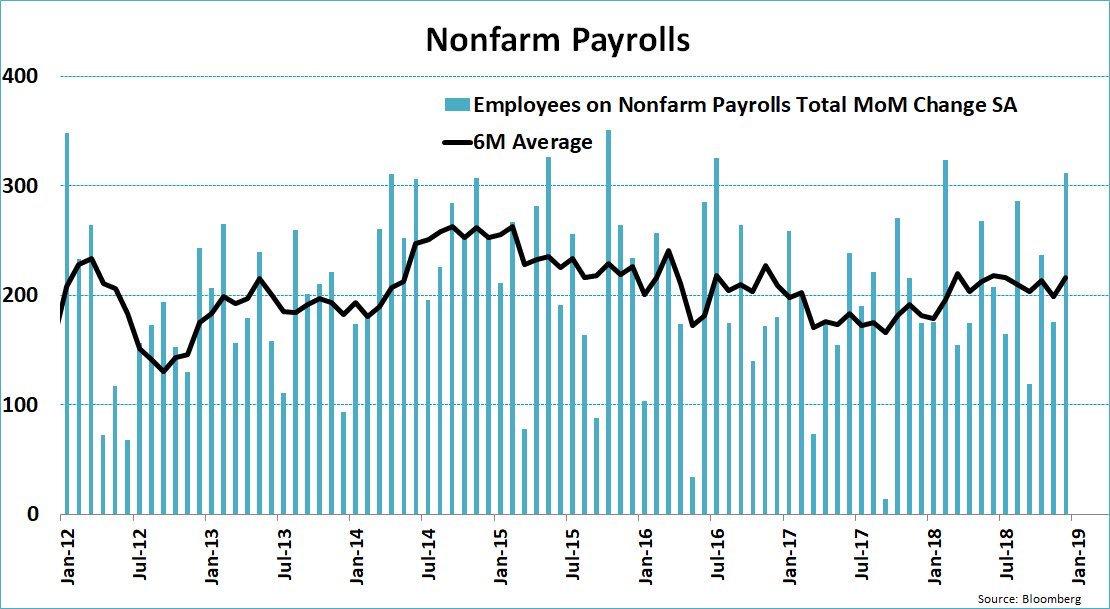
Non-farm payrolls increased a massive 312K in December, almost doubling the expected rise (Yet, unemployment rate rises to 3.9%).
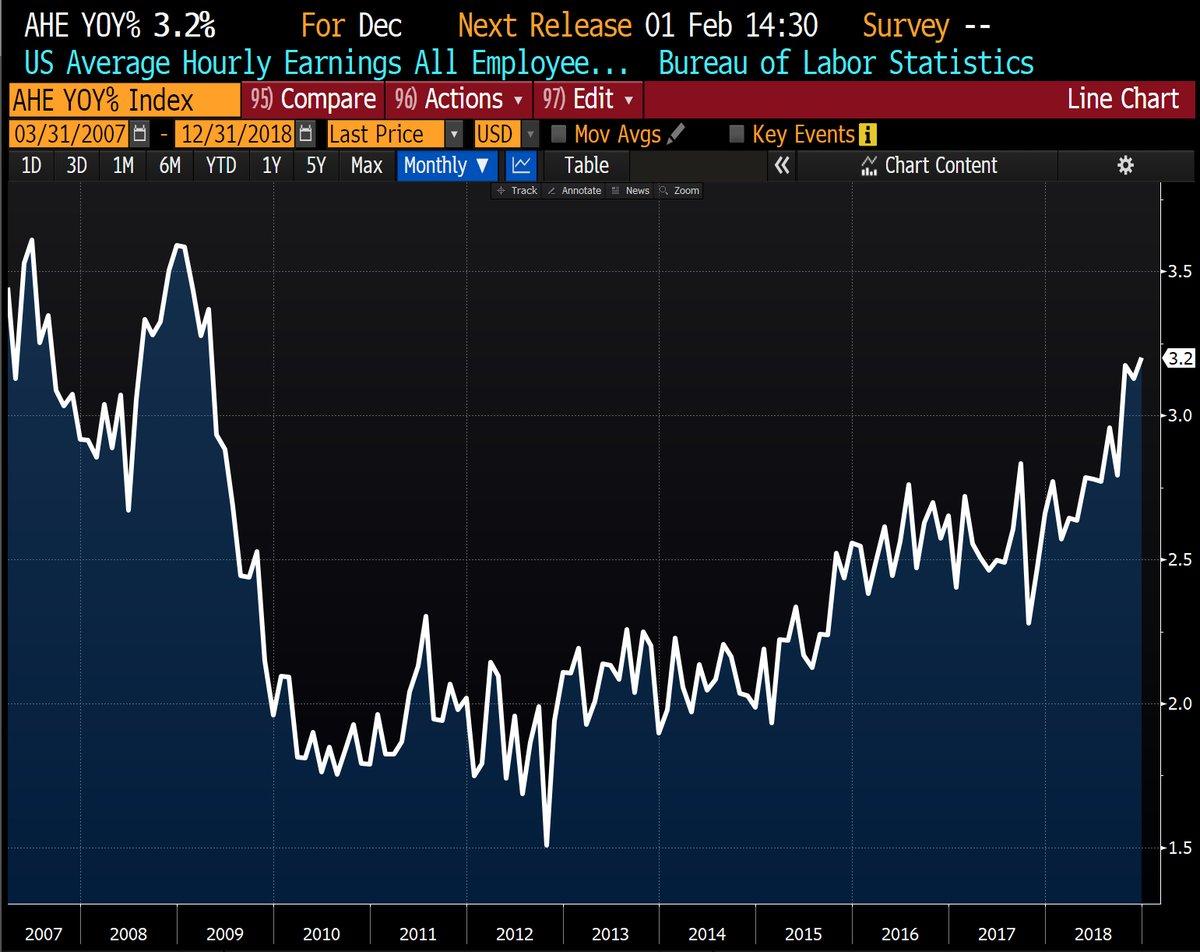
US wages rose 3.2% Y/Y in December, more than expected and the fastest pace since April 2009!
Nowadays, ...:
- more people than expected are having a job;
- people are getting paid more than expected (as well as more that the rise of inflation);
- higher wages are translated into more money to be spent by consumers;
- more people are attracted (back) to the labor market, thus increasing the participation rate; and
- increasing unemployment rate is reducing (or at least keeping potential) inflationary pressures in check.
I don't know about you but to me - the above doesn't sound that recessionary.
The 2-year Treasury yield has jumped as jobs and wages beat expectations. This could, not (necessarily) should, keep the Fed from pausing. After all, strong economic data, leading to higher yields, is calling for a hawkish (not dovish) Fed.
At the same time, the higher unemployment rate indicates more slack in the labor market, with less inflationary pressures.
However, it's important to bear in mind that we are not yet out of the woods. Non-farm payrolls do tend to peak at least 12 months before a recession occurs.
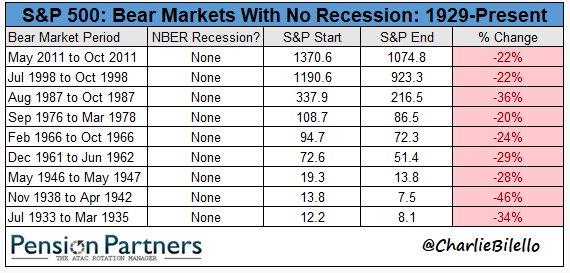
5. Been there, done that. Nothing to get (overly) excited about.
A bear market doesn't necessarily lead to a recession. There were 9 bear markets (out of 20) that did not lead to a recession:
Volatility (VXX) may seem like it's going crazy, but truth is, it feels more extreme than it actually is.
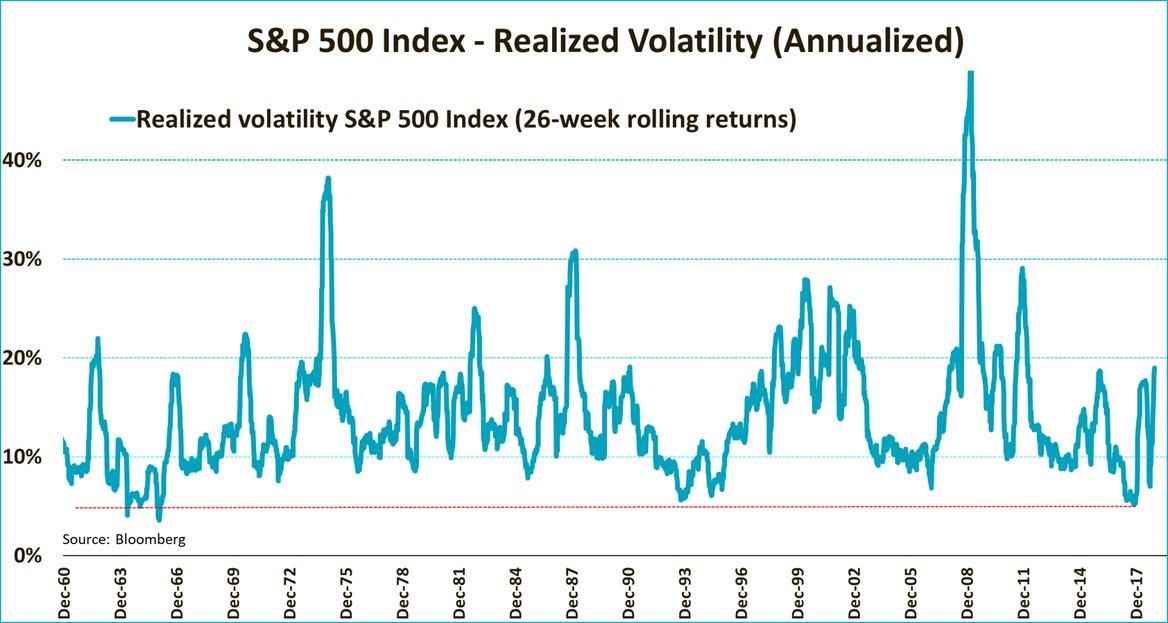
So don't listen to anyone who says what you're seeing today in markets is "crazy" or "abnormal." 2017 was the abnormal outlier. This is standard behavior, the price of admission for long-term investors.
Epilogue
After a battering in the fourth quarter of 2018, are stocks ready to rebound? The ERP, at 5.96% at the start of 2019, is a good sign, but slowing economic growth and market crises are ever present dangers.
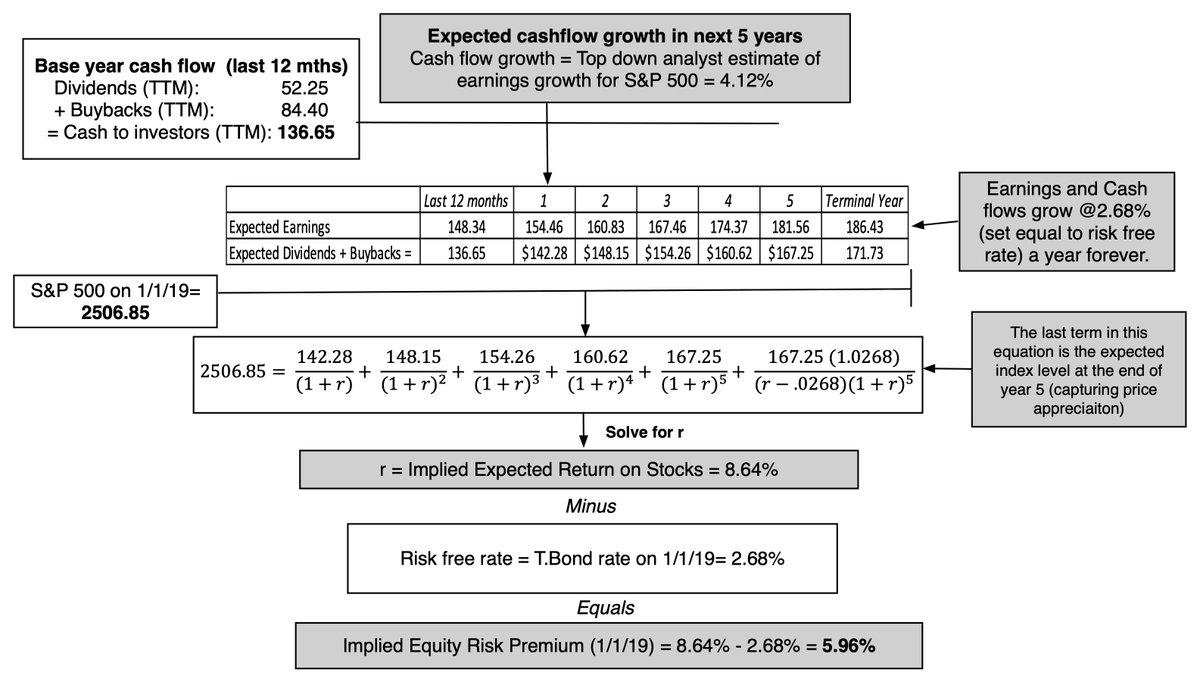
Source: Musings on Markets
I'd argue that the Fed is having a bigger effect on markets today than the blowout jobs report.
Last Friday, Fed Chair Powell (with the kind assistance of his predecessors) bolstered the idea that the US economy looks good, but isn't at risk of overheating, so there's no need to be hasty with rate hikes.
The employment situation report last Friday saw a big beat in the number of new jobs versus the market consensus and vast majority of expectations.
Wages gain at a pace that matches the fastest since 2009. This makes the Fed's job difficult and is leading to a flatter yield curve, with investors seeing perhaps marginally more rate hikes and lower long-term growth.
The record bull run from 2009-2017 ended in a tie, with the 1991-1999 bull run as the longest positive streak of positive years in history.
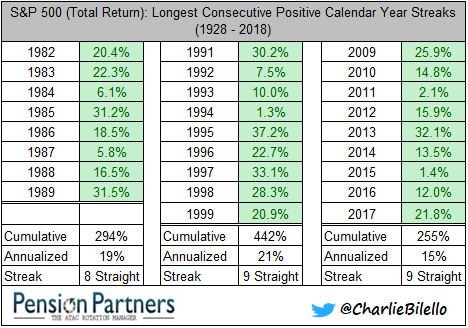
Nonetheless, the 1991-1999 run had returned 442% versus "only" 255% that the 2009-2017 run gained. Even the shorter ("only" 8 years) bull run of 1982-1989 had returned more than the most recent run.
There's always something to aspire for and records are made to be broken.
0 comments:
Publicar un comentario