Why Are 77% Of Global Assets In The Red In 2018? It's Simple
by: The Heisenberg
- Well, depending on how wide you want to cast your net, somewhere between 75% and 89% of global assets are negative this year.
- If you're looking to explain that rather unfortunate state of affairs, you might look at "cash".
- You might also consider that we hit "peak QE" flow in 2018.
- This really is not all that complicated.
As America goes to the polls and analysts begrudgingly churn out the obligatory deluge of midterm election projections, I thought I'd offer readers what I'm reasonably sure will be a welcome reprieve from the incessant flow of articles documenting how various asset classes have performed under historical instances of split government.
Over the weekend, in the comments on my most recent post for this platform, a couple of readers indirectly happened on the simplest (and by extension, the most elegant) explanation for this year's cross-asset malaise.
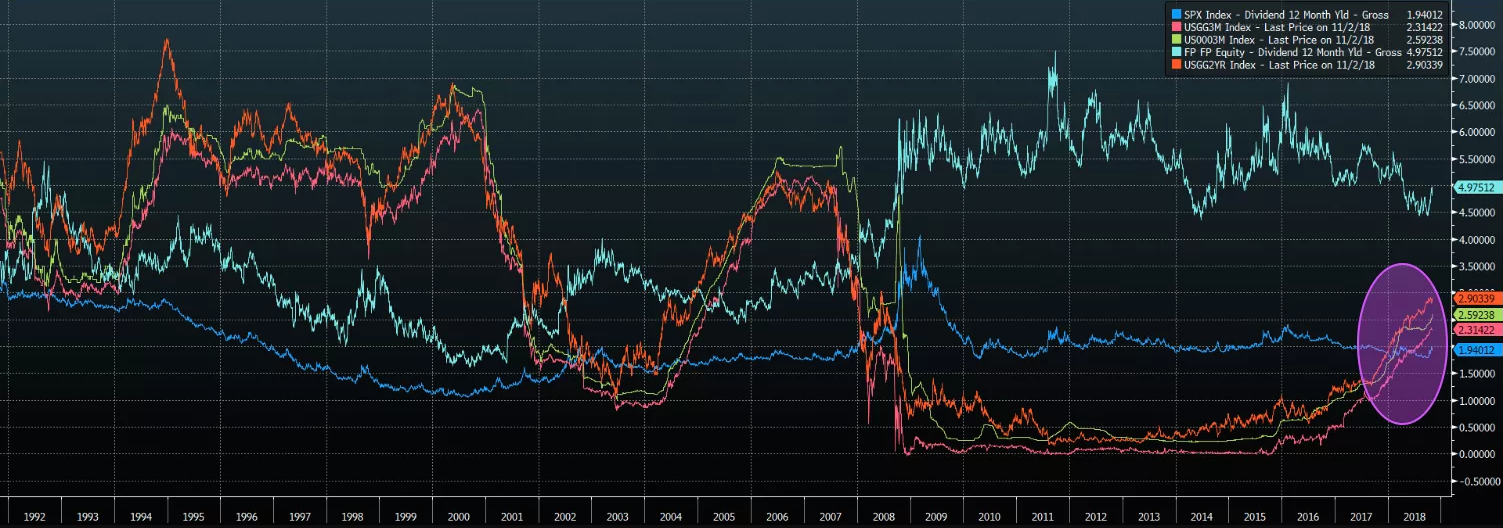
Back in September, in a post called "I Drink Your Milkshake", I noted that if you're looking for a straightforward reason to be wary of risk assets, you need only consult the following chart:
 (Bloomberg)
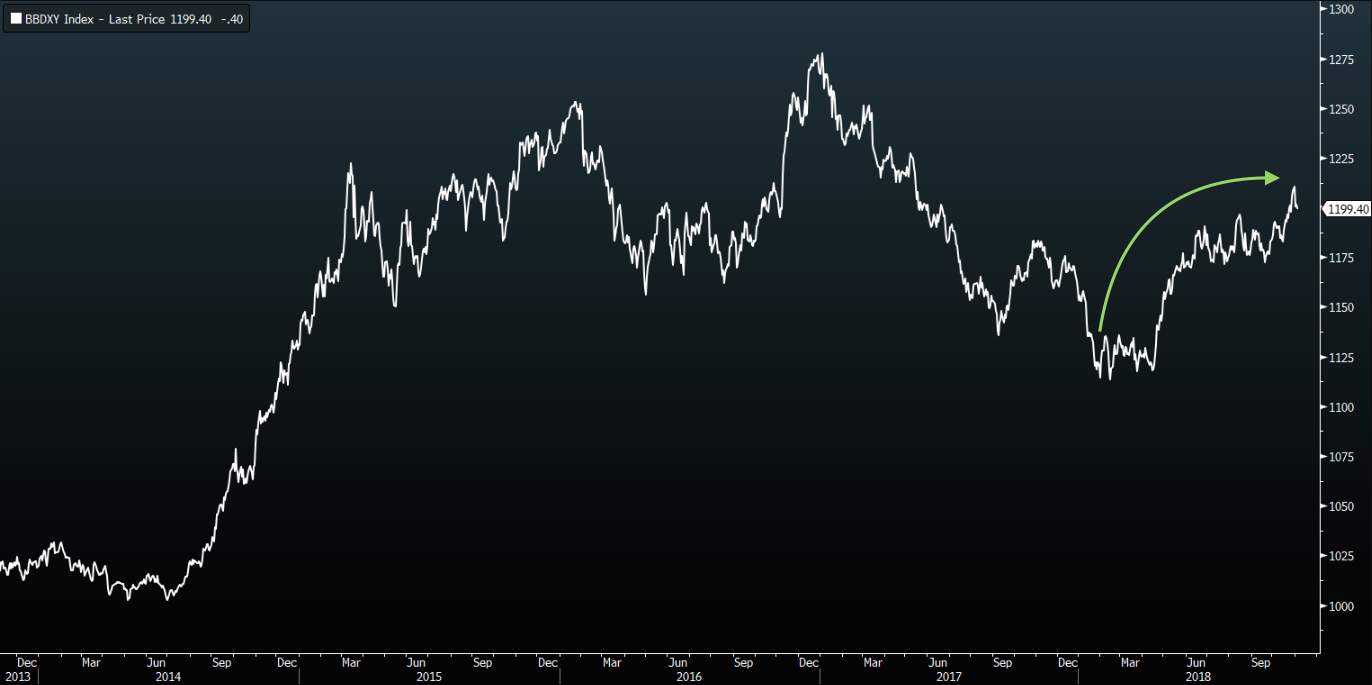
Long story short, what that represents is risk-free, USD "cash" becoming some semblance of viable again as an alternative to risk assets. That is of course a function of Fed hikes (and expectations thereof). Those would be the same Fed hikes which have driven the dollar (UUP) inexorably higher this year, which has in turn put enormous pressure on emerging markets that have borrowed heavily in foreign currencies. Here's a five-year chart of the BBDXY:
 (Bloomberg)
The point there is that Fed hikes (and expectations of developed market monetary policy normalization more generally) are reversing the nine-year-old global hunt for yield that pushed investors down the quality ladder and out the risk curve. The higher USD short rates go, the more acute that reversal is going to be as investors question the relative merits of staying put in risk assets as rates on riskless USD "cash" continue to rise.
This dynamic is exacerbated by the waning QE bid. For years, investors were warned that once the QE "flow" effect (i.e., the combined monthly bid from the big developed market central banks) starts to wane, risk assets would stumble. It's funny how controversial that contention was, given how self-evident it most assuredly is. When you have a price insensitive buyer armed with a printing press snapping up billions worth of assets (from govies, to corporate bonds to ETFs) every, single month, it stands to reason that when that flow subsides, prices for those assets will fall, if for no other reason than the fact that suddenly, more of the onus for absorbing supply will fall on price sensitive private investors.
There isn't a single thing that's complicated or controversial about that. In fact (and I tried pretty hard to emphasize this point last year), it's not as much a "bear" thesis as it is just a common sense assessment of the prevailing reality.
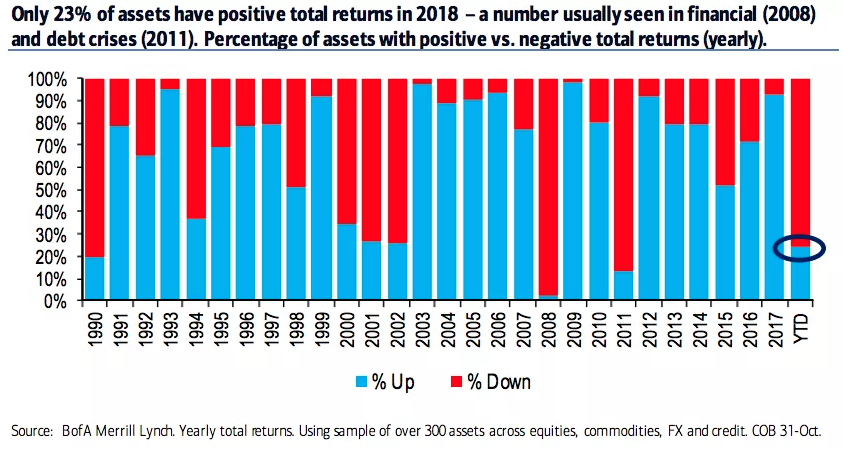
Well sure enough, we hit "peak QE" in 2018 and guess what? Through October 31, only 23% of global assets have managed positive returns in 2018. That’s according to BofAML, who looked at some 300 assets spanning equities, commodities, FX and credit. Long story short, that doesn't normally happen outside of recessions and debt crises.
 (BofAML)
Did your favorite QE skeptic predict that? I'm guessing no.
Again, the simplest explanation for that is simply that the policies which ensured a voracious appetite for anything that offered any semblance of yield are being gradually rolled back.
Here's a two-sentence excerpt from the BofAML note which contains that chart:
We think it reflects a bigger picture theme: Namely that assets are now struggling to produce meaningfully positive returns in an era of less central bank liquidity. The “invisible hand” that once propped-up market prices is now significantly smaller.
That would have been precarious enough on its own, but in 2018, it's been exacerbated by the Fed, which is caught in a rather unfortunate loop. The Trump administration's fiscal and trade policies are dollar positive, at least in the short- to medium-term. Repatriation flows from the tax cuts and the outperformance of the American economy and U.S stock market have helped support the greenback.
At the same time, the inflationary nature of late-cycle fiscal stimulus as well as jitters about tariff-related price pressures, have forced the Fed to lean more hawkish than they otherwise might. The tighter the labor market gets, the more pronounced that tendency is likely to be.
That means the monetary policy divergence between the Fed and the rest of the world is wider than it might have been, providing still more support for the dollar.
And it gets better (or worse, depending on how you want to look at it). The Treasury has had to ramp up debt issuance in order to fund the tax cuts and spending. That supply deluge comes just as the Fed is pulling back from the Treasury market. Well, somebody has to buy all of that USD debt and with the Fed's support waning, more of the supply has to be absorbed by other investors. That, in turn, worsens the dollar liquidity shortage. Just ask the RBI’s Urjit Patel, who wrote the following in an Op-Ed for the Financial Times earlier this year:
Dollar funding of emerging market economies has been in turmoil for months now. Unlike previous turbulence, this episode cannot be attributed to the US Federal Reserve’s moves on interest rates, which have been rising steadily since December 2016 in a calibrated manner.
The upheaval stems from the coincidence of two significant events: the Fed’s long-awaited moves to trim its balance sheet and a substantial increase in issuing US Treasuries to pay for tax cuts. Given the rapid rise in the size of the US deficit, the Fed must respond by slowing plans to shrink its balance sheet. If it does not, Treasuries will absorb such a large share of dollar liquidity that a crisis in the rest of the dollar bond markets is inevitable.
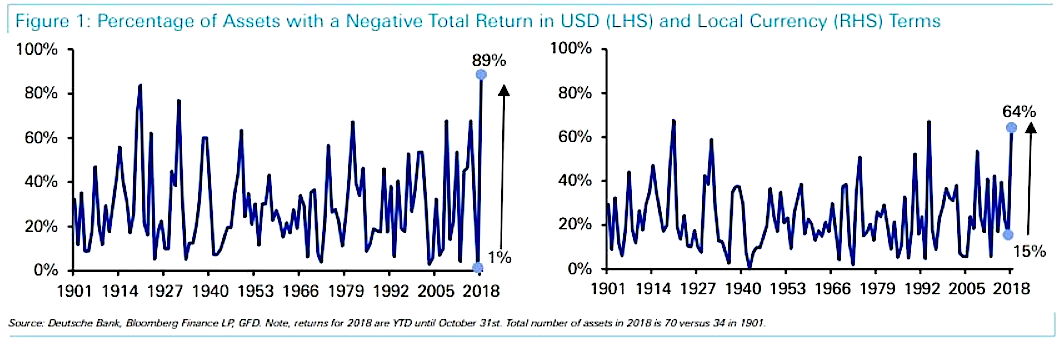
All of that helps to explain why suddenly nothing is working across assets. While you might not have seen the above chart from BofAML until now, you've probably seen the following set of visuals from Deutsche Bank, as they started making the rounds last week:
 (Deutsche Bank)
In addition to the waning bid from QE and the gradual rollback of accommodative monetary policy more generally, it's important to note that the backdrop against which all of this is unfolding is profoundly different from that which persisted in 2017. I penned a lengthy piece on this for my site on Monday evening, so I won't rehash the whole thing here, but suffice to say the "Goldilocks" environment of synchronized global growth and well-anchored inflation has given way to what looks like the beginning of synchronized downturn with higher inflation (at least in the U.S.). That "Goldilocks" narrative was what ultimately underpinned the low vol. regime in 2017 which allowed for the proliferation of all the various carry trades and virtuous loops that kept cross-asset volatility suppressed.
Clearly, global trade frictions are serving to heighten fears about the trajectory of global growth and the prospect of tariffs is raising concerns about inflation, although as ever, there are structural disinflationary forces pushing in the opposite direction.
The overarching point here is that if you're looking for reasons why (almost) nothing is performing well in 2018, a simple explanation is that USD "cash" is rapidly becoming viable again and developed market central banks are buying less assets. Not much of a mystery, really.
The bad news is that it's difficult to postulate a scenario where those two bearish forces for risk assets don't continue largely unabated, short of a serious global slowdown which prompts central banks to rethink their normalization plans.
For now, I'll leave you with one last chart which shows you how the S&P typically performs when ISM is falling and CPI is rising.
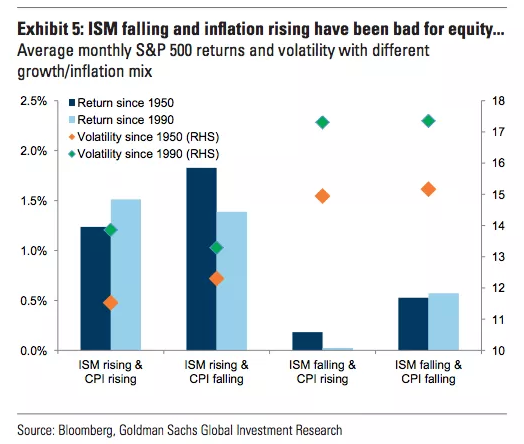 (Goldman)
0 comments:
Publicar un comentario