The S&P 500 Will Push The Federal Reserve Too Far
by: Eric Basmajian
Summary
- The S&P 500 continues to rise which has been overshadowing some slowing growth trends and aggressive monetary policy.
- Monetary policy is biting more than investors are giving credit.
- Further monetary policy tightening will exacerbate the slowing trends and put the economy in a vulnerable place come 2019.
- The S&P 500 is giving investors and the Federal Reserve a false sense of confidence.
- Monetary policy is biting more than investors are giving credit.
- Further monetary policy tightening will exacerbate the slowing trends and put the economy in a vulnerable place come 2019.
- The S&P 500 is giving investors and the Federal Reserve a false sense of confidence.
The S&P 500 Will Push The Federal Reserve Too Far
With both criteria of the Federal Reserve's dual mandate sufficiently fulfilled and the S&P 500 continuing to rise, it is hard to argue against additional tightening measures from the Central Bank.
Using history as our guide, the Federal Reserve will forgo further tightening measures when market volatility rises despite having two check marks next to their dual mandate. Over the past ten years, inflation reached a high of 3.8% in 2011 and 2.14% in 2014 along with continual new lows in the unemployment rate, but this data never caused the Federal Reserve to tighten monetary policy. It is not speculation to claim the Federal Reserve is S&P 500 dependent (along with data dependent) as a handful of Federal Reserve board members, as well as Janet Yellen, former Federal Reserve Chairman, have made on the record comments regarding asset price levels.
The Federal Reserve is likely to continue to tighten monetary policy if asset prices remain elevated. A pause to monetary policy actions will come first from market volatility before a data-driven response because, as I will show below, monetary policy is far more aggressive than most realize.
I will make the case below that the Federal Reserve has already tightened monetary policy too far based on the economic data but the continued rise in the S&P 500 will push monetary policy past the point of no return. Monetary policy acts with a significant lag, up to one year after a tightening or easing action, so monetary moves today will be felt in the economy in the latter part of 2019.
Below we will look at the monetary and bank aggregates including the monetary base, M1 & M2, bank asset growth, bank credit growth, and a host of other data points to prove that monetary policy is already starting to bite.
Monetary policy has likely already gone too far. It will take up to one year from the last tightening act for the full effects to impact the banking system and the economy. By the time the S&P 500 responds, such aggressive policy will be hard to reverse when the economy needs it most.
Current Monetary Policy
Before outlining the various data points that demonstrate the degree of monetary tightening, a brief outline of the current policy is appropriate.
In addition to raising the Federal Funds rate, the Federal Reserve is also unwinding their balance sheet in a process commonly known as "Quantitative Tightening"(QT), the sister of Quantitative Easing (QE).
The Federal Reserve has raised the Federal Funds rate seven times, and the market is currently assessing a greater than 80% probability that two more 25 basis point interest rates hikes will occur by the end of 2018.
The Federal Reserve has also increased the pace of QT several times and will reach a peak rate of $50 billion per month in asset sales by Q4.
All Federal Reserve Banks: Total Assets:
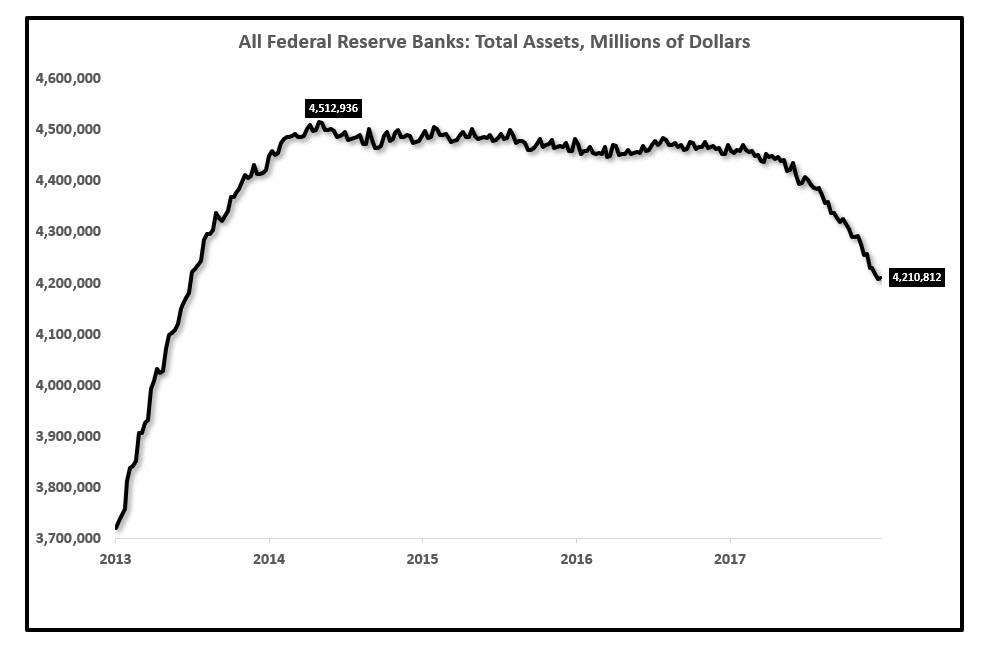
Source: Federal Reserve, EPB Macro Research
The balance sheet of the Federal Reserve is down roughly $305 billion from the peak in January of 2015.
Both actions, interest rate increases, and QT are having very severe impacts to monetary and credit aggregates which will flow through to the economy, likely by the second half of 2019. As we move through the impacts in the monetary aggregates as well as the banking system, it is important to understand monetary policy is biting with just a $305 billion reduction in the Federal Reserve balance sheet. Let's take a look at the impact to the monetary aggregates.
Impact To The Monetary Aggregates
The process of monetary change starts with the Monetary Base or "high powered money." The monetary base has been in sharp contraction as the Federal Reserve tightens monetary policy. The monetary base is down roughly $500 billion from the peak at the end of 2014 and is contracting a current rate of 8.3% year over year.
Monetary Base In Millions (LEFT) | Monetary Base Year over Year Change (RIGHT):
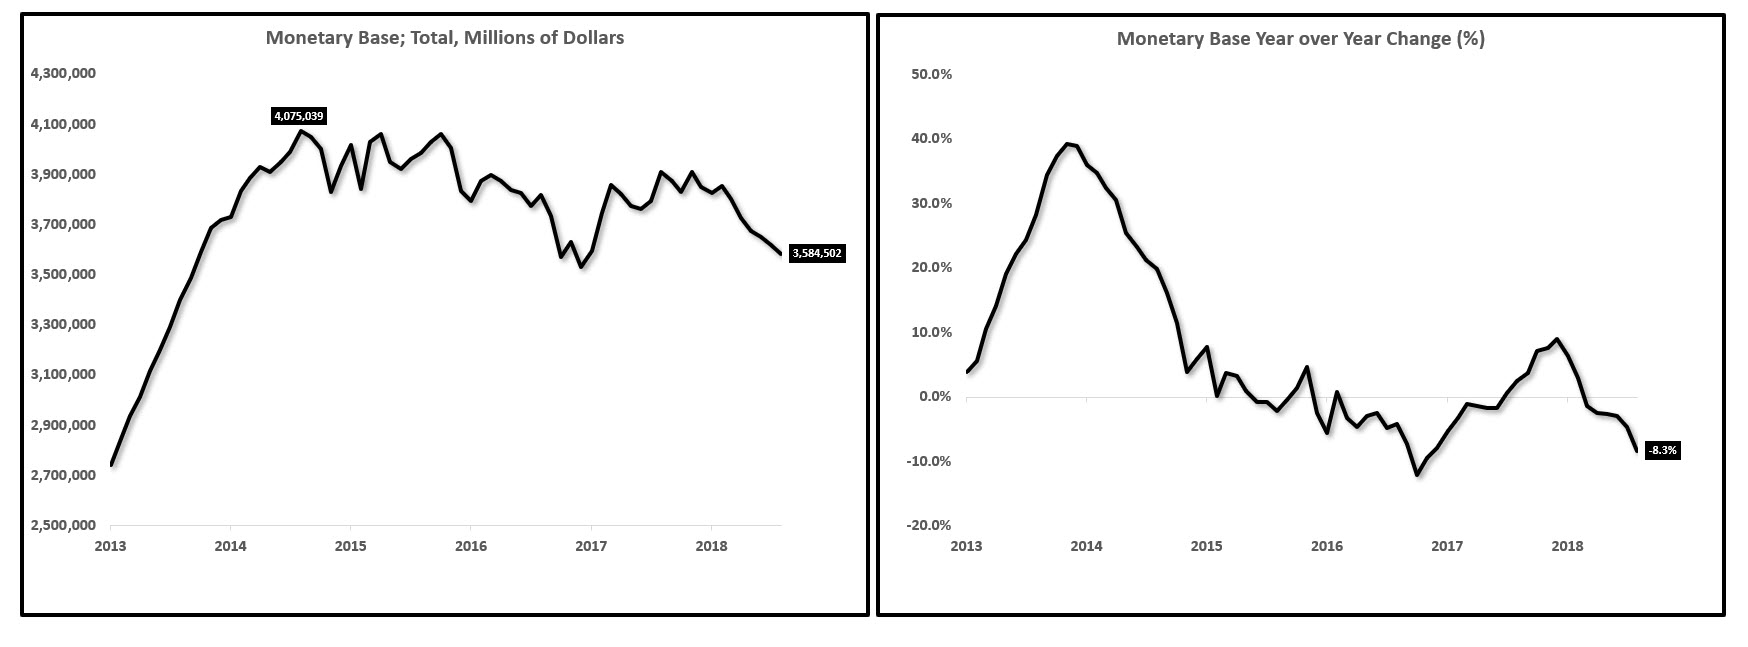
Source: Federal Reserve, EPB Macro Research
The monetary base multiplied by the money multiplier or "little m" results in the broad money supply or "M2". The growth rate in M2 + the growth rate in the velocity of money equals nominal GDP growth, so the trending direction in the growth rate of the money supply provides critical information to the future direction of GDP growth.
In order to relate the changes in the money supply to real GDP growth, we must deflate the money supply by the Consumer Price Index to arrive at real M1 and real M2. M1 is a better leading indicator of economic activity than M2 and makes up a majority of M2, so a look at real M1 will be used for a proxy on the trending direction of the money supply. After deflating M1 by the Consumer Price Index, we can start to understand the severity of the contraction in monetary policy.
Real M1 Growth Year over Year (M1 Deflated By CPI):
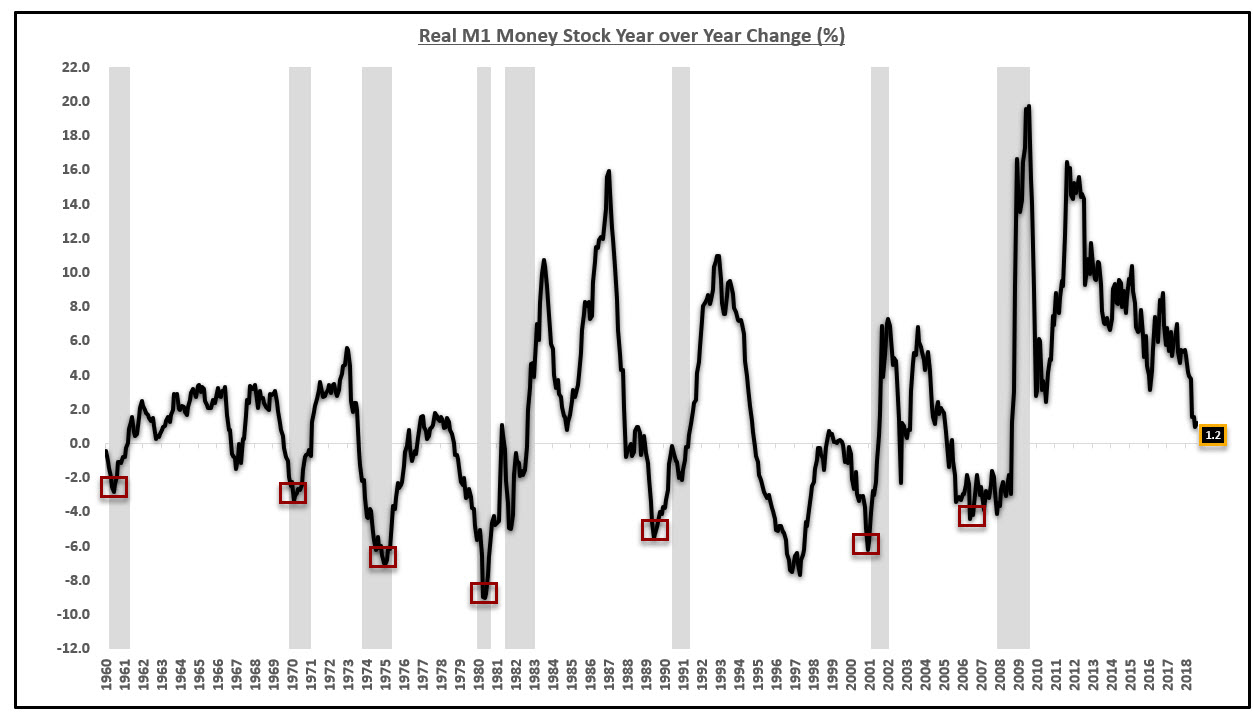
Source: Federal Reserve, EPB Macro Research
The real rate of M1 growth has plunged in recent months (due to contractionary monetary policy) down to a rate of 1.2% year over year.
I do not want to cloudy the waters and make this into a recession forecast, but I would also be remiss not mention that the rate of real M1 growth turned negative in or preceding the past eight recessions.
With rates of money supply growth that are in freefall, the outlook for future growth is bleak. Monetary policy from the Federal Reserve is clearly biting. If monetary policy is the reason for the declines in the money supply, then further tightening actions will continue this trend and put M1 growth squarely in negative territory.
With money supply growth being half the equation of GDP growth, how can growth continue to be accelerating?
Growth has continued to rise in GDP terms due to a recent bump higher in the velocity of money. The velocity of money has been in a secular decline for structural reasons and will undoubtedly continue to remain low. One-off fiscal stimulus in conjunction with natural disaster spending from 2017 has caused a short-term bump in the velocity of money but without perpetual stimulus in larger magnitudes, the velocity of money will revert to trend, and the growth rate of the economy will then be in a decline that mirrors the collapse in the rate of real M1.
Velocity of Money:
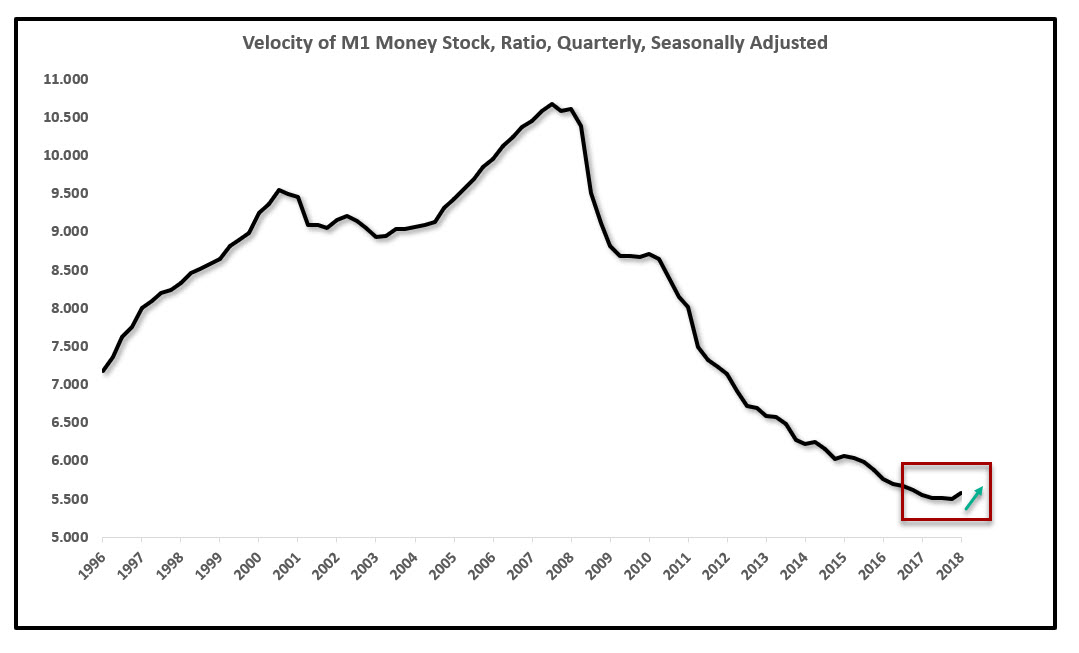
Source: Federal Reserve, EPB Macro Research
It should be abundantly clear through the monetary aggregates that tightening actions from the Federal Reserve are biting in a fairly extreme fashion. These impacts are, for the time being, overshadowed by the transitory gains in the velocity of money from fiscal stimulus and natural disaster spending. If the Federal Reserve tightens policy further, which they are almost certain to do, this will put further pressure on the growth rate of the money supply just as the effects of tax cut stimulus are leaving the economy. After the reversion to trend in the velocity of money, GDP growth will decelerate rather sharply. This is likely to occur in 2019 unless the growth rate in the money supply rises or velocity continues to accelerate, both which are unlikely events.
With the impact to the monetary aggregates fully established, let's look at how these actions have impacted the banking sector.
Impacts To The Banking Sector
The impacts to the banking sector have been much more severe than most analysts give credit and part of that is due to the rise in the S&P 500. The banking sector of the equity market has, however, dramatically underperformed due to the trends below. A revisit to the performance of the equity markets will also follow.
Excess reserves of the banking sector have declined precipitously. This comes as no surprise as excess reserves and the process of debiting and crediting those reserves is the primary tool in which the Federal Reserve controls the monetary base. Many will argue that the nominal amount of excess reserves is still plentiful, which is truthful, but it is the rate of change that matters above the nominal level of reserves, and that can be proven in the growth of various credit aggregates.
Excess Reserves Of Depository Institutions:
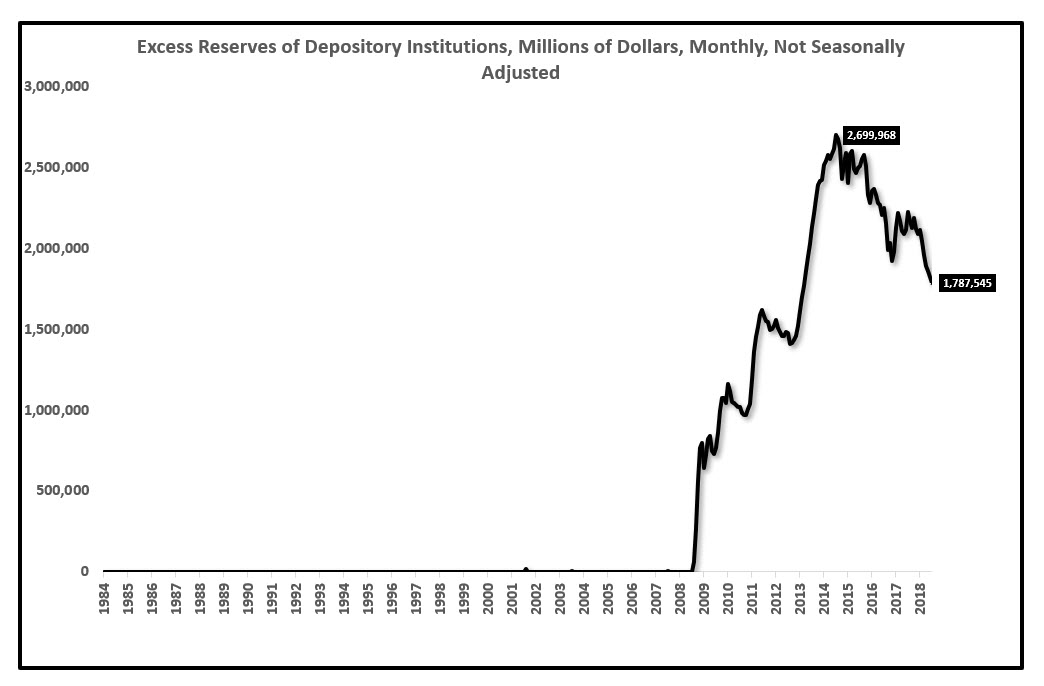
Source: Federal Reserve, EPB Macro Research
A meaningful and rapid contraction in excess reserves has reduced the liquidity of the banking system and has caused a rapid decline in the rate of bank asset growth. Cumulative bank asset growth is at the lowest level of this economic cycle.
Cumulative Bank Asset Growth (Year over Year Change):
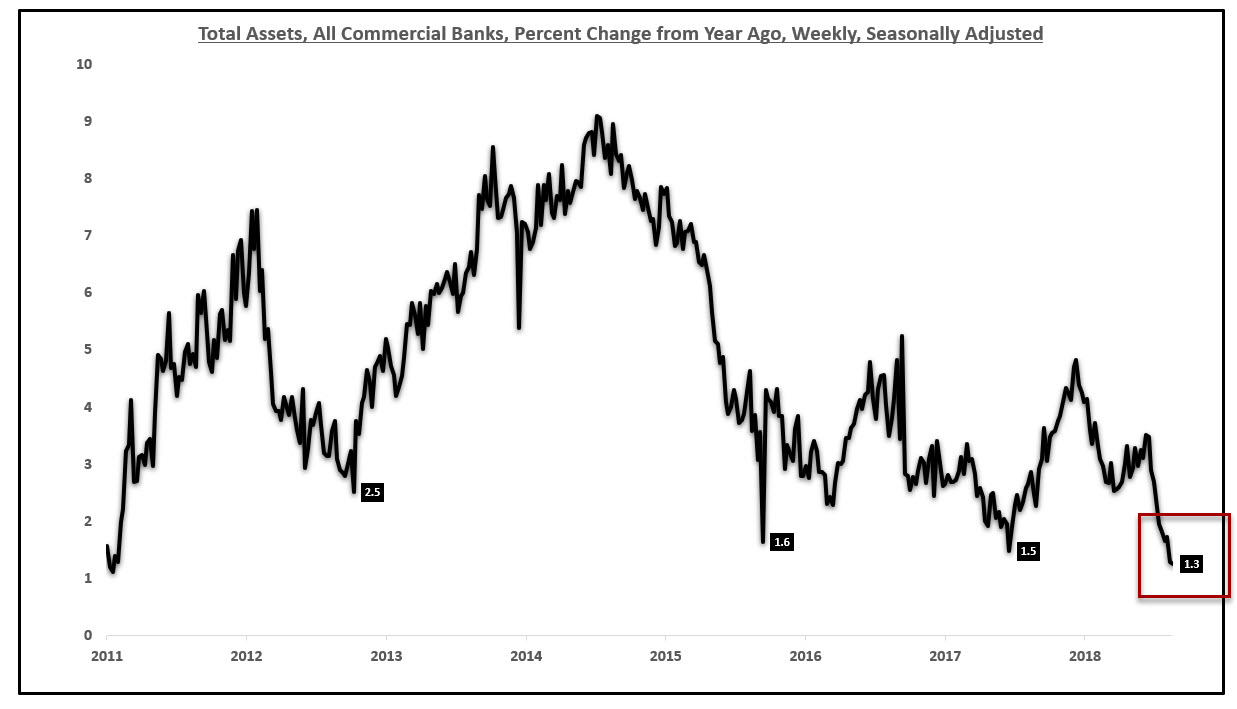
Source: Federal Reserve, EPB Macro Research
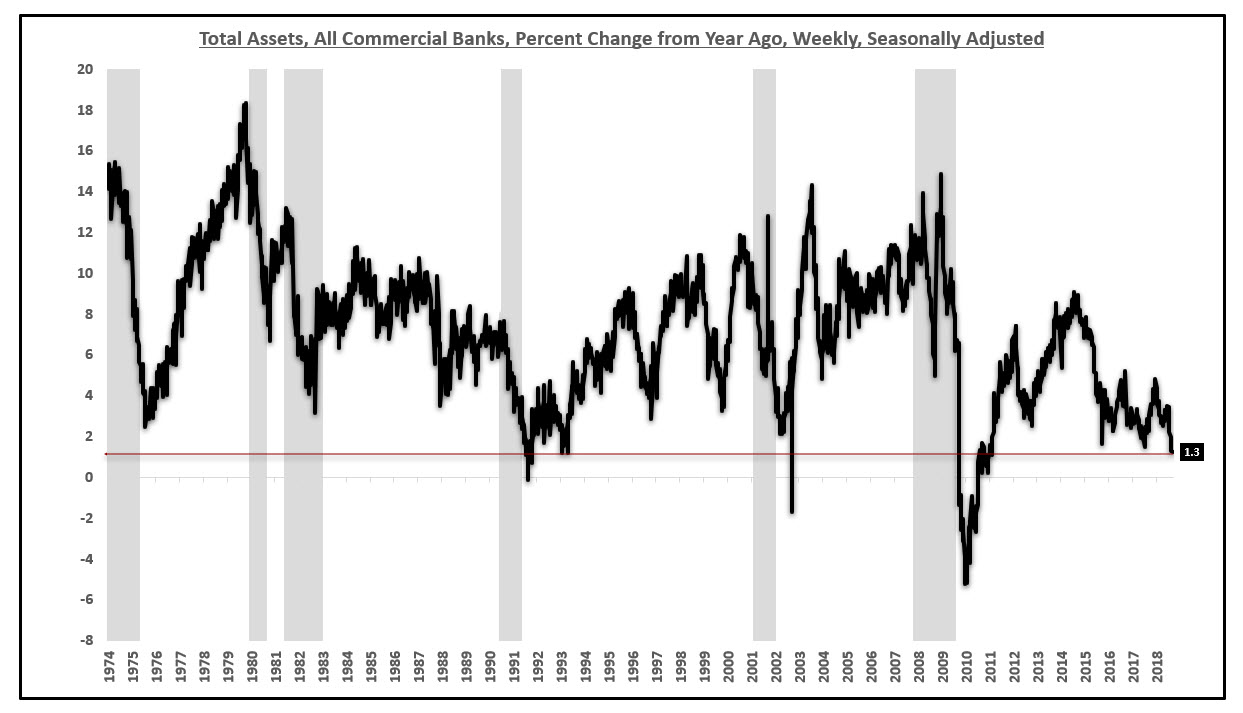
To put this decline in historical context, outside of the great recession, bank asset growth is near the lowest level since the 1970's which serves as evidence for the contractionary impact monetary policy is having on the banking system.
Cumulative Bank Asset Growth (Year over Year Change):
Source: Federal Reserve, EPB Macro Research
Furthermore, there has been a notable reduction in aggregate bank credit growth starting, unsurprisingly, at the time of aggressive monetary tightening from the Federal Reserve. Bank credit growth, that is total bank loans + total bank securities, has been cut in half from 2016 to today.
Bank Credit Growth (Loan + Securities):
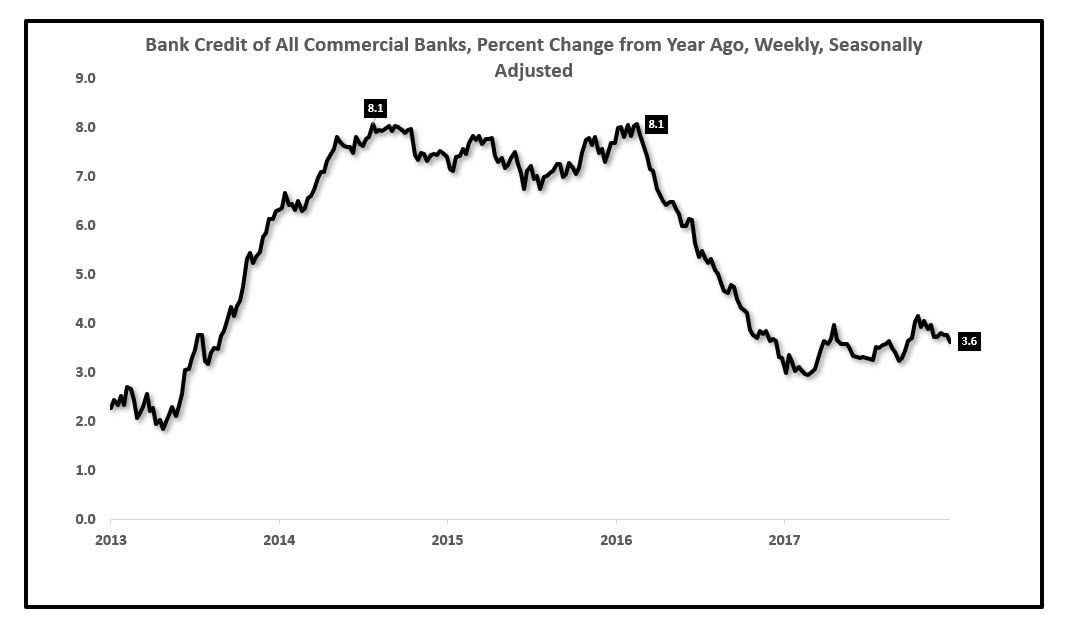
Source: Federal Reserve, EPB Macro Research
The economy will not be able to sustain above trend growth rates with bank credit expansion at half the rate of previous years.
It is also worth noting that cumulative bank credit growth is also at a multi-decade low excluding the great recession.
Bank Credit Growth (Loan + Securities):
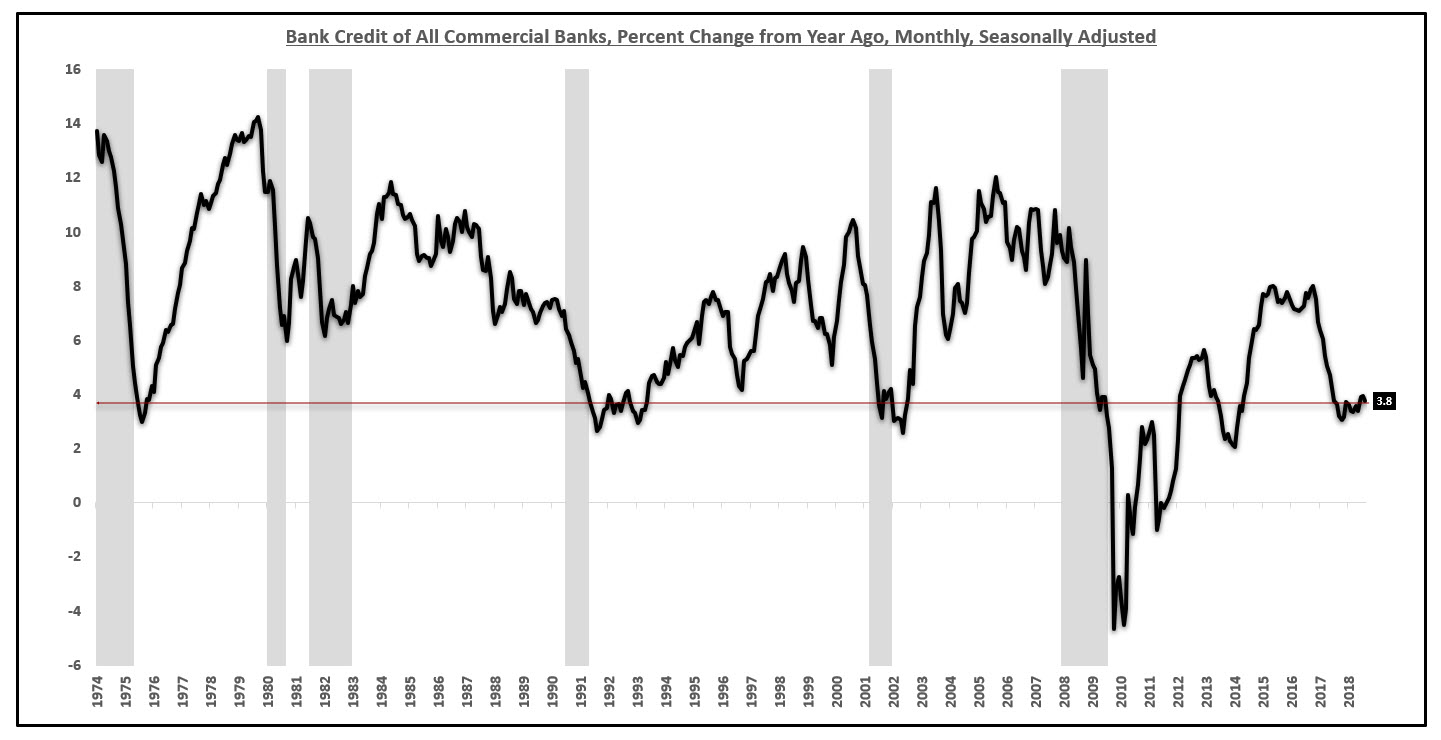
Source: Federal Reserve, EPB Macro Research
Of the various categories that comprise the $9 trillion bank lending industry including commercial and industrial loans, consumer loans and real estate loans, it is real estate loans that is the largest at $4.3 trillion. Real estate loan growth has fallen off dramatically as the Federal Reserve has contracted monetary policy further providing evidence for the effects of tightening rippling through the economy.
Real Estate Loan Growth:
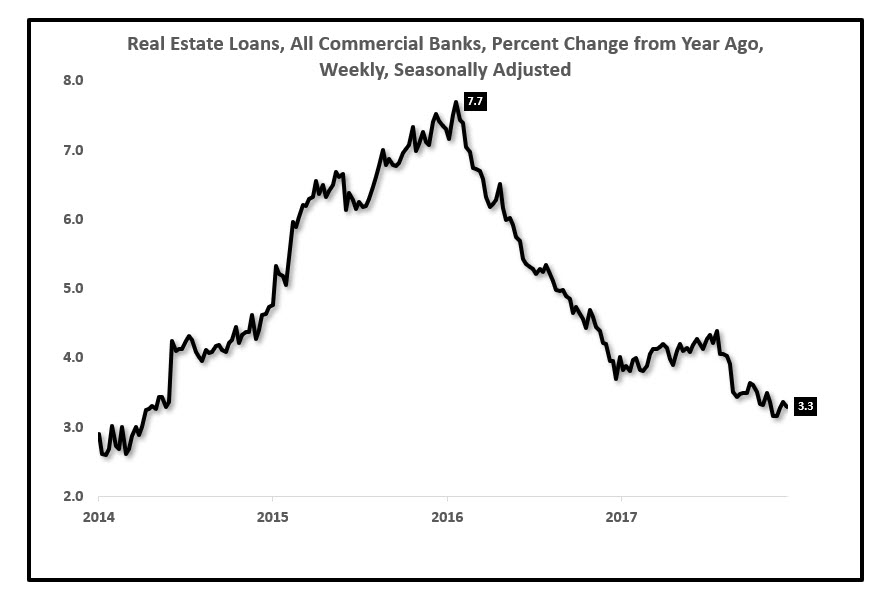
Source: Federal Reserve, EPB Macro Research
Real estate loan growth has also been cut more than in half since the contractionary policy of the Federal Reserve began.
Higher short-term interest rates, reduced liquidity in the banking system via a reduction in reserves as well as a flattening yield curve have all pressured bank asset growth, bank credit growth and various sectors of bank loan growth.
The yield curve has flattened rather significantly in recent months. Many ignore this indicator unless an inversion occurs but, again, it is the rate of change that matters more than the nominal level of the curve. The yield curve also has not inverted before every recession, only those in the post-war period but the curve has had a significant flattening before every recession.
The marginal changes in the yield curve, steeper or flatter should be monitored for changes in lending conditions as well as the profitability of any institution that borrows short and lends long as the banking sector and shadow banking sector do.
The spread between the 30-year Treasury Yield and the 2-year Treasury yield is nearly at a cycle low of 40 basis points and very flat by any historical standard.
30-2 Spread:
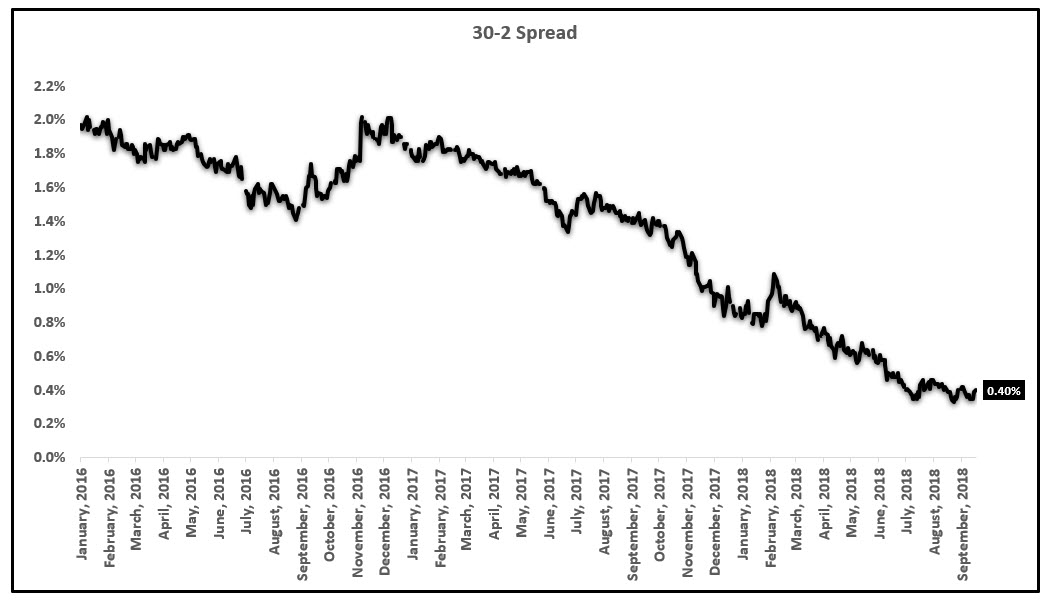
Source: Bloomberg, EPB Macro Research
All of this information regarding the banking sector and the rate of change decline in growth is useful but many will simply point to the S&P 500 for evidence to the contrary.
When looking beneath the surface to pockets of the broad equity market, sectors have taken notice of these events and cyclical changes in the banking system.
Financial stocks and regional bank stocks have dramatically underperformed the broader market proving the validity of these measures on the health of the banking system. If these measures were irrelevant, financial stocks would be joining the broader market to new highs yet that is not the case.
The financial sector, represented by ETF (XLF) and the regional bank sector, represented by ETF (KRE) have been at the bottom of the list regarding equity sector performance, remaining 3%-4% below their January high while the S&P 500 continues to break récords.
XLF & KRE Still Below January 2018 High:
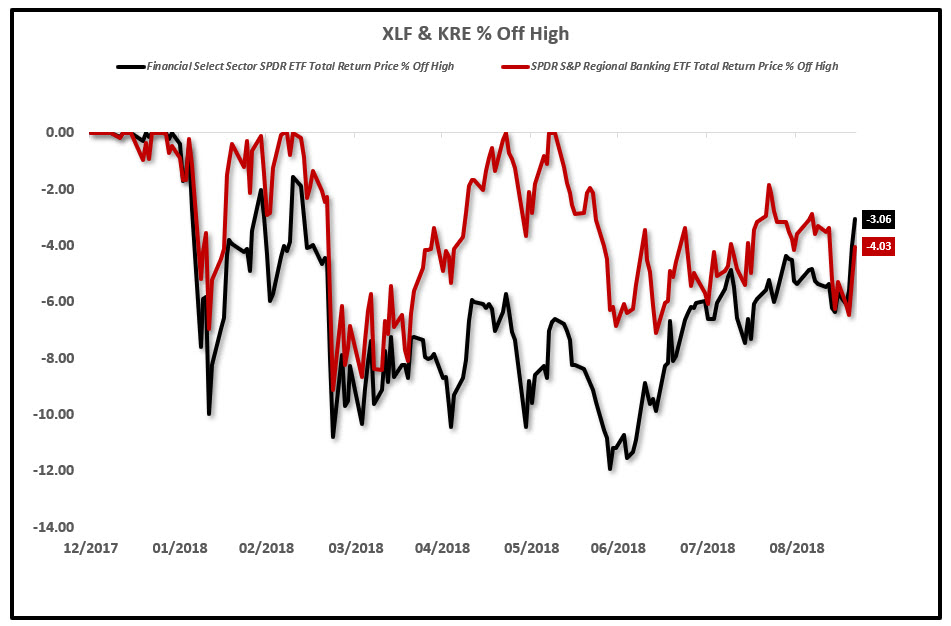
Source: Bloomberg, EPB Macro Research
The relative performance spread between XLF and the S&P 500 also confirms that the banking sector has started to radically underperform as monetary policy gets ever more constrictive and the yield curve gets increasingly flatter.
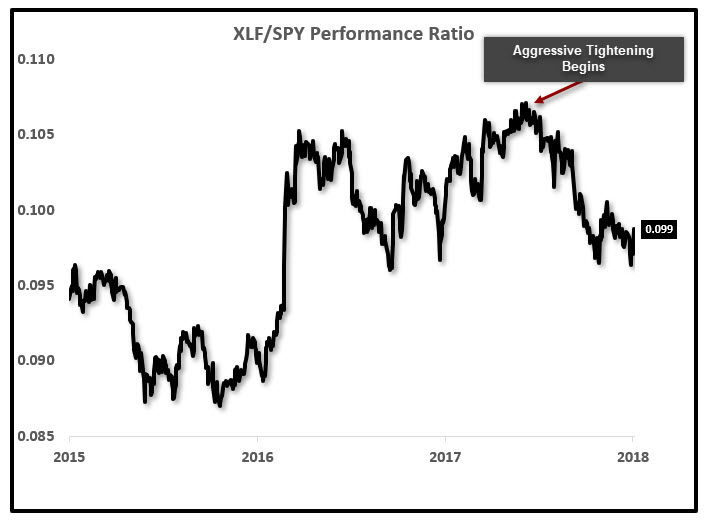
Source: Bloomberg, EPB Macro Research
The impact to monetary measures covered in section one as well as the contractionary impact on the growth rate of various bank and credit aggregates is relatively dramatic given how little tightening has been done from a historical context.
Further tightening from the Federal Reserve will exacerbate the trends described above including pushing the real money stock growth into negative territory, reducing bank asset growth below 1% on a year over year basis and flirting with an inverted yield curve.
If the Federal Reserve, investors and analysts alike continue to watch the S&P 500 for the tell-all sign of the economy without regard to the underlying trends that are developing due to overaggressive monetary policy, the Federal Reserves risks tightening the economy into a recession.
There are several effects that have caused the growth rate to move above trend in the short-term such as tax cuts, natural disaster spending, and the "pull-forward" effect from new tariff policy, which will be covered very briefly in the next section, that are clouding investor judgment regarding the true health of the economy and the impacts of monetary tightening.
At the risk of excessive length, it is worth one more section to take an under the hood look at the last quarterly report of Gross Domestic Product for confirmation of the trends in the pockets of the economy that are typically leading indicators.
Under The Hood Of GDP & Consumer Spending: More Than What Meets The Eye
When looking at more common economic indicators, there are pockets of the economy that lead or set the trend, areas that move in tandem with the trend and finally those sectors that lag the trend.
The sectors that often lead the trend are the big-ticket consumer items such as housing and durable goods consumer spending.
Housing and vehicle sales are the two largest items in the consumer spending basket and the first to take a downturn when the economy slows.
Before diving into those sectors from the GDP report, I want to touch on the 4% growth rate figure that excited many investors.
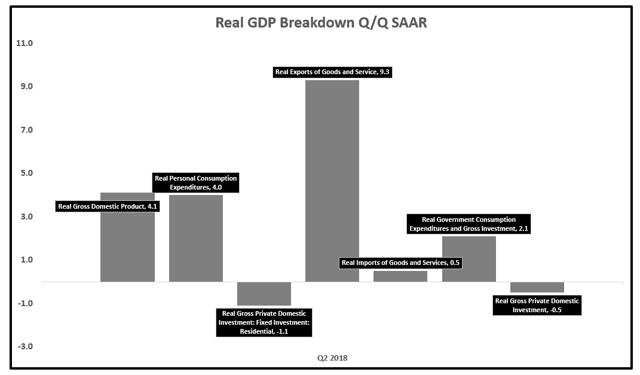
Exports, specifically soybeans, exploded in Q2 as consumers and businesses tried to lock in old prices before the new tariff policy set in.
The result of this was an over 9% surge in exports on a quarterly basis which accounted for a large portion of the above trend growth rate that we saw in Q2.
Exports Led Q2 GDP Growth:

Source: BEA, EPB Macro Research
With that out of the way, we can now look at the housing component of GDP growth, called "Fixed Residential Investment" and the subcomponent of consumer spending, "Durable goods."
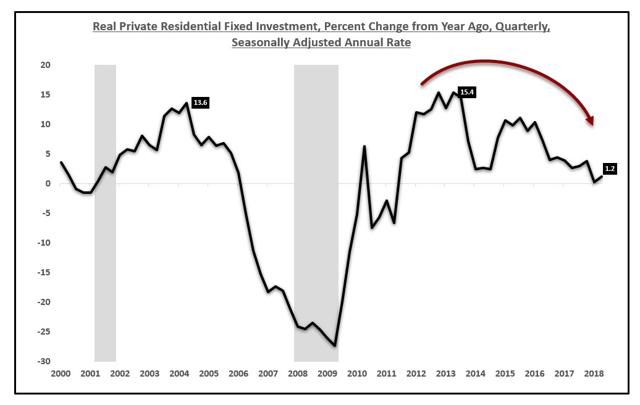
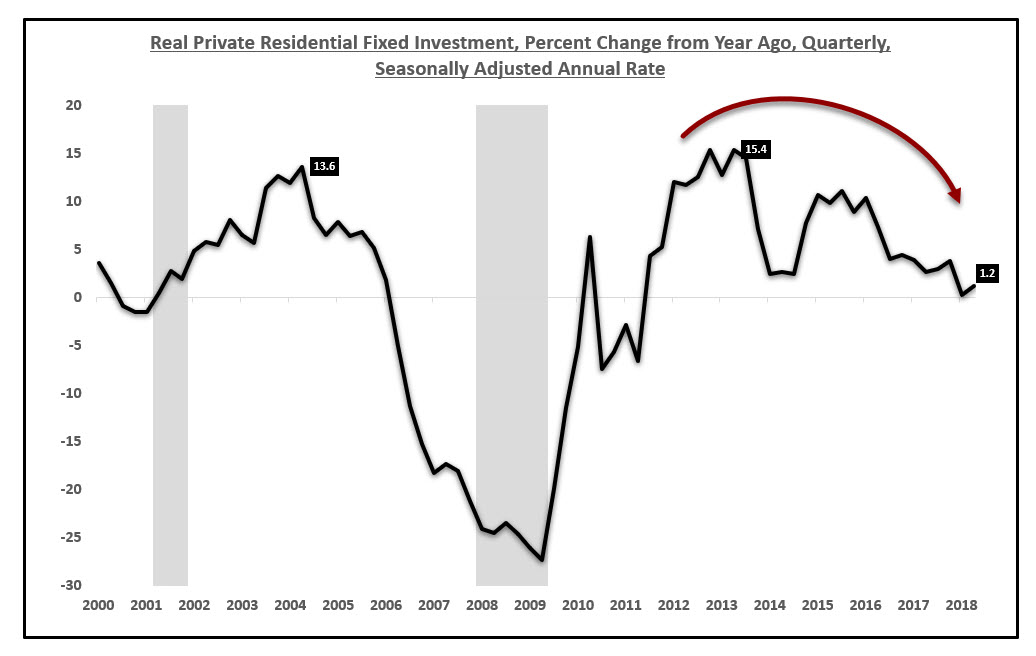
Fixed residential investment is a volatile segment of GDP and often leads in terms of the rate of change in growth.
Residential fixed investment growth peaked in 2004 and 1998 in the past two economic cycles, far in advance of any declines in headline numbers.
Residential fixed investment grew at 1.2% year over year and -1.6% on a quarterly basis in Q2, quite a different story than the 4.1% growth report that came across the headlines.
Again, this data is not to serve as a call for a recession as that still may be years away but simply to outline that the economy is responding to Federal Reserve tightening and is contracting in the leading segments of the business cycle.
Residential Fixed Investment Year over Year Growth (%):
Source: BEA, EPB Macro Research
There is a plethora of high-frequency housing data such as building permits, housing starts, existing home sales and pending home sales that are in contractionary territory on a year over year basis and confirm this trend but that is for another research note.
Continuing the theme that the big-ticket items lead the economic cycle, we can break down the consumer spending basket into three parts as the Bureau of Economic Analysis does: Services, Non-durables, and Durables.
The only volatile component to these three buckets is the durables basket as this is comprised of autos, home appliances, and heavy duty items. Services and non-durables which are made up of medical equipment, food and clothing are significantly less volatile and are more non-discretionary ítems.
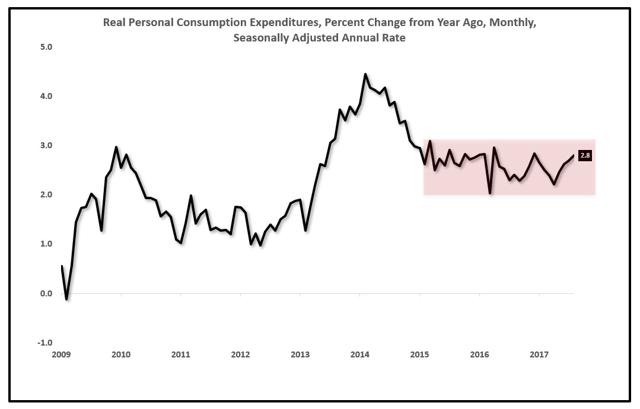
Before showing the chart on the durable goods component of spending, the entire trend of consumer spending, which accounts for 70% of GDP is very telling. While the economy has supposedly been experiencing a "boom", 70% of GDP growth has been flat since 2016.
Total consumer spending growth has not accelerated at all and has been nearly unchanged for the past three years at 2.8% year over year.
Real Personal Consumption Growth:

Source: BEA, EPB Macro Research
It is very clear that the above trend move in GDP growth has been from one-off or transitory factors as the bulk, or 70% of GDP growth, has been relatively unchanged since 2016, despite the rise in stock markets globally.
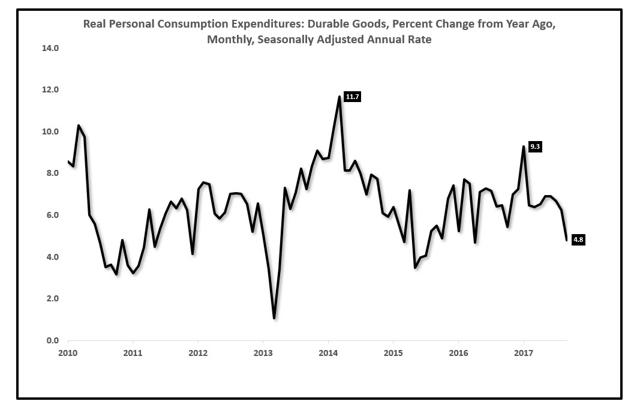
When we break down this 70% figure into the three baskets and look at durable goods spending, the most volatile and leading of the three segments, we can clearly see the consumer is slowing.
The durable goods basket of real personal consumption is growing at 4.8% year over year, down from 9.3% in November of 2017 and down from 11.7% in January of 2015. There is a very clear and defined trend of slowing in the durable goods basket of personal consumption which corroborates the leading housing data.
Real Personal Consumption Growth: Durable Goods Only:

Source: BEA, EPB Macro Research
When taking a look under the hood at some of the key data points that typically get reported, a stealth slowdown is underway.
Summary
Contracting monetary policy further will exacerbate these trends which should already be showing up as slower GDP figures if it were not for one-off events such as massive export growth to beat the tariffs.
The big-ticket items in the consumer basket are empirically slowing, and the trend for the economy is set as lower until evidence disputes this notion.
If the above data continues to move in the same direction as I expect, especially if the Federal Reserve proceeds with more tightening measures, the next place we will start to see the slowdown emerge is in the average workweek (average weekly hours), as well as various employment trends.
A very common sign of a late cycle slowdown is the mismatch between consumer spending and business inventory growth. When consumer spending slows as business inventory accelerates (as it is today) this sets up for sharp GDP declines in the quarters ahead due to the liquidation of that excess inventory.
Monetary policy has already started to bite and has caused key leading areas of the economy to begin to decelerate. Without further monetary action from the Federal Reserve, these trends are likely to continue as there is a lagged effect still to come from previous tightening actions.
If the Federal Reserve decides to get more aggressive with monetary tightening in an attempt to cool asset prices, there is a serious risk that they overtighten and the economy slows sharply in 2019.
Once the effect from tax cuts, natural disaster spending from the 2017 hurricanes and "pull-forward" growth from exports dissipates and the velocity of money returns to trend, the economy will have to face collapsing levels of money supply growth, nearly 1% in real terms.
It appears the Federal Reserve is going to tighten policy too far.
As of Q2 2018, the current year over year growth rate is 2.9%. Given the above trends, this rate will cool significantly as we move into 2019.
The S&P 500 will push the Federal Reserve too far. It likely has already happened.
0 comments:
Publicar un comentario