Gold Is Melting: Why This Is No Time To Panic
by: Victor Dergunov
- Gold has been dented in recent months, crashing by nearly 15% from peak to trough in just 4 months.
- Several key elements are supporting and driving the dollar higher. However, this is very likely just a short-term phenomenon.
- Longer term, the dollar essentially has nowhere to go but lower relative to gold.
- The COT report is illustrating extraordinary bearishness in gold, showing net positions at their second-lowest level in 10 years, behind only the 2015 bottom.
- There's no need to panic, gold has declined by 15%. This is likely a healthy correction, not the start of a bear market, and certainly not the end of the world.

Source: MoneyControl.com
Gold Is Melting: Why This Is No Time To Panic
Gold/SPDR Gold Shares (GLD) is going thorough one of its most vicious selloffs in years. The yellow metal is essentially melting, down the last 9 out of 10 weeks, and from peak to trough has cratered from almost $1,370 in April to just around $1,165 in recent days. This represents a 15% retracement in just 4 months - rather extraordinary for an asset traditionally considered to be a stable safe haven and store of value by many investors.
Gold 1-Year Chart
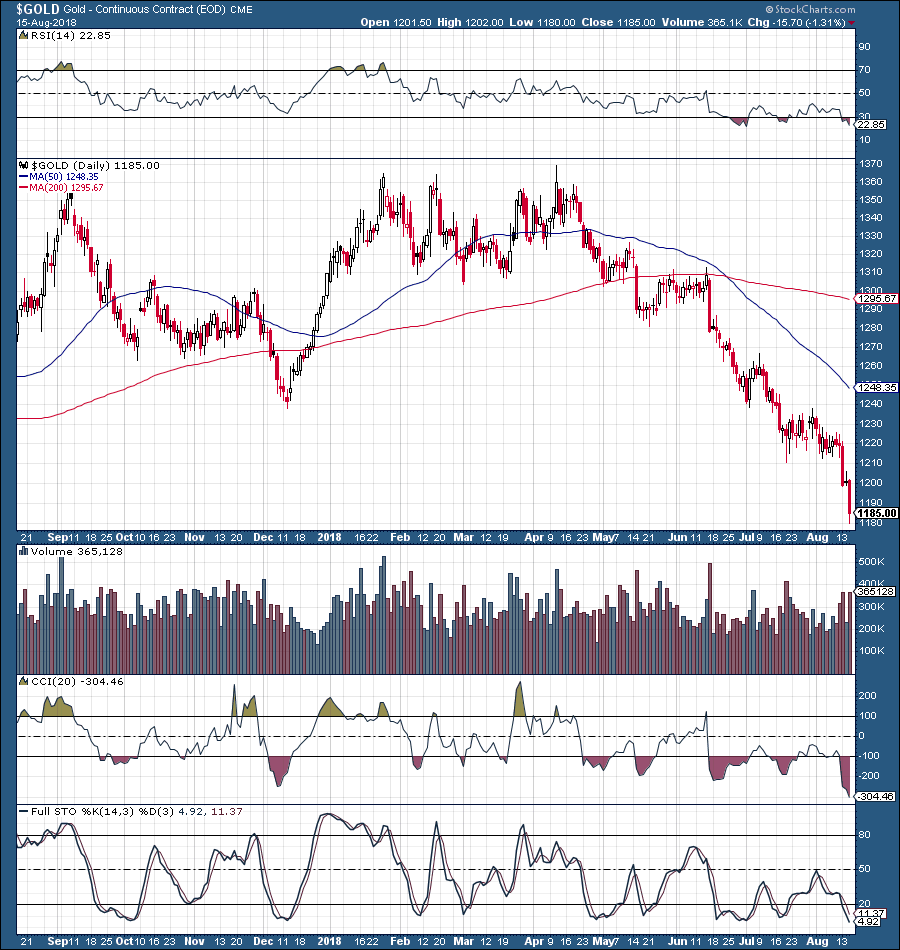
Source: StockCharts.com
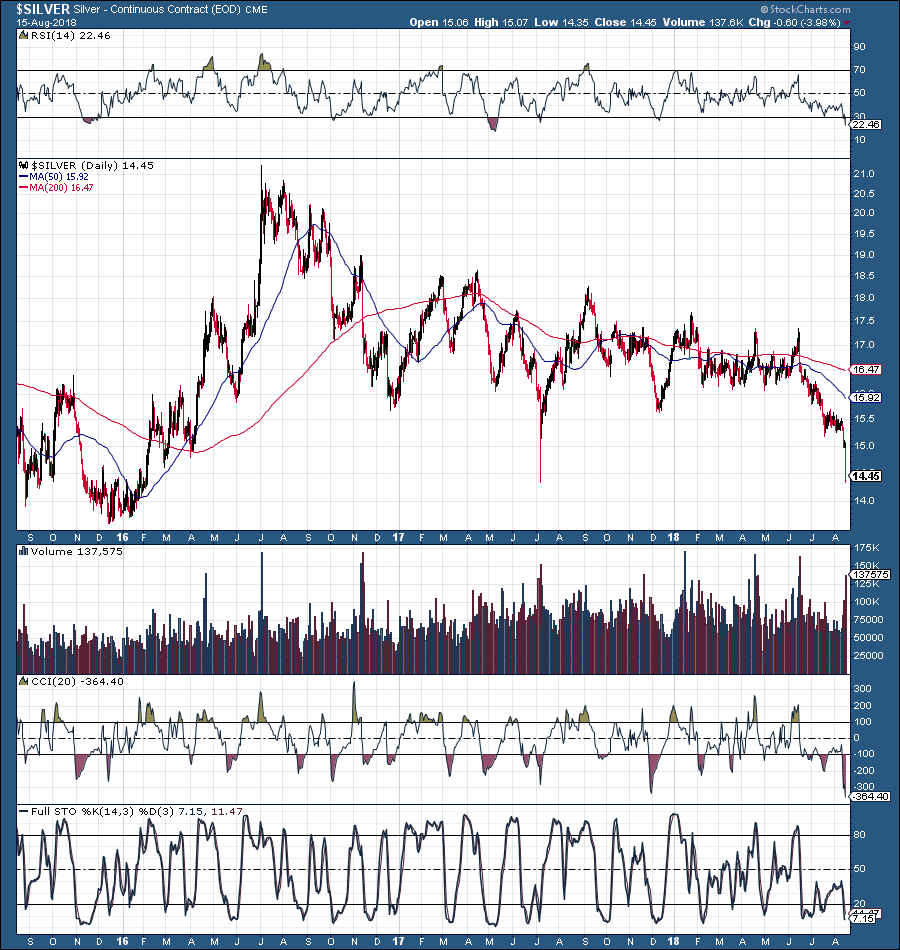
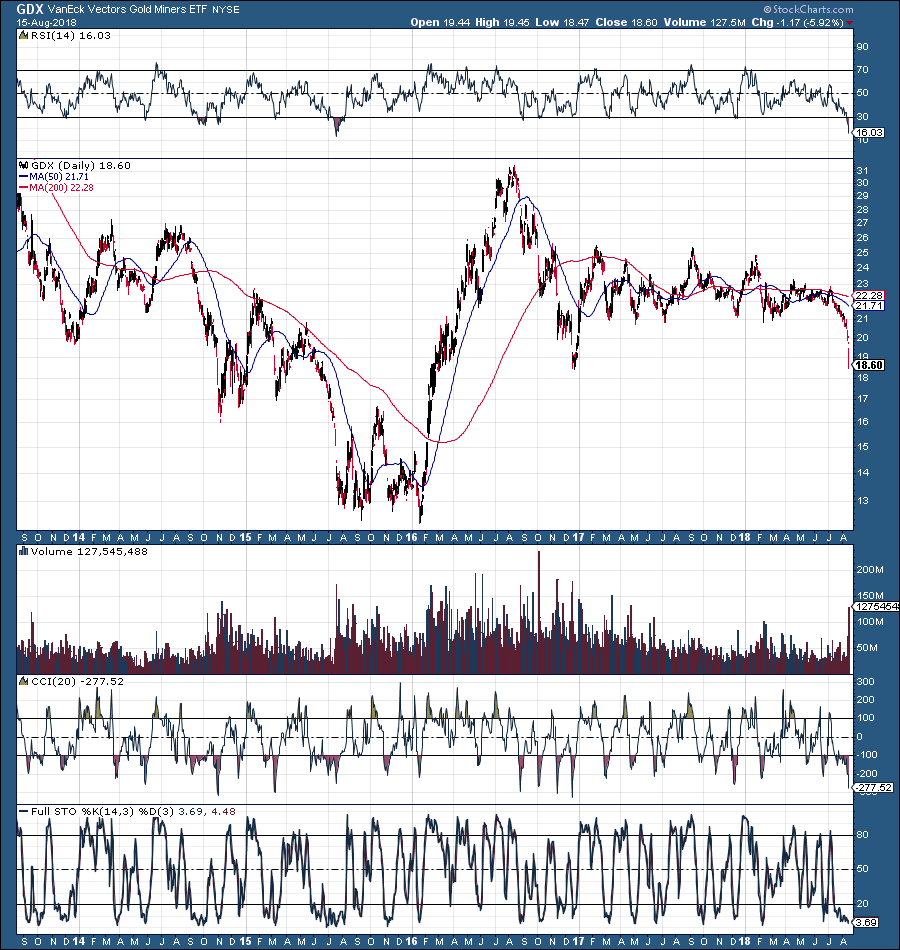
But it’s not just gold, silver/iShares Silver Trust (SLV) has cratered by about 17% in the last two months alone, with silver prices trading around the “silver flash crash” lows of last year ($14.40). In addition, silver prices are approaching the multi-year lows from the late 2015 commodities bottom ($13.50-14.00). Naturally, the gold miners/VanEck Vectors Gold Miners ETF (GDX) is also getting slammed, with the price down by nearly 20% in fewer than just 6 weeks.
Silver 3-Year Chart
GDX 5-Year Chart
So, what is it with gold and the precious metals complex in general? Why are prices essentially melting through the floor? Is this a lasting trend, the start of a new bear market perhaps? Or is this a transient phenomenon, and likely a buying opportunity instead?


About GLD
GLD is the largest, reportedly physically backed gold exchange-traded fund in the world, with roughly $31.5 billion worth of net assets. It offers market participants an efficient way to access the gold market. The ETF is an attractive alternative to trading gold futures, as it can be traded much like a stock on the NYSE Arca exchange instead of dealing with alternative exchanges and trading requirements pertaining to futures contracts.
Furthermore, it is an appealing alternative to trading physical gold, as investors get exposure to the same price action as the physical metal but can buy and sell gold with great fluidity using GLD. This way, investors bypass the inconvenience of having to take physical delivery of the asset.
Since the ETF mimics the price of gold almost identically, I will refer to GLD and gold interchangeably throughout this article.
What’s Behind the Meltdown?
Several key short-term factors have aligned together and are pushing gold prices lower. These include the Fed’s tightening policy, trade war tensions, instability in China and other emerging markets, and of course, the rising USD. The rising dollar is perhaps the main culprit in causing gold’s decline, but its strength is ultimately being supported by the factors just mentioned. Additionally, momentum and sentiment have turned extremely bearish for gold in recent weeks.
Gold is not a stock that trades on fundamentals, it has no earnings, no P/E ratio, no cash flow, etc. It is strongly influenced by shifts in investor appetite and sentiment. Furthermore, momentum begins to feed on itself, and wild swings to the upside or downside can be expected. Right now, we are clearly going through a period of overly negative sentiment and downward momentum in the gold markets.
Investors are Really Bearish on Gold
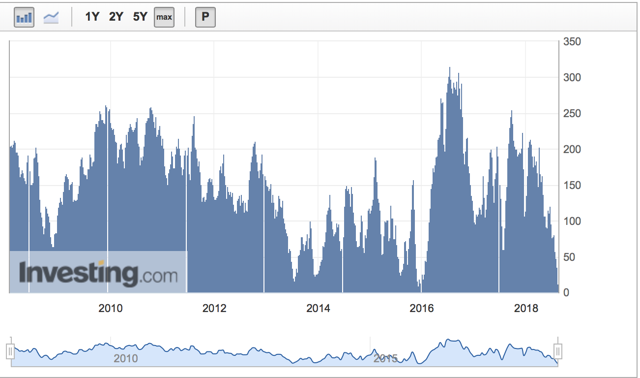
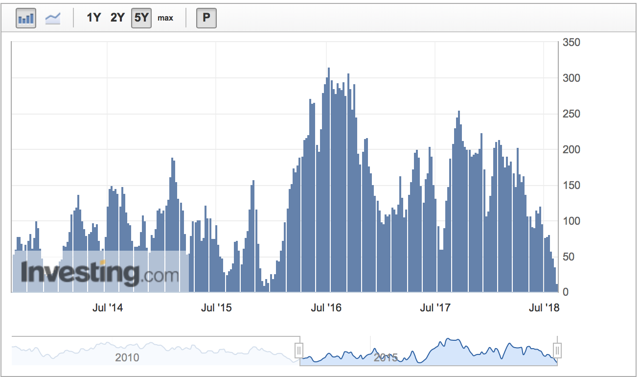
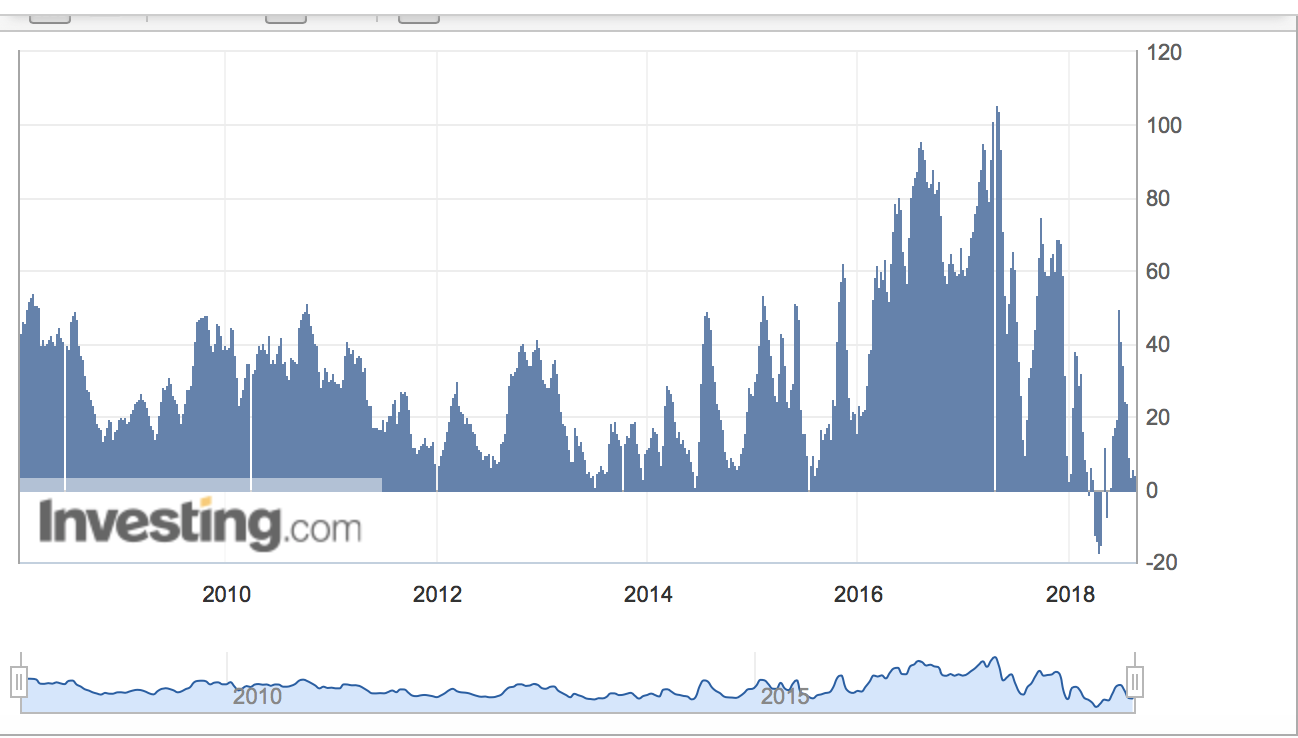
Things have gotten so bad in the gold market that investors are about as bearish on gold as they have been since the yellow metal bottomed in late 2015. This is precisely what the COT report is telling us. Gold’s speculative net positions were at just 12.7K at last count, the second-lowest level registered over the past 10 years. The only lower reading on record came in at 9.8K at the height of the gold selloff in late 2015, right as gold was bottoming at around $1,050.
Gold Net Speculative Positions


Source: Investing.com
So, could the bearish situation surrounding gold exacerbate further? It’s possible, but if history is any indicator, the extreme bearishness present in the gold markets is a great counter indicator that suggests prices are likely to stabilize and begin to recover in the near future.
Silver speculative net positions are also at an extreme level, with just 4.3K contracts at last count. Moreover, silver’s net speculative positions recently turned negative for the first time in at least 10 years. Net positions went negative, peaking at -17K contracts, indicating extreme pessimism and negative sentiment in the silver market. This essentially means that out of all the silver futures contracts, there were 17K more short contracts open than long contracts recently - a somewhat unprecedented statistic.
Silver Net Speculative Positions
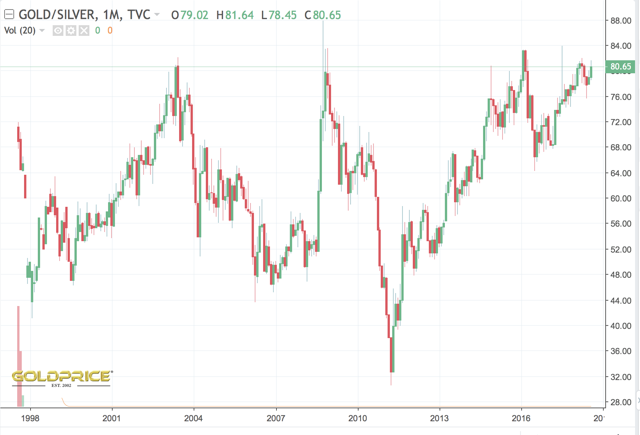
Gold-to-Silver Ratio
Another sentiment and counter indicator gauge, the gold-to-silver ratio, went above 80 recently and is currently trading around this historically high level. Generally, extremely elevated gold-to-silver ratios coincide with substantial bottoms in the gold and silver market. In fact, the last 3 times this ratio went above 80 in the last 20 years, it preceded remarkably strong gold and silver rallies in 2003, 2008 and 2016. With the gold-to-silver ratio currently above 80, we could be on the cusp of another historic gold and silver bull run.
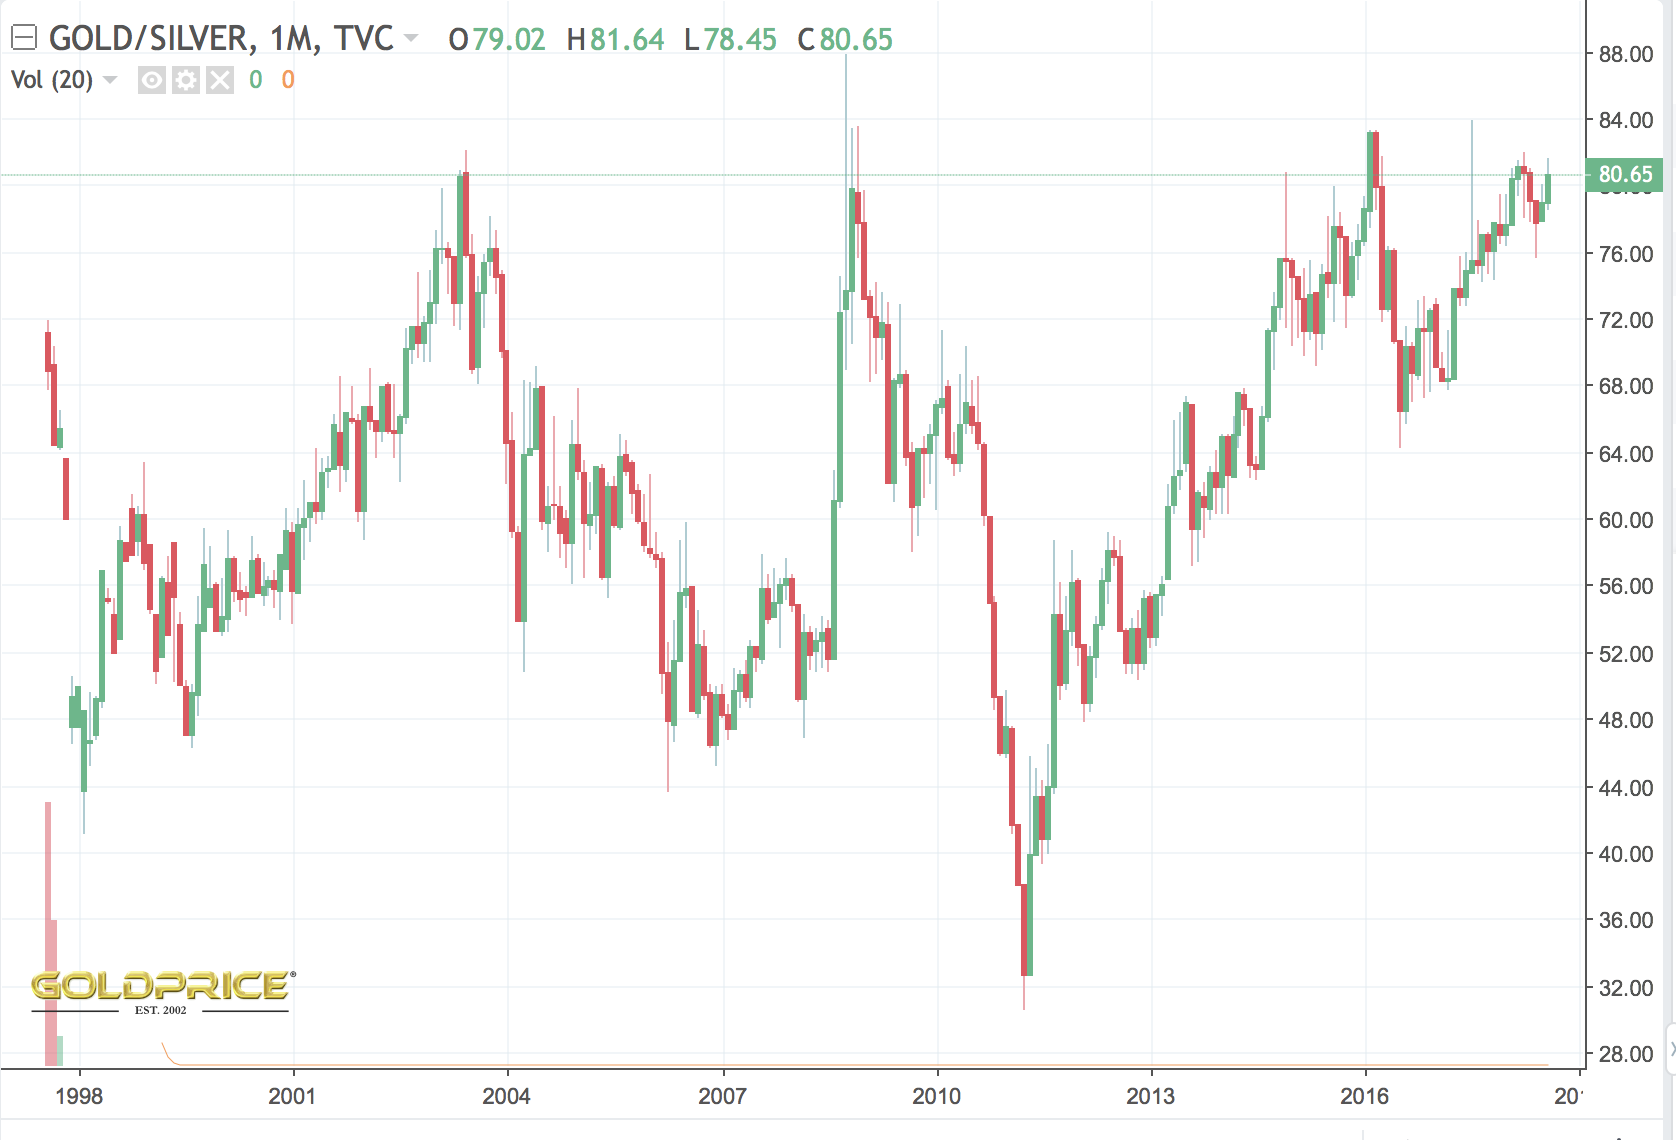
Source: GoldPrice.com
USD: Gold’s Greatest Challenge Short-Term
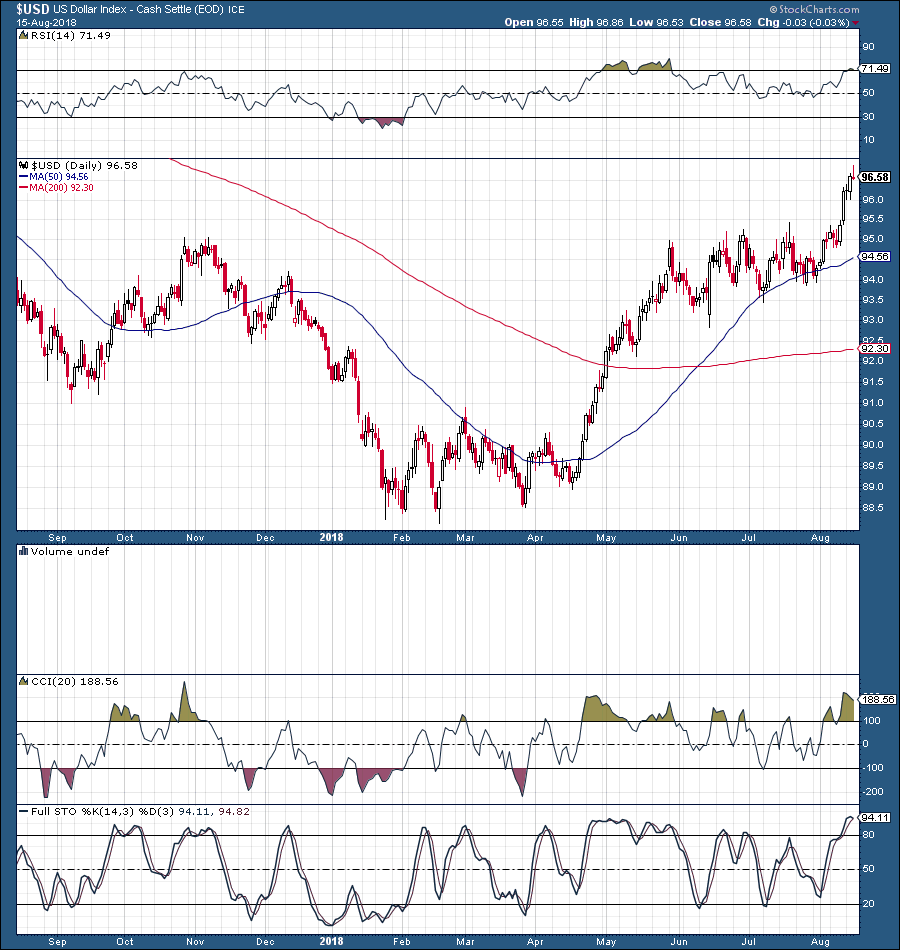
Remarkably, the dollar has surged by 10% since the lows earlier this year. In this time frame, gold has declined by about 15%, so we can see the clear inverse relationship at work here. However, even by just looking at gold’s disproportionate decline relative to the USD, it appears that the gold selloff is likely overdone now. Nevertheless, oversold conditions, Fed tightening, trade tensions, instability in EMs and other factors have come together to create a powerful storm favorable for the dollar in the short term.
USD 1-Year
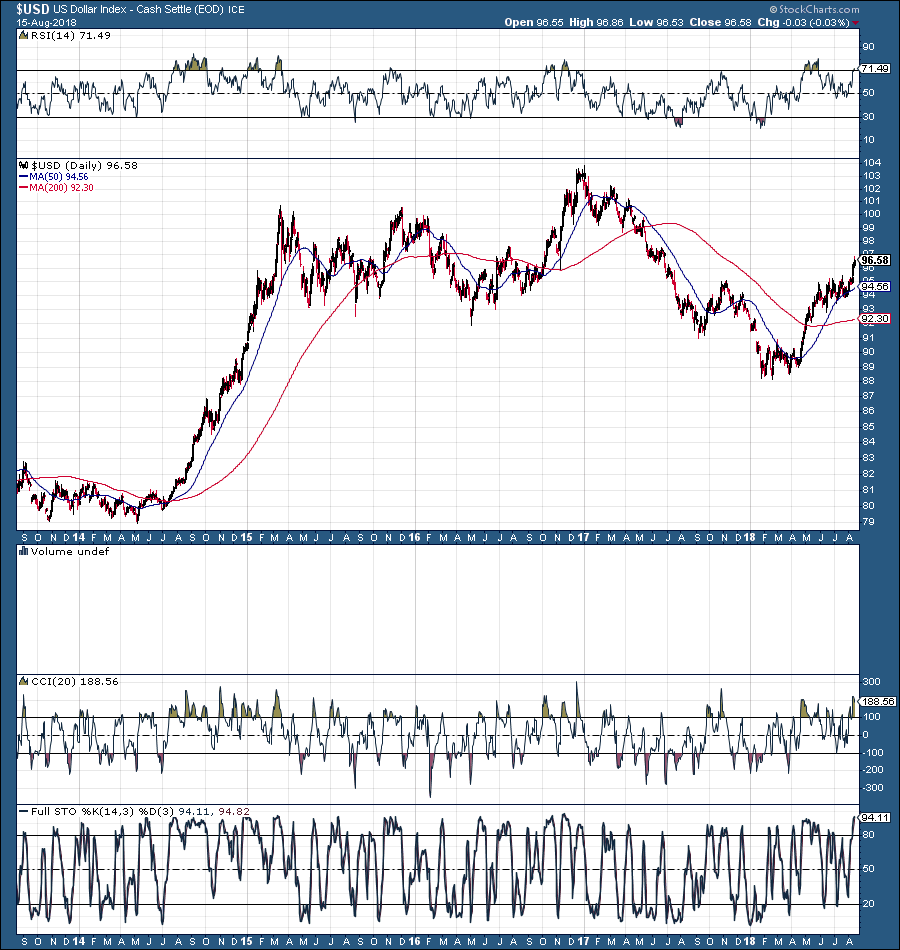
USD 5-Year
Longer Term the Dollar Will Likely Only Go Lower
Conversely, longer-term the positive thesis for the dollar begins to breakdown substantially, which is very bullish for gold. First and foremost, the Fed’s tightening path is likely to slow significantly going forward. In fact, there is about a 75% chance that the Fed funds rate will be just 0.75% higher after the 2019 September meeting than it is now. This implies that factoring in the likelihood of Fed rate hikes in September and December, there is only likely to be just one hike through the first 9 months of 2019.
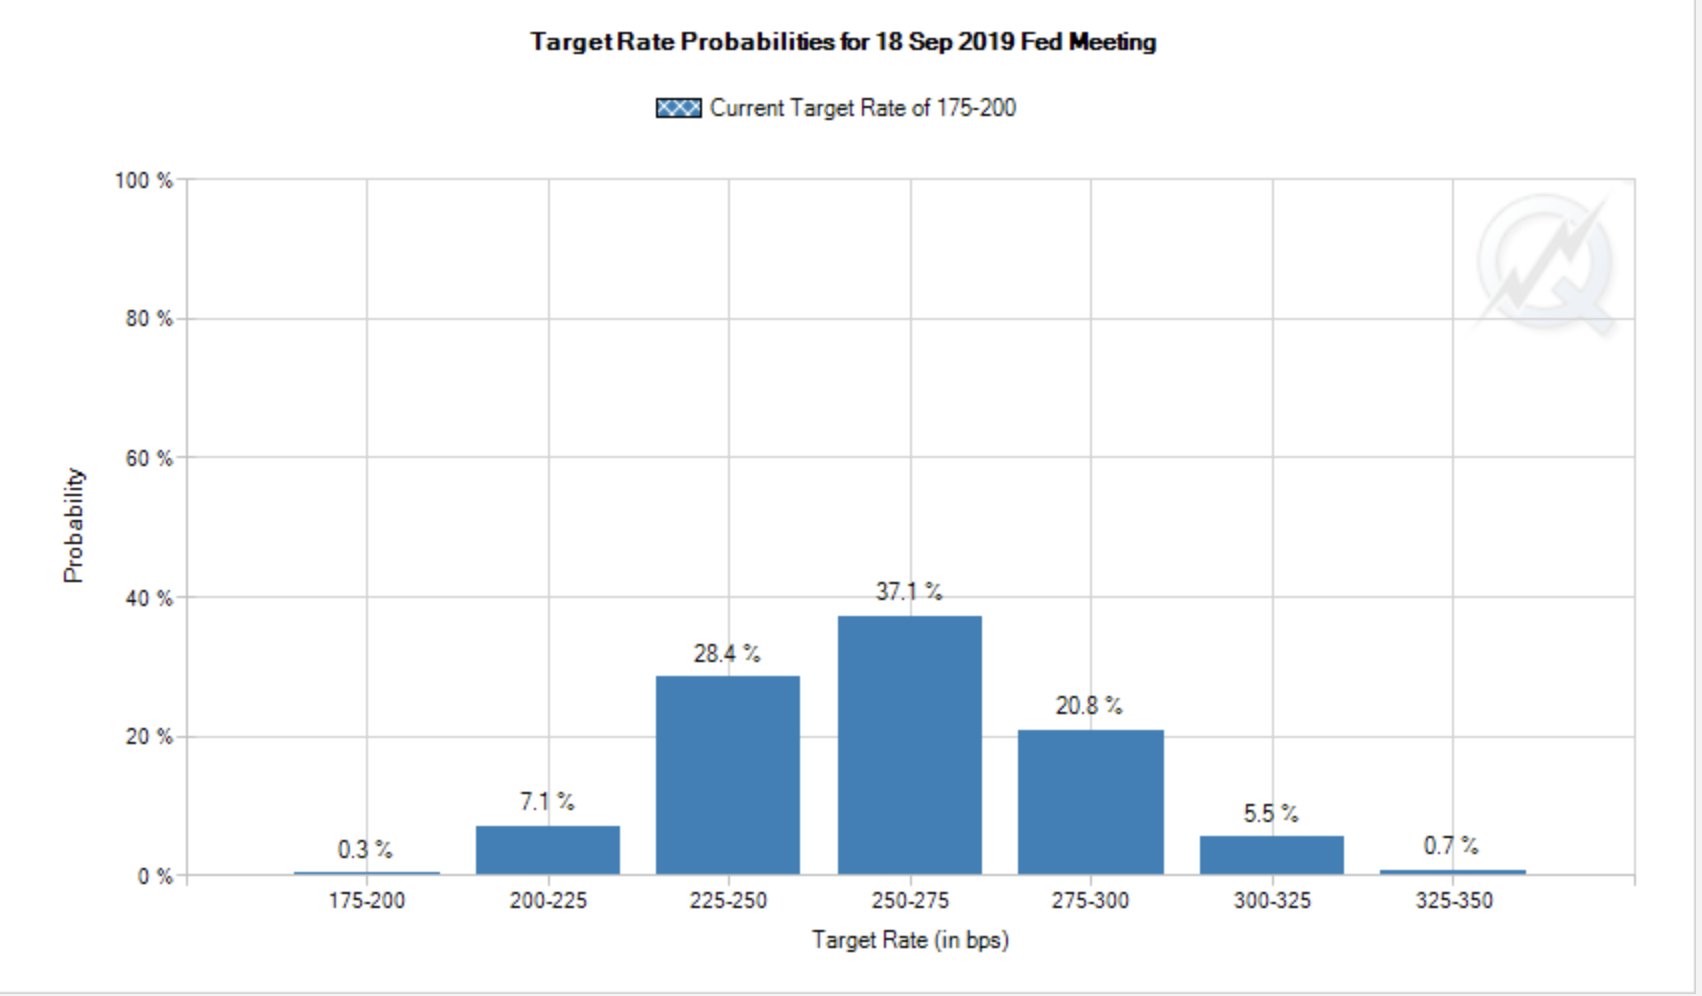
Source: CME Group
We know that markets are anticipatory mechanisms, and the PMs and currency markets are likely reflecting the steepened rate hike path with their recent price action. However, a sharp reversal could occur when the markets begin to price in a much slower rate hike trajectory in 2019 and beyond.
Also, there is only so much the Fed can do in the form of tightening before higher interest rates begin to substantially weigh on the U.S. economy. As soon as the U.S. economy begins to show signs of slower growth, the Fed is likely to discontinue tightening, and as the inevitable contraction begins, the Fed will very likely reverse policy, cutting rates and introducing additional rounds of QE to prop up asset prices. This will be extremely bullish for gold prices and the entire PM complex.
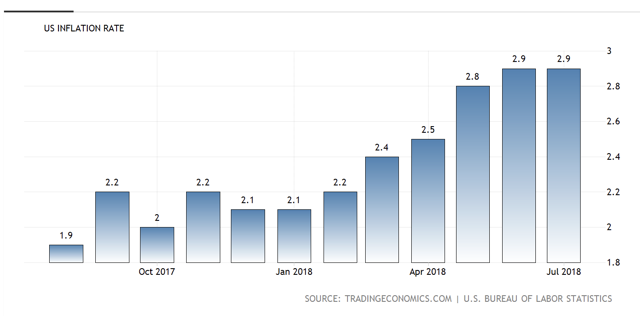
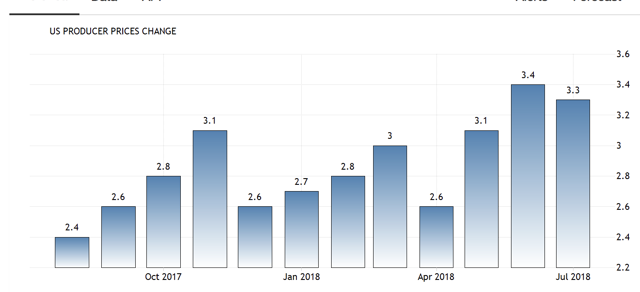
In addition, there are long-term structural issues confronting the dollar, such as rising inflation that could persist much longer than anticipated, record levels of debt and continuous dollar expansion.
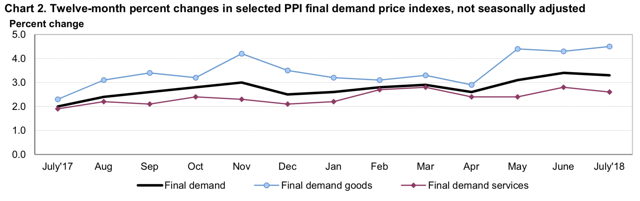
Current CPI is at 2.9%, the highest levels of consumer inflation seen in the last 6 years. In addition, the PPI’s latest reading came in at 3.3%, also showing some of its highest levels since 2012. Final demand goods PPI came in at about 4.5% in the last reading, which is exceptionally high and implies producers are paying 4.5% more in raw material costs than they were just 1 year ago. Ultimately, inflation signals the devaluation of the dollar and is a very bullish long-term element for gold.

Source: TradingEconomics.com


Source: BLS.com
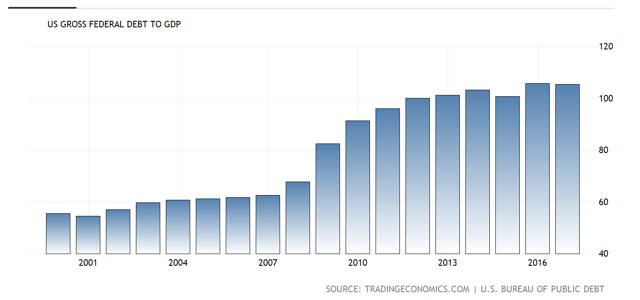
Debt is also sky-high in all aspects of the U.S. economy. Government debt is at about 105% of GDP, approaching $21.4 trillion. Moreover, all levels of consumer debt are at all-time highs. To sustain high levels of debt, continuous monetary expansion is required. If we look at monetary statistics just since 2000, the numbers are truly staggering. The monetary base has been increased by over 500% to over $3.6 trillion, treasury securities have surged by 561% to $1.44 trillion, and currency and credit derivatives have shot up by 513% and are approaching a mind-numbing $563 trillion. This trend of perpetual dollar creation will almost inevitably continue, and should intensify once the Fed reverses policy to prop up asset markets in the next down cycle.

It is not a coincidence that gold has increased in price by about 370% since its lows in the early 2000s. This long-term trend of higher gold prices is also extremely likely to continue as the dollar continues to be perpetually inflated and debased over time.
Gold: Trading vs. Investing
Some market participants trade gold and gold-related trading vehicles, and some invest in gold and other PM-related assets. There are certain positives and negatives pertaining to each strategy. In the short term, gold reacts very strongly to sentiment and momentum, and this exposes traders and investors to violent downdrafts, much like we are seeing occur now. However, in the long term gold follows an inverse relationship to the number of dollars circulating throughout the world’s monetary system.
Gold’s price was flat relative to the dollar for about 150 years, as the currency was originally pegged to gold. However, since the early 1970s, when the Nixon administration officially ended the gold standard, gold has appreciated by nearly 3,300%. This is actually better than both the S&P 500’s roughly 2,700% and the DJIA’s approximate 3,100% returns in the same time frame. The U.S.’s money creation trajectory is likely to follow only one direction and that’s up, thus gold prices should continue to go higher long term as well.
Bottom Line
Gold has been dented in recent months, but it’s no time to panic, especially if you are a long-term investor. The overall long-term trend has been higher over the past 50 years, and it’s not likely to change despite the short-term gyrations. In addition, gold is only down about 15% from the highs this year, which constitutes a healthy correction, not a new bear market, and is certainly not the end of the world.
Several factors have recently united to propel the U.S. dollar substantially higher, and this has produced an overly negative effect on gold, silver, gold miners and other PM-related prices. However, pessimistic sentiment and overly negative momentum have caused gold to become massively oversold, and there is almost a panic-like atmosphere surrounding PMs. This is evidenced by the record, or near-record bearish positions in the futures markets, the extreme gold-to-silver ratio, incredibly oversold technical conditions and other elements.
Additionally, the long-term trend for the dollar is lower relative to gold, as the perpetual inflation of the monetary supply is needed to sustain the current debt-based economy. Moreover, the inflation picture is far from tame, and the Fed can only raise rates so much before a reversal in its current policy is needed.
Therefore, gold, silver, gold miners and other gold-related assets will very likely perform extraordinarily well in the intermediate and longer term. I am interpreting the recent selloff in gold as a temporary, negative sentiment and momentum-induced phenomenon, and I am treating it as a substantial buying opportunity by adding to my gold-related asset positions at current levels.
0 comments:
Publicar un comentario