The Black Hole
by: William Koldus, CFA, CAIA
Summary
- Apple, Alphabet, Microsoft, Facebook, and Amazon are now the five largest U.S. market capitalization equities.
- Collectively their performance in 2017, the past three years, and the past decade has been amazing.
- They have also absorbed a tremendous amount of capital, sucking it away from other opportunities, and their run may be ending.
- Collectively their performance in 2017, the past three years, and the past decade has been amazing.
- They have also absorbed a tremendous amount of capital, sucking it away from other opportunities, and their run may be ending.
"A 60:40 allocation to passive long-only equities and bonds has been a great proposition for the last 35 years … We are profoundly worried that this could be a risky allocation over the next 10."
-- Sanford C. Bernstein & Company Analysts (January 2017)
"Bull markets are born on pessimism, grow on skepticism, mature on optimism, and die on euphoria"
-- Sir John Templeton
Life and investing are long ballgames."
-- Julian Robertson

(Source: Author's Photo)
Introduction
For active, value-orientated investors, the current bull market in U.S. stocks, which began in March of 2009, has been one of the most difficult bull markets to navigate in history. Said another way, it has not been anything like a day at the beach.
Keeping up with the market, without owning the five biggest market capitalization stocks, which are all large-cap growth stocks and listed in order of size, Apple (AAPL), Alphabet (GOOGL), Microsoft (MSFT), Facebook (FB), and Amazon (AMZN), has been nearly imposible.
A strong performance by the largest stocks spurred investors, speculators, and fund managers to allocate to these equities in ever-greater quantities, creating a self-reinforcing circle of buying exacerbated by the continued inflows into passive index funds and ETF funds.
So what is an investor to do?
The answer is that it may finally be time to step outside the black hole that is consuming a disproportionate amount of investor's capital. Simply avoiding shares of AAPL, which I was bullish on previously, GOOGL, MSFT, FB, and AMZN could be one-key to investment outperformance over the next decade.
Thesis
The largest companies have consumed investor capital at an ever-increasing pace, forcing more and more investment managers to become closet indexers, closing active investment strategies, and creating a bigger opportunity for the remaining active investors.
The Five Biggest Are the Primary Culprits
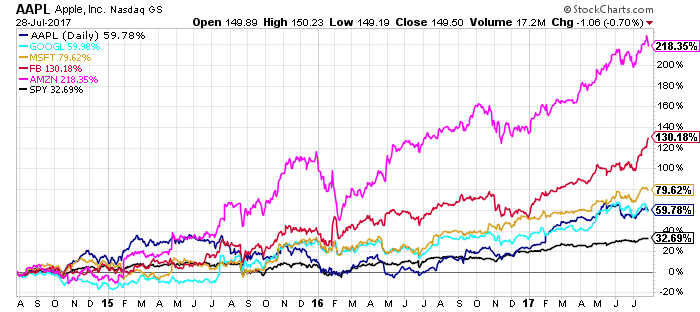
Apple, Alphabet, Microsoft, Facebook, and Amazon have had extraordinary performance in 2017. AAPL shares are up 30% year-to-date, GOOGL shares have gained 21%, MSFT shares are up 19% in 2017, FB shares lead the pack with a remarkable 50% year-to-date gain, and AMZN shares are up a strong 36% even after their minor stumble Friday.
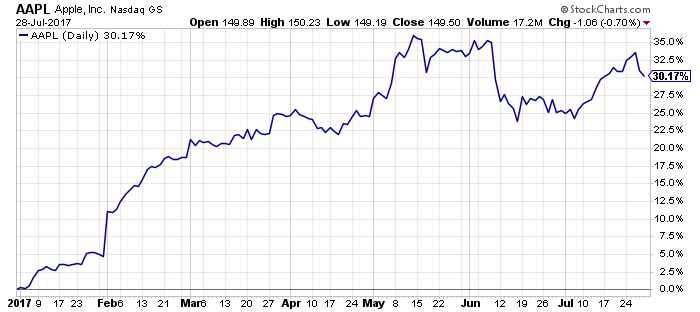
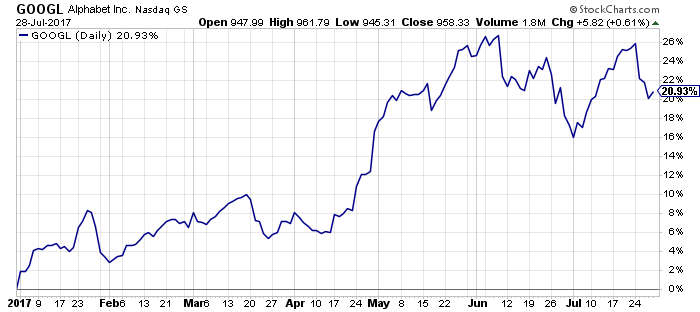

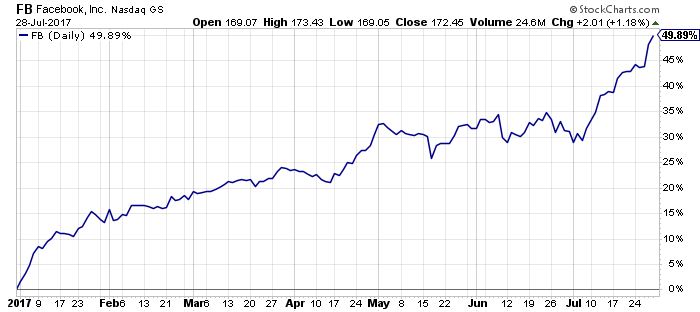
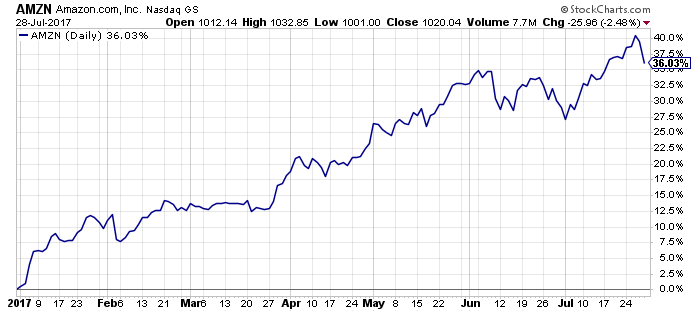
(Source: William Travis Koldus, StockCharts.com)
For perspective, the S&P 500 Index, as measured by the SPDR S&P 500 ETF (SPY), is up a strong 11.5% YTD through Friday, July 28th, 2017, but the leading benchmark index, which is benefiting from some of the same tailwinds as the FAAMG equities, clearly trails the performance of the FAAMG stocks.
The three-year performance picture is similar, with AMZN shares up an eye-opening 218%, while GOOGL shares are the laggard, with a gain of 60%, that still is far ahead of SPY's 33% advance.
(Source: WTK, StockCharts.com)
The five-year performance chart shows more of the same, with only AAPL shares in line with the still very healthy gains of SPY.
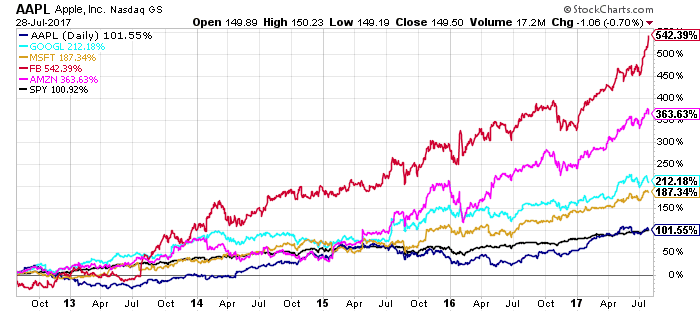
(Source: WTK, StockCharts.com)
While AAPL shares have lagged over the past five years, they have been the second best performer over the past decade, gaining 694%, trailing only AMZN's 1114% return over the past decade.

(Source: WTK, StockCharts.com)
In summary, with the benefit of hindsight, investing in the large-cap growth sector a decade ago, in the middle of the developing turmoil in the financial markets, would have been one of the best decisions an investor could have made, in a world that was ultimately growth challenged following the 2008/2009 bear market.
Perspective on Market Capitalization - Today Versus 1999
Apple's current market capitalization is $780 billion, Alphabet's is $658 billion (with its two share classes combined), Microsoft has a $564 billion market-cap, Facebook's market capitalization is $501 billion, and Amazon's market capitalization is $488 billion.
The sheer size of these companies is staggering, with the smallest, Amazon, making up 2.2% of the S&P 500 Index, and the largest, Apple, making up 3.5% of the S&P 500 Index. Individually, Apple, Alphabet, Microsoft, Facebook, and Amazon's market capitalizations are bigger than entire sectors of the S&P 500, including the Utilities, Real Estate, Materials, and Telecommunication sectors, as shown in the graphic below.
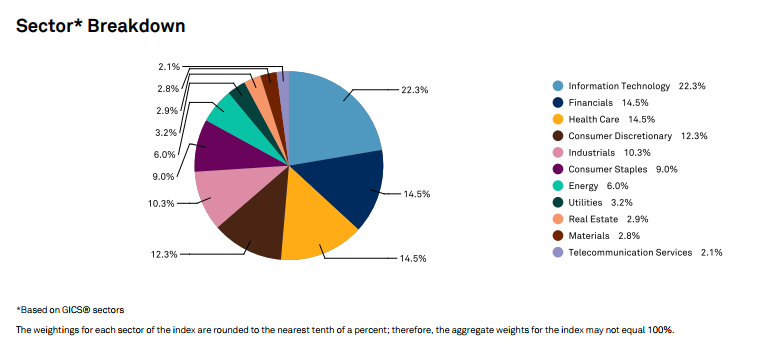
(Source: S&P Dow Jones Indices)
Collectively the market-cap of the five largest companies in the S&P 500 Index is roughly $3 trillion.
The next largest company in the S&P 500 Index after Apple, Alphabet, Microsoft, Facebook, and Amazon is Berkshire Hathaway (BRK.A), (BRK.B), with a combined market cap of $429 billion between its two share classes.
Following Berkshire is Johnson & Johnson (JNJ), which has a market-cap of $355 billion, Exxon Mobil (XOM), which has a market-cap of $337 billion, JP Morgan (JPM), with a market-cap of $324 billion, and Wells Fargo (WFC), with a market-cap of $266 billion.
As a group, the next five largest companies have a combined market capitalization of approximately $1.7 trillion.
For perspective, the current market capitalization of the S&P 500 is roughly $22.3 trillion, so Apple, Alphabet, Microsoft, Facebook, and Amazon, make up roughly 13.5% of the index, as of this writing.
Additionally, with a market capitalization of $4.7 trillion, the ten-largest companies make up approximately 21.1% of the S&P 500 Index.
For a historical perspective, 1999's year ending market capitalization of the S&P 500 Index was $12.3 trillion.
The top-ten companies at that time, Microsoft, General Electric (GE), Cisco Systems (CSCO), Wal-Mart Stores (WMT), Exxon Mobil, Intel (INTC), Lucent Technologies, International Business Machines (IBM), Citigroup (C), and American Online had a combined market capitalization of $3.1 trillion.
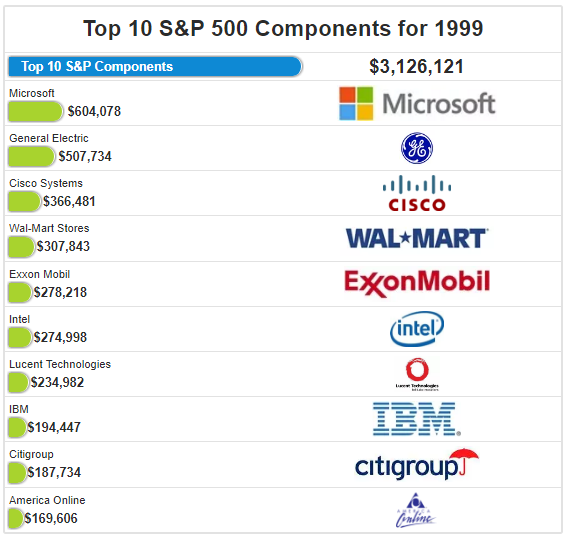
(Source: WTK, Etfdb.com)
The top-ten largest market capitalization companies in the S&P 500 Index in 1999 accounted for 25.2% of the index, which is higher than today's comparative 21.1% weighting. Additionally, the top-five largest market capitalization companies in 1999 were 16.7% of the index, which is bigger than today's 13.5% comparative weighting.
The calendar year 1999 had the highest equity valuations in modern market history, so it is difficult to draw conclusions, comparing the current market capitalizations to 1999's investing landscape. With that thought in mind, I decided to look at data from 1994, and 1990.
Looking Back At Market Capitalization in 1994 and 1990
The 1990s were glory days for the U.S. stock market, and the 1995-1999 time frame sported some of the best returns for the S&P 500 Index in its storied history.
In 1995, the total return for the S&P 500 Index was 37.6%, in 1996, the total return was 23.0%, in 1997, the total return was 33.4%, the total return in 1998 was 28.6%, and 1999 concluded with a gain of 21.0%.
Because of the strong capital appreciation, the total market capitalization of the S&P 500 roughly quadrupled from year-end 1994 to year-end 1999, going from $3.3 trillion to $12.3 trillion.
Thus, I thought it would be interesting to take a look at the top S&P 500 companies and their associated market capitalizations at the end of 1994.
The top-ten companies in 1994 were General Electric, AT&T Corp (T), Exxon, Coca-Cola (KO), Royal Dutch Petroleum (RDS.A), Phillip Morris (MO), Wal-Mart Stores, Merck (MRK), IBM, and Procter & Gamble (PG)
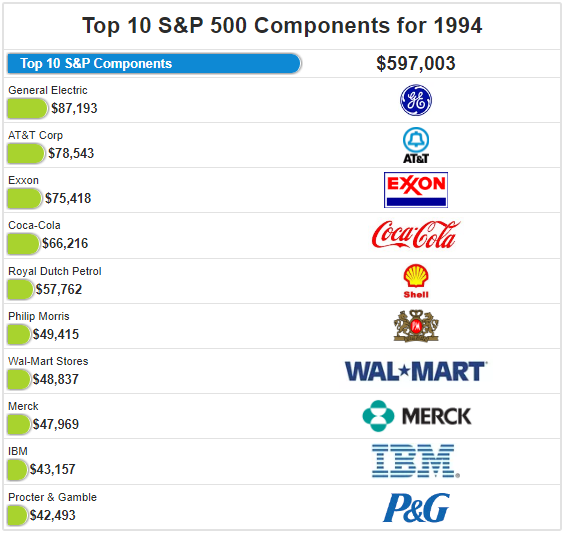
(Source: WTK, Etfdb.com)
Collectively, the top-ten companies in the S&P 500 Index had and aggregate market-capitalization of $597 billion in 1994, representing 17.8% of the index, which is less than today's 21.1% weighting for the top-ten S&P 500 companies.
The top-five S&P 500 companies in 1994 had a market capitalization of $365 billion, and this added up to 10.9% of the S&P 500 Index, materially lower than today's 13.5% weighting collectively by Apple, Alphabet, Microsoft, Facebook, and Amazon.
Interesting, Microsoft did not make it into the top-ten market capitalization companies until 1995, where it placed tenth, despite rapid growth in revenues, and profits ever since its March 13th, 1986 IPO.
To provide one more comparison, I looked back to 1990. Here are the top-ten S&P 500 Index companies from 1990, listed in order of market capitalization.
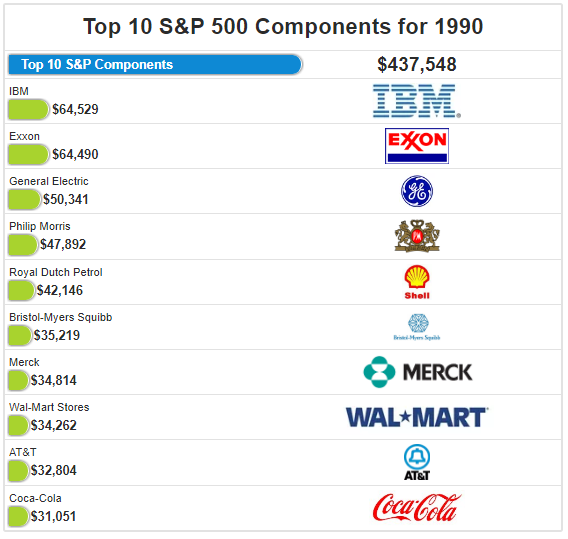
(Source: WTK, Etfdb.com)
IBM was the largest company in 1990 by market capitalization, followed by Exxon, General Electric, Phillip Morris, Royal Dutch Petroleum, Bristol-Myers Squibb (BMY), Merck, Wal-Mart, AT&T, and Coca-Cola.
Collectively, their market capitalization was $438 billion, and they represented 20.0% of the roughly $2.2 trillion total market capitalization of the S&P 500, compared to today's 21.1% weighting.
The top-five companies had a combined market cap of $269 billion, representing 12.3% of the S&P 500's market capitalization, compared to today's 13.5% weighting for Apple, Alphabet, Microsoft, Facebook, and Amazon.
In summary, compared to 1994, and 1990, today's top-five and top-ten S&P 500 companies represent a bigger portion of the total market capitalization of the index, yet the concentration of the top companies has not yet grown to 1999's levels.
Looking at Fundamentals
Technology stocks that are growth companies, typically trade at a premium to the market, and the valuation ratios for Alphabet, Microsoft, Amazon, and Facebook are certainly trading at premiums today. Apple is the notable exception, as its price-to-earnings and price-to-cash flow ratios trade at a discount to the broader market.
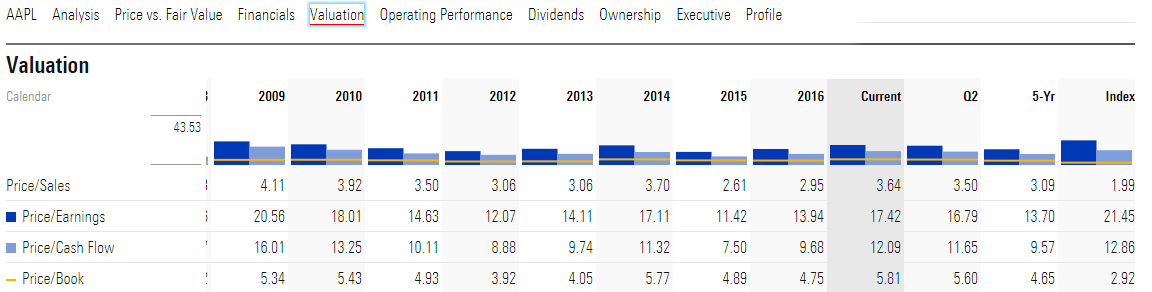
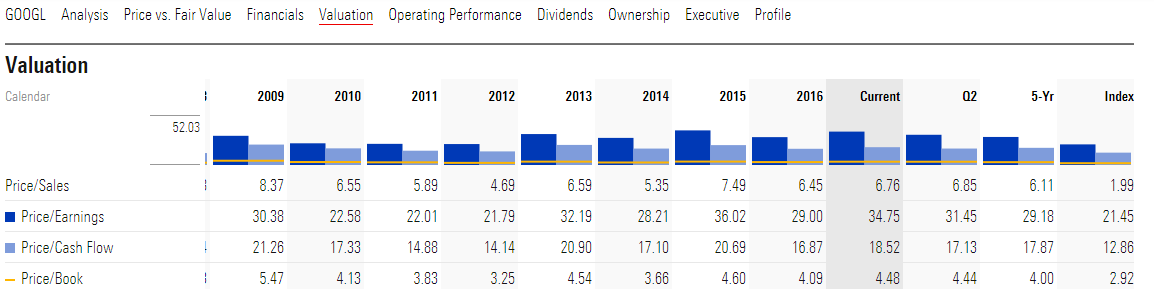
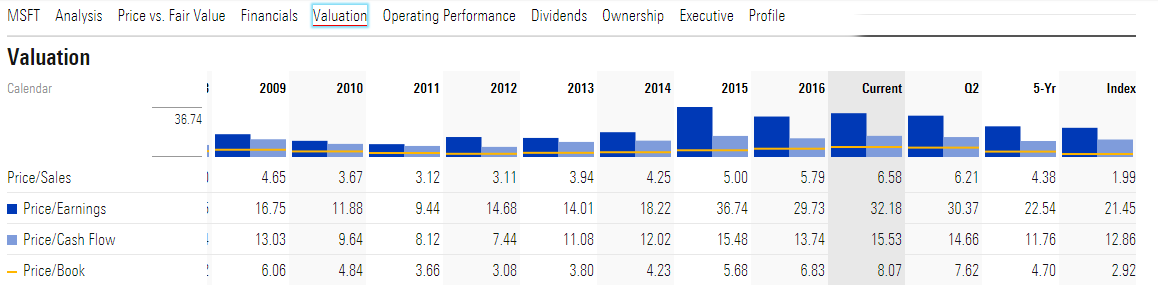
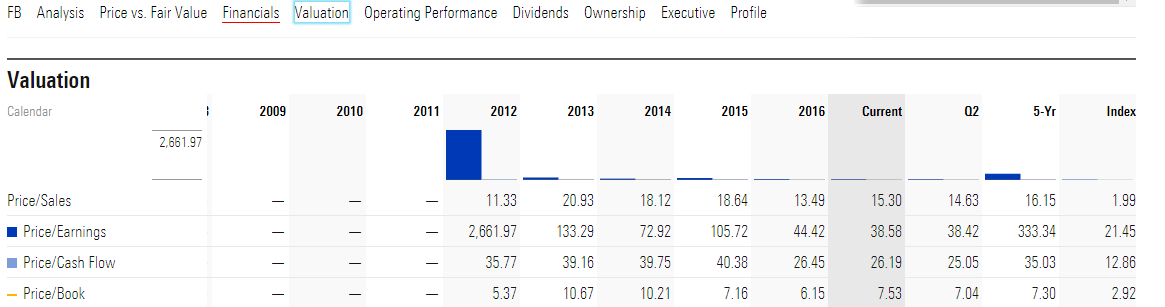
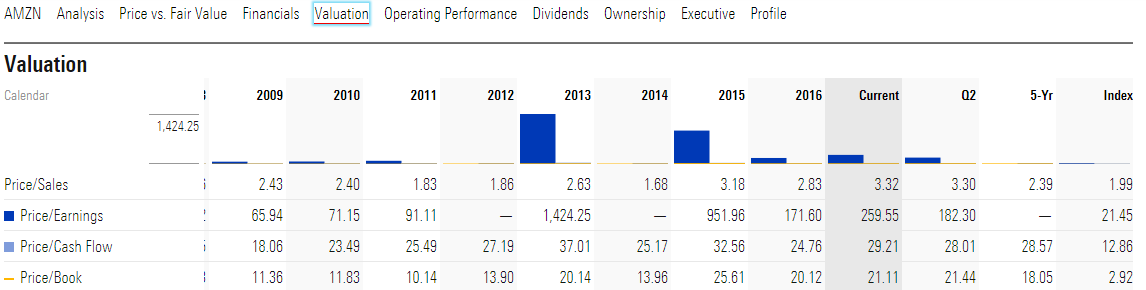
(Source: Morningstar)
The valuation data presented in the tables above, which is organized by ticker symbol and presented in order of market capitalization, shows that Apple shares are arguably undervalued, or at least the most fair priced by traditional valuation ratios, while Alphabet and Microsoft are premium priced growth stocks, and Facebook and Amazon continue to trade at extraordinary valuations.
Specific to Facebook and Amazon, the current price-to-earnings ratios are off the charts, particularly for AMZN, but their price-to-cash flow ratios are also at a premium to the market, and a premium to Apple, Alphabet, and Microsoft. Having said this, their current growth rates are higher, and the projection of these higher growth rates, infinitely into the future, has led to higher share prices today for FB and AMZN.
The difficulty for all these very large companies, especially technology companies, is anticipating the future results. This is compounded by the fact that, historically, having five technology companies as the largest market capitalization companies is a rare feat. The only era that resonates for me, off the top of my head, is the Nifty 50 era of the 1970s, and we know how that ended.
Takeaway - The Black Hole Could Get Bigger
Despite trading at premium valuation ratios, the five largest market capitalization stocks today, Apple, Alphabet, Microsoft, Facebook, and Amazon have had room to appreciate further in 2017, and they have been some of the best-performing stocks in the entire stock market.
Historical comparisons show that if the top market capitalization equities follow 1999's pattern, they could gain further market capitalization relative to the market. Thus, the black hole could get bigger, sucking in more investor's capital. However, when looking back to 1994, and 1990, concentration levels today are higher in the top-five, and top-ten, S&P 500 market capitalization equities.
The combination of a low global growth environment over the last decade, which has caused investors to bid up the few viable growth stocks, and the room for historical appreciation potential, at least when compared to 1999, has given investors and speculators room to bid up FAAMG stocks further. There are two problems with this from my view.
First, the five largest equities in the S&P 500 Index today are all technology stocks, which are inherently volatile with regard to their future projections. Adding to this point, as investors, we saw what happened to the large-cap technology leaders in 1999, notably American Online and Lucent Technologies.
Building on this narrative further, even prosperous technology market leaders from 1999, including Cisco Systems, Microsoft, and Intel, have collectively treaded water for nearly two decades, striving to grow into their premium market capitalizations.
The second issue, which is an important one, revolves around the S&P 500, passive investing, and the U.S. market specifically. I touched on this in my previous article, " Its 1999 All Over Again," and I will cover this in more detail in the next installment of this series, and it is a game changer, in my opinion.
With that preview and tease, thank you for your readership.
0 comments:
Publicar un comentario