by: Robert Sinn
- Gold peaked at $1377.50 earlier this month near previous resistance and the Psychological $1400 level.
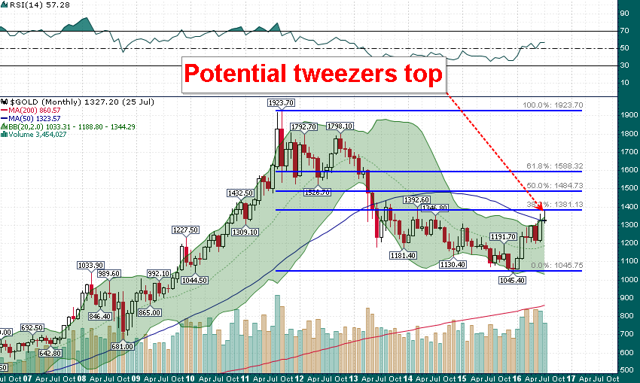
- The monthly chart is at risk of printing a 'tweezers top' bearish candlestick pattern which adds importance to this week's closing level.
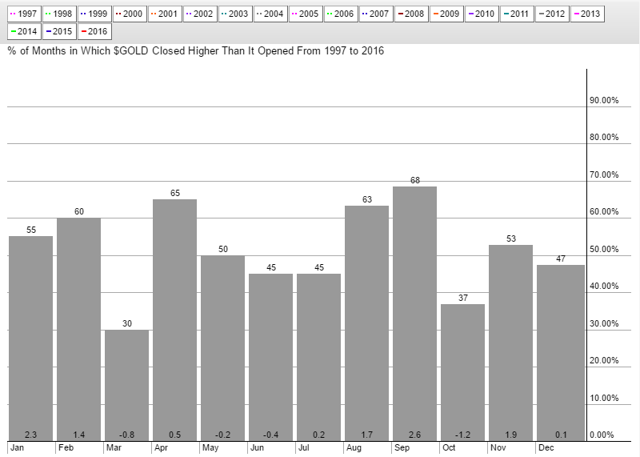
- August/September is the most bullish two month period of the year for gold historically with an average gain of 4.3% since 1997.
- The monthly chart is at risk of printing a 'tweezers top' bearish candlestick pattern which adds importance to this week's closing level.
- August/September is the most bullish two month period of the year for gold historically with an average gain of 4.3% since 1997.
Gold in US dollar terms peaked at $1377.50 earlier this month and has since corrected roughly 5%.
Given the amount of confluence in the $1400 area it not surprising that gold ran out of steam just shy of the round number psychological level. In addition, the $1400 price level has been a target for a number of outspoken market commentators including famed hedge fund manager Jeffrey Gundlach.
The monthly chart of gold offers some perspective, especially the significance of the $1375-$1425 area:
The 2016 gold rally came within a few dollars of the 38.2% Fibonacci retracement of the entire 2011-2015 decline. More importantly with just a few days left in the month of July gold is at risk of forming a 'tweezers top' which is a bearish candlestick pattern denoting buying exhaustion.
Monthly patterns tend to carry more weight because of the longer time frame. As a rule traders should use longer time frame patterns and trends as a compass for shorter term trades. Therefore, a tweezers top at key support/resistance on the monthly is significant and should not be taken lightly.
There are still a few trading days left in July, however, if things remain as they are this could mean that the 2016 gold rally will be taking an extended pause.
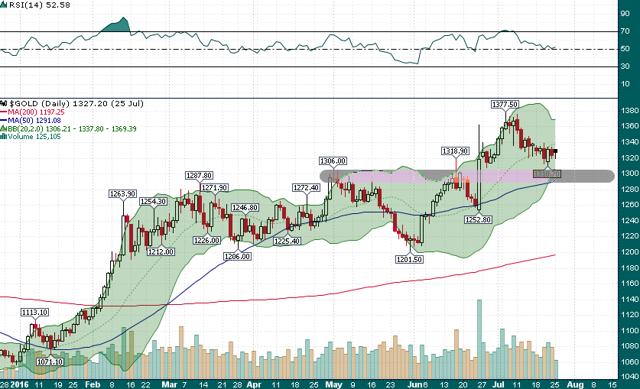
While upside resistance for gold is quite clear ($1375-$1425) there is a strong zone of confluence just below which has yet to be fully tested during the recent correction:
Previous resistance near $1300 lines up nicely with the rising 50-day moving average (currently at $1291). A hold of support near $1300 would be standard and quite healthy, whereas, a move below $1290 would turn the outlook for gold much more bearish.
Meanwhile, we are about to enter the most bullish two months of the year for gold historically:
Since 1997 gold has averaged a 4.3% gain during August/September, by far the best two month stretch of the year.
Will seasonal tailwinds prevail or has price peaked for the year?


0 comments:
Publicar un comentario