Summary
We just completed an article the other day about the Velocity of Money – Where Has it Gone.
The velocity of money in this case is telling you how slow the economy and the job market truly are.
People are so concerned they have literally stopped spending and are saving everything they can.
We just completed an article the other day about the Velocity of Money - Where Has it Gone.
We explained in that article the general make up of velocity and that our feeling was slow job growth has led to the velocity continuing to decelerate in the last several years. So all of this made us wonder can we actually follow the trail of the money, where it is going and where it had been? Let's start with the basics see the measure of M2 money supply below.
(click to enlarge)
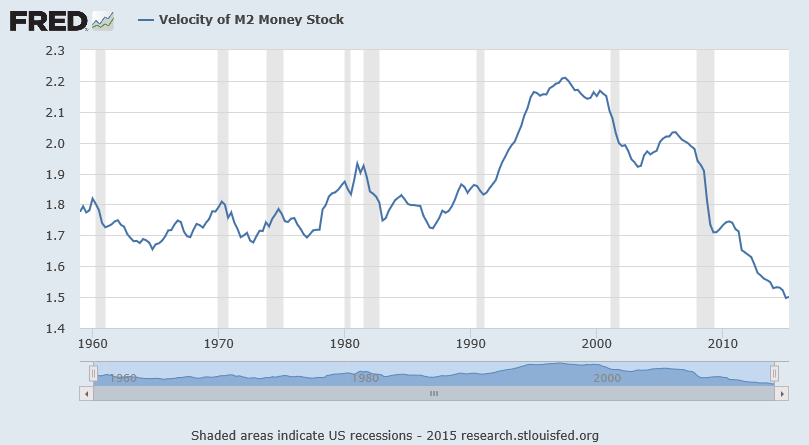
So you can once again see the velocity was pretty consistent through mid 1970's. Then velocity started to pick up, where was all the money changing hands going too.
(click to enlarge)

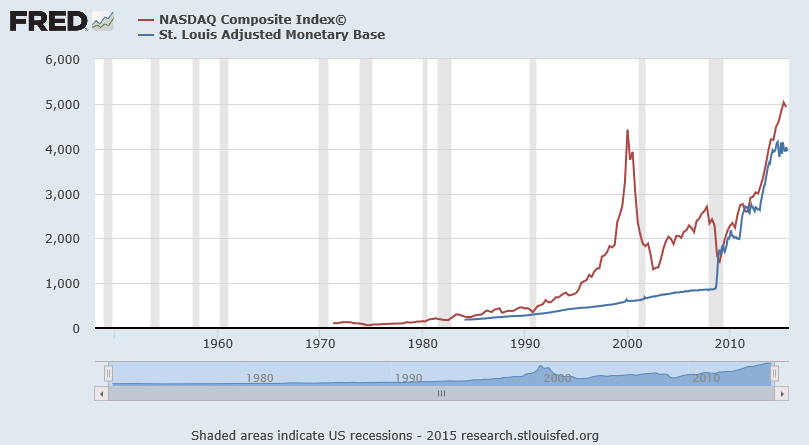
The chart above is the chart of the NASDAQ Composite with the M2 Velocity of money measure.
For those of you that are curious, the correlation from 1971 to present is 0.02, a pretty weak correlation. From 1971 till 2007 is .74, with an R^2 of .56. That is a pretty strong correlation.
As we spoke about in the last article, labor participation was going up until it peaked around 2000.
(click to enlarge)

The correlation here is not as strong as 1971-2008's 0.60, with an R^2 of .39, which verifies the weaker correlation.
The correlation between the stock market and the velocity of money seems to be strong enough to conclude that people had confidence in their jobs and the economy so they were literally just putting their money into the stock market and investing. As the economy changed and people lost confidence, they began to pull their money out of the stock market and you can see the slow down through the velocity of money declining.
So that opens the questions, if the velocity of money has been declining since 2008 and the stock market has been rocketing higher, what is going on?
The obvious answer is the Fed's initiation of QE, and we can see that through the Adjust Monetary Base below.
(click to enlarge)
I'm not going to figure out the correlation here, because it seems pretty obvious.
The Velocity of Money is going down, while the stock market and the adjusted monetary base are going up. So the Fed has essentially replaced individuals putting their money into the stocks. So where are individuals putting their money. They are not putting it in the stock market, because the velocity of money should be increasing according to our theory. Did it just disappear?
(click to enlarge)
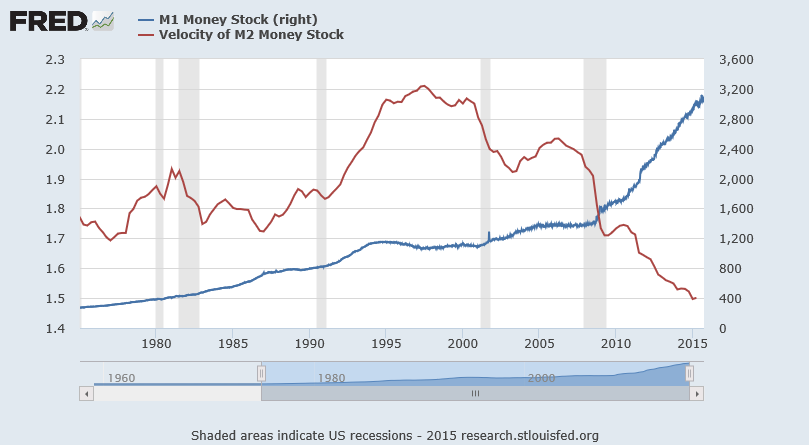
People are literally leaving their money in cash or in their checking account. Look at the surge in M1 since 2008-2009. You can see that velocity of money is literally slowing because individuals are just hoarding all their money into saving. You can say M1 is increasing because of QE, but the Fed isn't putting money into people's checking account. They launch QE through bond purchasing. M1 is literally the measure of physical money and checking accounts. The Fed isn't dropping money from the sky out of a helicopter. The Fed doesn't even have the power to print money.
My conclusion from the last two articles is that the velocity of money in this case is telling you how slow the economy and the job market truly are. Clearly, people are so concerned they have literally stopped spending and are saving everything they can.
0 comments:
Publicar un comentario