The U.S. Dollar As A Store Of Value
Sep. 27, 2014 7:12 AM ET
Summary
- The US Dollar Index has broken above July 2013 highs as the US economy strengthens.
- The Trade Weighted Index also reflects this trend.
- But the Trade Balance remains in deficit.
(click to enlarge)
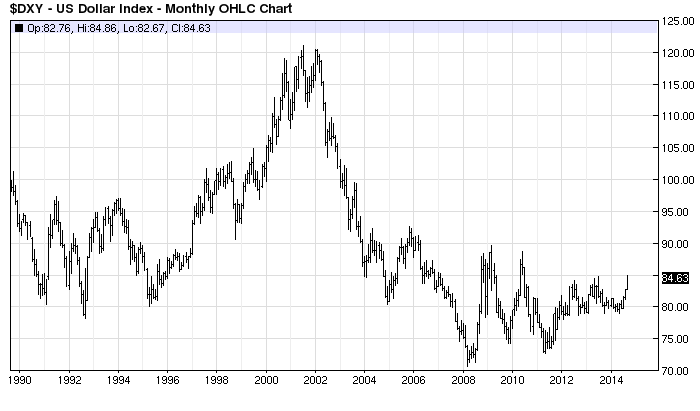
Source: Barchart.com
As the US economic recovery continues to gather momentum, what are the prospects for the US Dollar versus its principal trading partners? This is key to determining how swiftly and to what degree the Federal Reserve will tighten monetary conditions. Above is a 25 year monthly chart of the US Dollar Index and for comparison, below is the US Dollar Trade Weighted Index (TWI) as calculated by the Philadelphia Federal Reserve. The TWI shows the initial flight to quality during the onset of the Great Recession, the subsequent collapse as the Fed embarked on its increasingly aggressive programme of QE, followed by a more orderly recovery as the US economy began its long, slow rebound. It is still only a modest recovery and I would not be surprised to see a slow grind higher towards the initial post crisis highs around 113 - this is only a 50% retracement of the 2001-2011 range. In the longer term a return to the "strong dollar" policies of the late 1990's might be conceivable if the current industrial renaissance of the US continues to gather momentum:-
(click to enlarge)
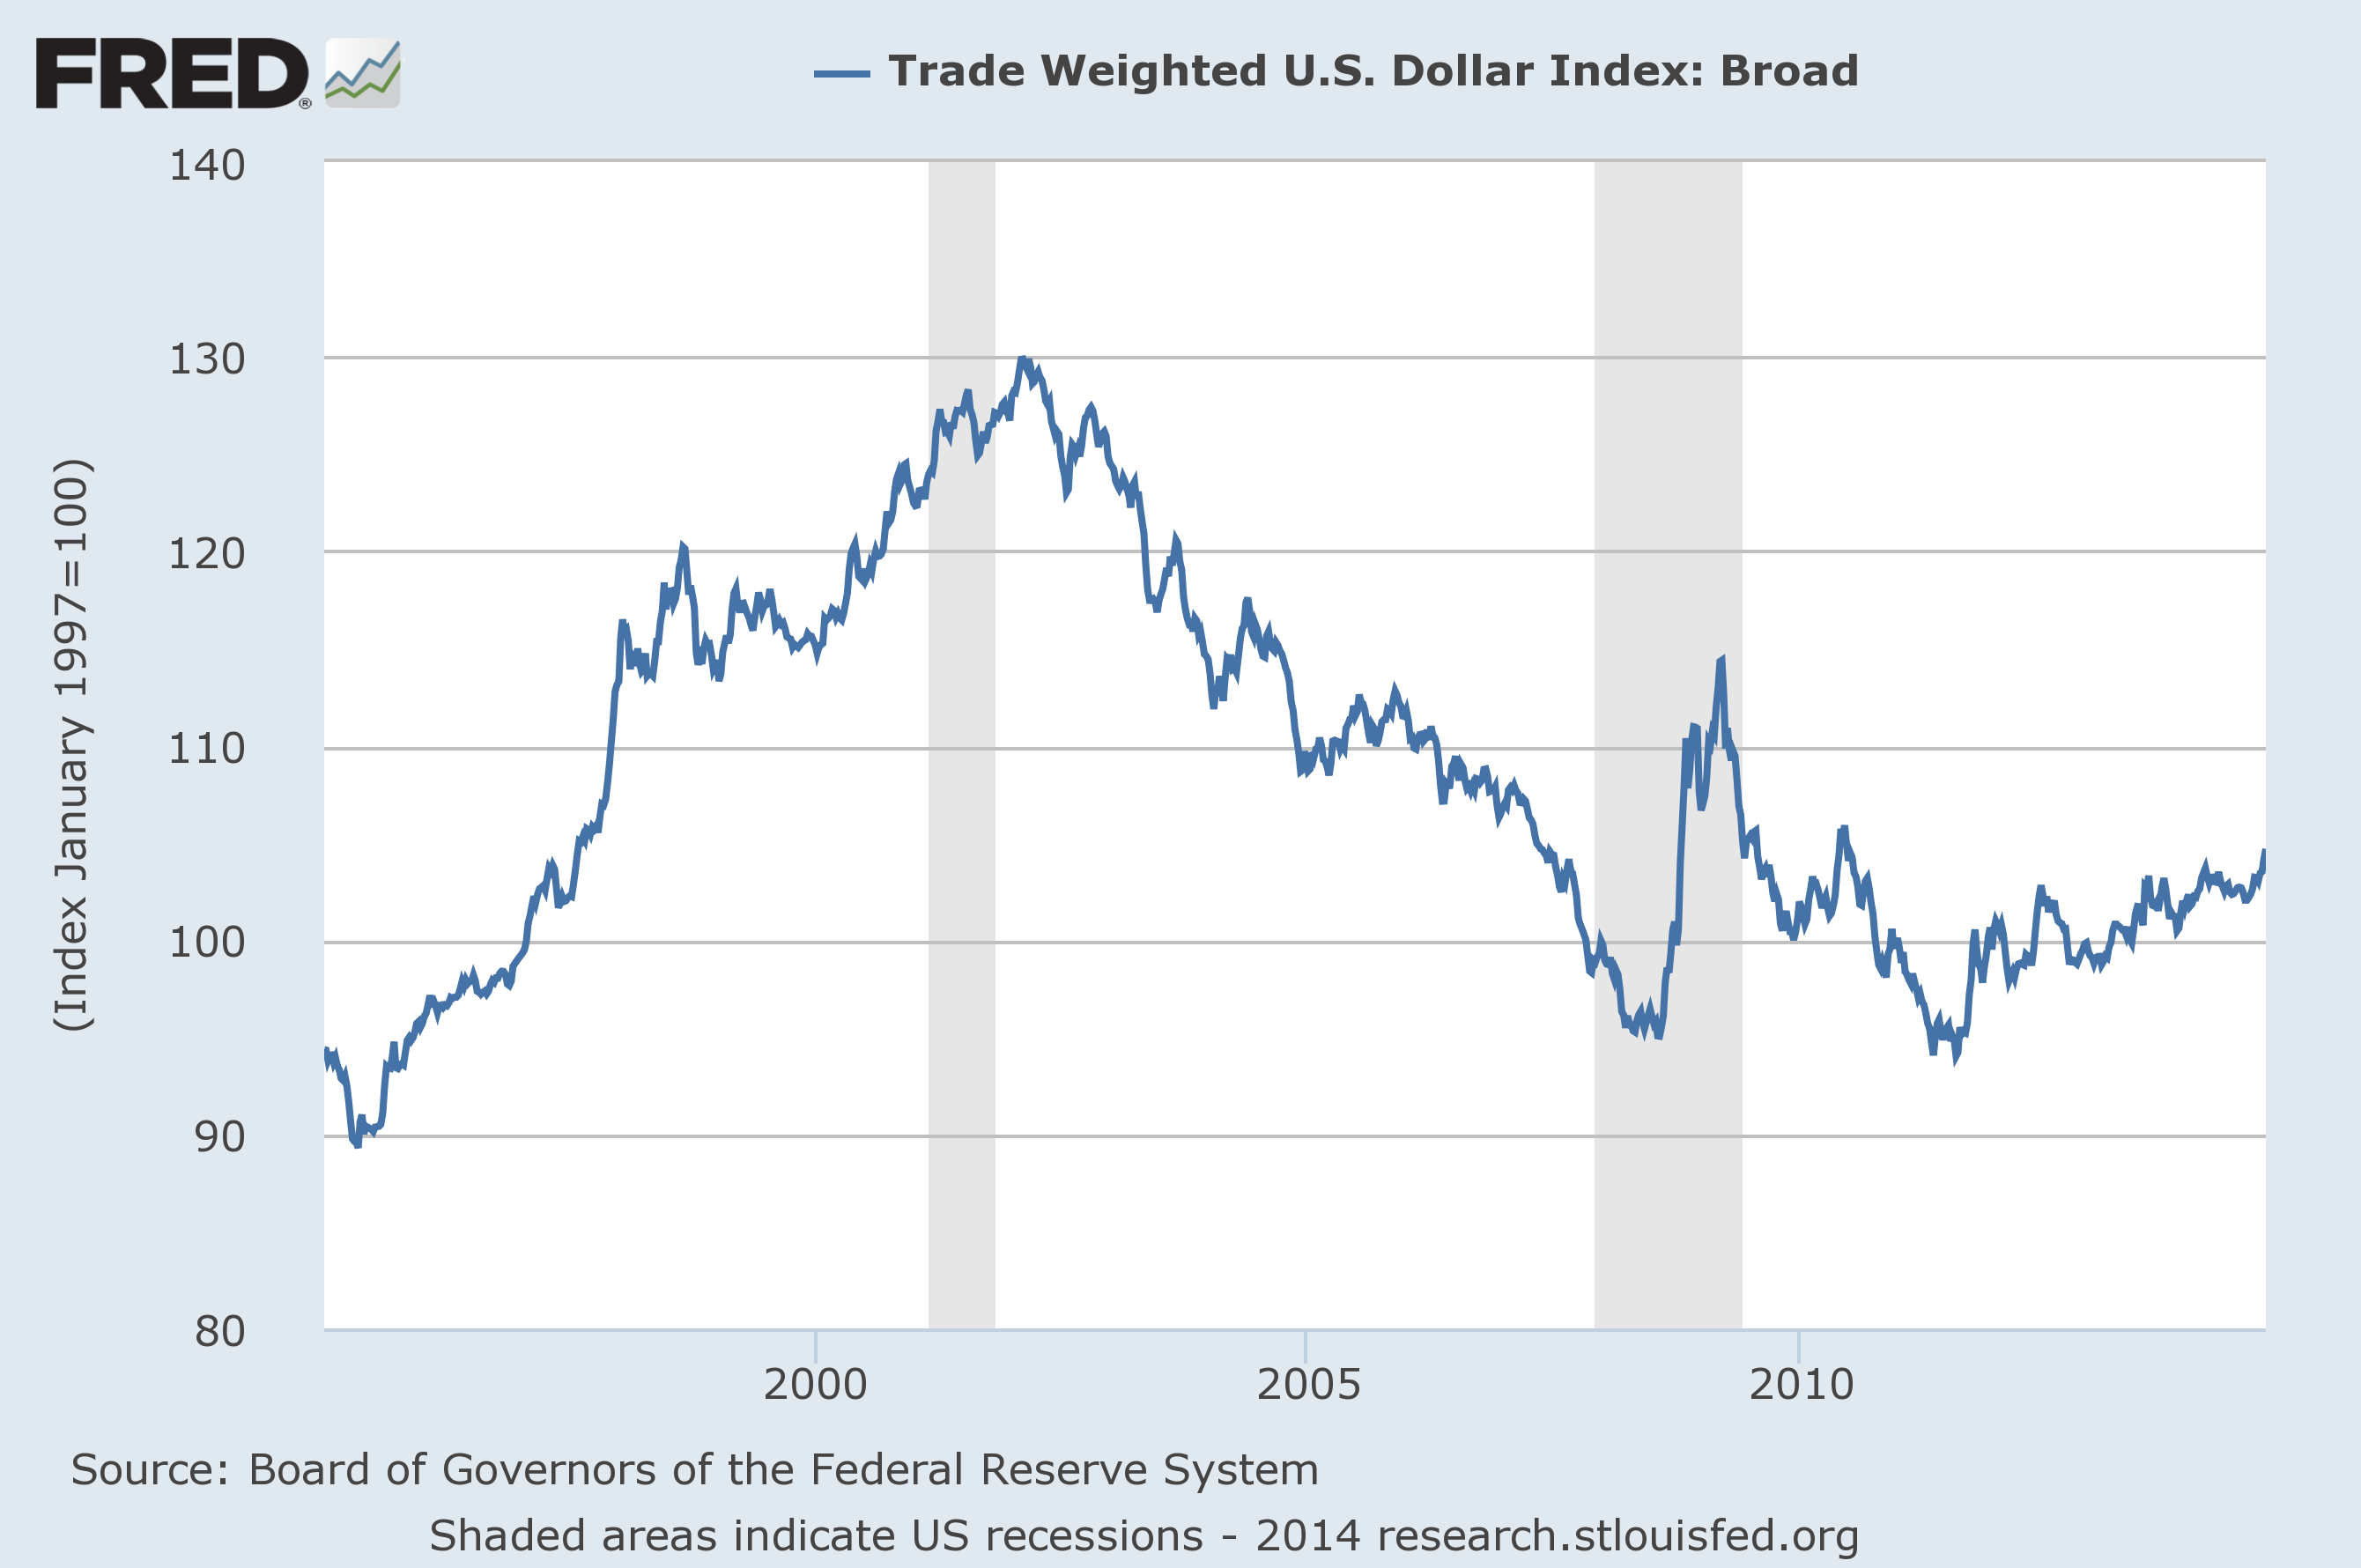
Source: St Louis Federal Reserve
During the late 1990's the US Dollar soared on a combination of strong economic growth, a technology asset bubble and relatively benign inflation due to the disinflationary forces of globalisation, emanating especially from China. During the current decade another technology revolution has been underway as the US becomes self-sufficient in energy production. I am not referring simply to "fracking" as this paper from the Manhattan Institute - New Technology for Old Fuel - April 2013 explains: -
Between 1949 and 2010, thanks to improved technology, oil and gas drillers reduced the number of dry holes drilled from 34 percent to 11 percent.
Global spending on oil and gas exploration dwarfs what is spent on "clean" energy. In 2012 alone, drilling expenditures were about $1.2 trillion, nearly 4.5 times the amount spent on alternative energy projects.
Despite more than a century of claims that the world is running out of oil and gas, estimates of available resources continue rising because of innovation. In 2009, the International Energy Agency more than doubled its prior-year estimate of global gas resources, to some 30,000 trillion cubic feet-enough gas to last for nearly three centuries at current rates of consumption.
In 1980, the world had about 683 billion barrels of proved reserves. Between 1980 and 2011, residents of the planet consumed about 800 billion barrels of oil. Yet in 2011, global proved oil reserves stood at 1.6 trillion barrels, an increase of 130 percent over the level recorded in 1980.
The dramatic increase in oil and gas resources is the result of a century of improvements to older technologies such as drill rigs and drill bits, along with better seismic tools, advances in materials science, better robots, more capable submarines, and, of course, cheaper computing power.The productivity gains are substantial within the Oil and Gas industry, but the benefits are just beginning to percolate out to the broader economy.
Here is US GDP over the last twenty years: -
(click to enlarge)
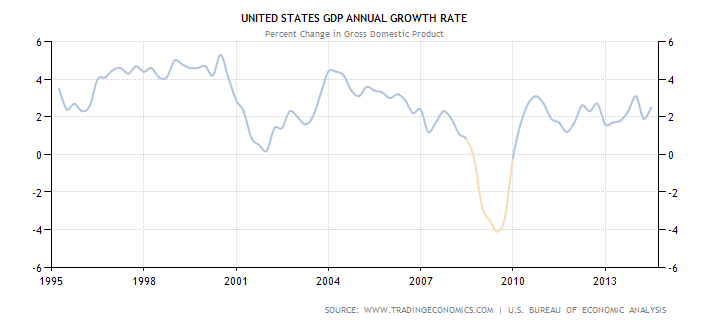
Source: Trading Economics
Growth since the Great Recession has been relatively anemic. To understand some of the other influences on the US Dollar we also need to consider the US Trade Balance: -
(click to enlarge)
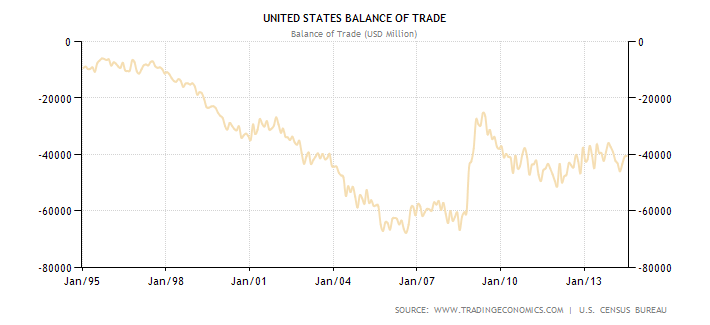
Source: Trading Economics
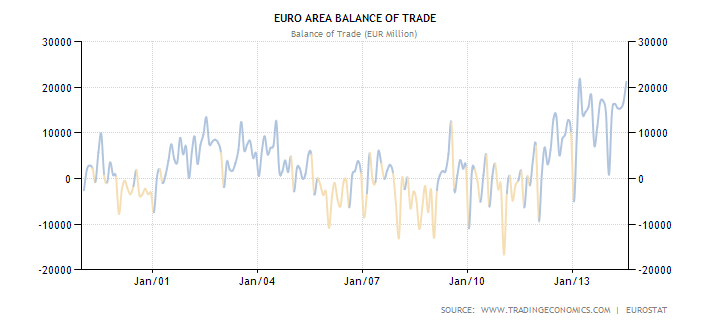
The USA continues to be the "consumer of last resort". Here, by contrast are the EU GDP (1995-2014) and Trade Balance (1999-2014): -
(click to enlarge)

Source: Trading Economics
(click to enlarge)
Source: Trading Economics
Europe is also a major export market for Chinese goods but nonetheless appears to rely on trade surpluses to generate sustainable growth. Since the Great Recession the EU has struggled to achieve any lasting GDP growth despite a significant increase in its trade surplus. This is because a large part of the terms of trade improvement has been achieved by reducing imports rather than increasing exports, especially in the Euro Zone (EZ) peripheral countries. The austerity imposed on EZ members by the ECB has encouraged some external trade but the prospect for any sustained recovery in EZ growth is limited.
China has, of course, been a major beneficiary of the US trade deficit, although, since the Great Recession, trade surplus data has become significantly more volatile: -
(click to enlarge)

Source: Trading Economics
The chart above doesn't really articulate the colossal increase in Chinese exports - between 2004 and 2009 China's trade surplus increased ten-fold. Despite the more recent policy of "Rebalancing" towards domestic consumption, the latest data takes this surplus to a new record.
The US response to the trade deficit
The US government is concerned about the structural nature of their trade deficit but this is balanced by capital account surpluses as this report from the Congressional Research Service - Financing the U.S. Trade Deficit - March 2014 explains: -
According to the most commonly accepted approach to the balance of payments, macroeconomic developments in the U.S. economy are the major driving forces behind the magnitudes of capital flows, because the macroeconomic factors determine the overall demand for and supply of capital in the economy. Economists generally conclude that the rise in capital inflows can be attributed to comparatively favorable returns on investments in the United States when adjusted for risk, a surplus of saving in other areas of the world, the well-developed U.S. financial system, the overall stability of the U.S. economy, and the generally held view that U.S. securities, especially Treasury securities, are high quality financial instruments that are low risk. In turn, these net capital inflows (inflows net of outflows) bridge the gap in the United States between the amount of credit demanded and the domestic supply of funds, likely keeping U.S. interest rates below the level they would have reached without the foreign capital. These capital inflows also allow the United States to spend beyond its means, including financing its trade deficit, because foreigners are willing to lend to the United States in the form of exchanging goods, represented by U.S. imports, for such U.S. assets as stocks, bonds, U.S. Treasury securities, and real estate and U.S. businesses.The chart below shows the continued increase in foreign holdings of US assets between 1994 and 2012: -
(click to enlarge)
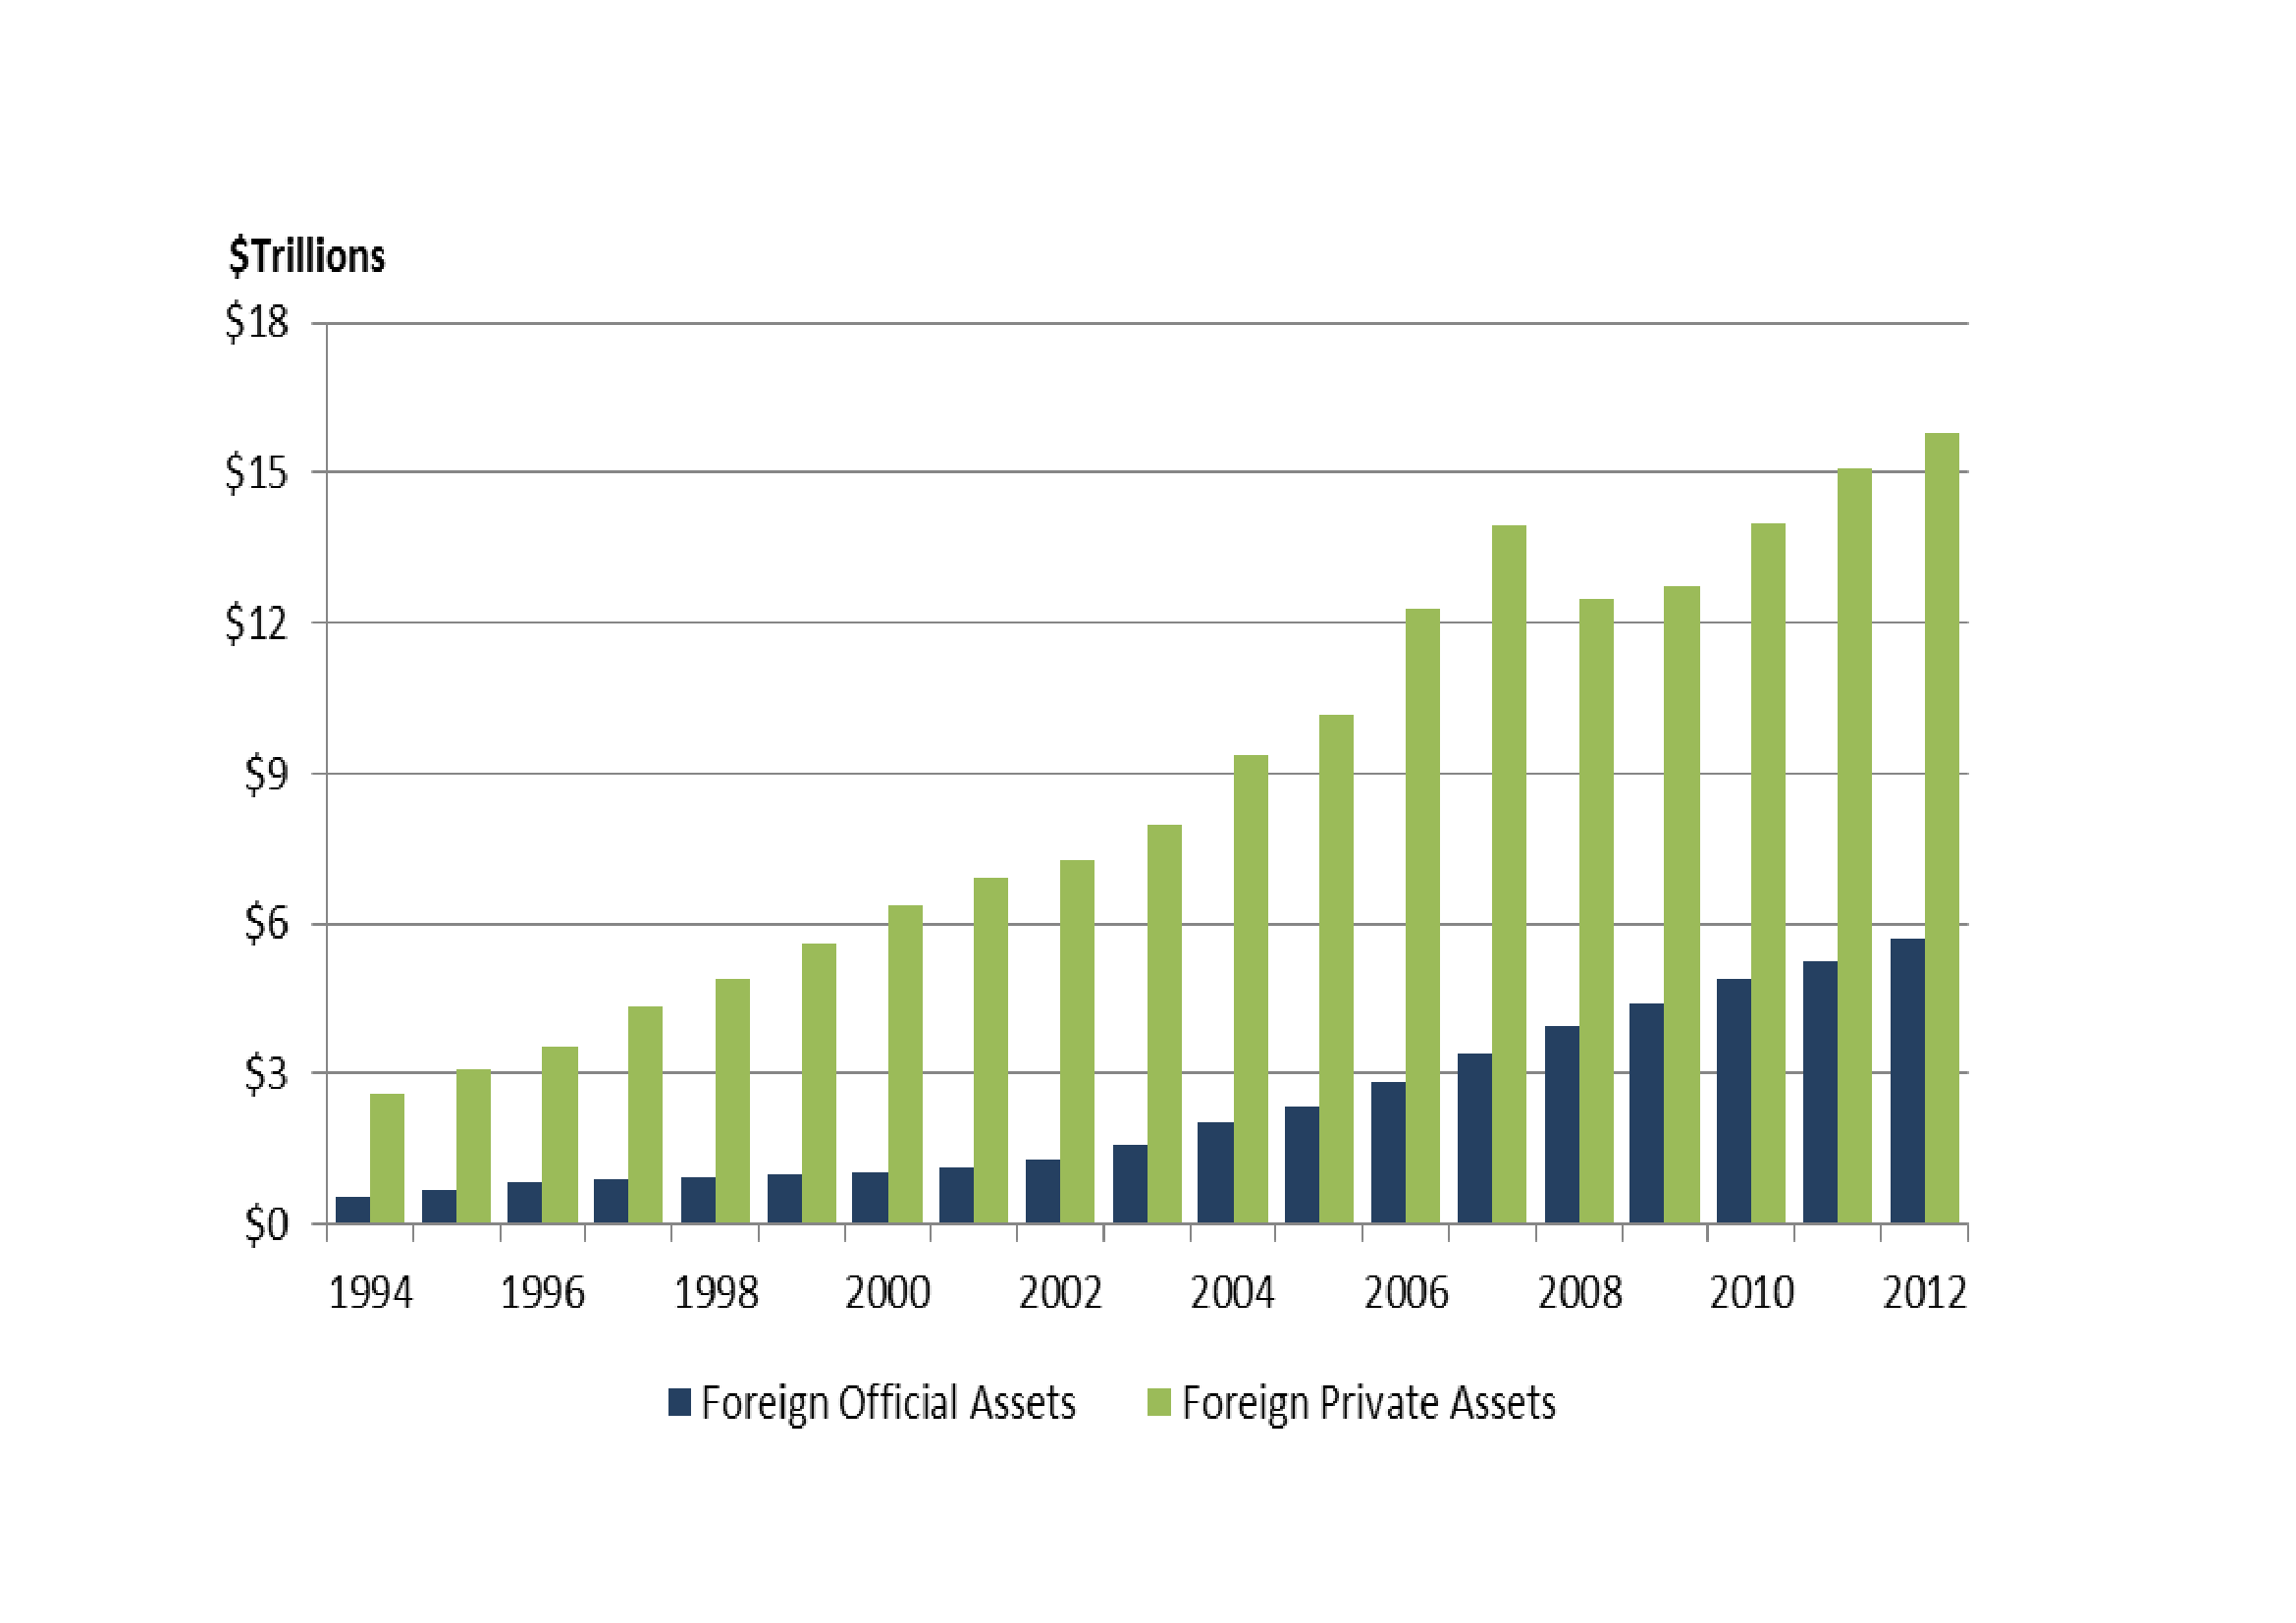
Source: US Commerce Department
The Congressional Research Service concludes:-
The persistent U.S. trade deficit raises concerns in Congress and elsewhere due to the potential risks such deficits may pose for the long term rate of growth for the economy.
In particular, some observers are concerned that foreigner investors' portfolios will become saturated with dollar denominated assets and foreign investors will become unwilling to accommodate the trade deficit by holding more dollar-denominated assets. The shift in 2004 in the balance of payments toward a larger share of assets being acquired by official sources generated speculation that foreign private investors had indeed reached the point where they were no longer willing to add more dollar-denominated assets to their portfolios. This shift was reversed in 2005, however, as foreign private investments rebounded.
Another concern is with the outflow of profits that arise from the dollar-denominated assets owned by foreign investors. This outflow stems from the profits or interest generated by the assets and represent a clear outflow of capital from the economy that otherwise would not occur if the assets were owned by U.S. investors. These capital outflows represent the most tangible cost to the economy of the present mix of economic policies in which foreign capital inflows are needed to fill the gap between the demand for capital in the economy and the domestic supply of capital.
Indeed, as the data presented indicate, it is important to consider the underlying cause of the trade deficit. According to the most commonly accepted economic approach, in a world with floating exchange rates and the free flow of large amounts dollars in the world economy and international access to dollar-denominated assets, macroeconomic developments, particularly the demand for and supply of credit in the economy, are the driving forces behind the movements in the dollar's international exchange rate and, therefore, the price of exports and imports in the economy. As a result, according to this approach, the trade deficit is a reflection of macroeconomic conditions addressing the underlying macroeconomic factors in the economy likely would prove to be of limited effectiveness.
In addition, the nation's net international investment position indicates that the largest share of U.S. assets owned by foreigners is held by private investors who acquired the assets for any number of reasons. As a result, the United States is not in debt to foreign investors or to foreign governments similar to some developing countries that run into balance of payments problems, because the United States has not borrowed to finance its trade deficit. Instead the United States has traded assets with foreign investors who are prepared to gain or lose on their investments in the same way private U.S. investors can gain or lose. It is certainly possible that foreign investors, whether they are private or official, could eventually decide to limit their continued acquisition of dollar-denominated assets or even reduce the size of their holdings, but there is no firm evidence that such presently is the case.The author appears to be saying that, so long as foreign private investors are prepared to continue acquiring US assets, the US need not be overly concerned about the deficit. Given that this should be negative for the US, what are the medium-term implications for the US Dollar?
Gold vs. US Dollar
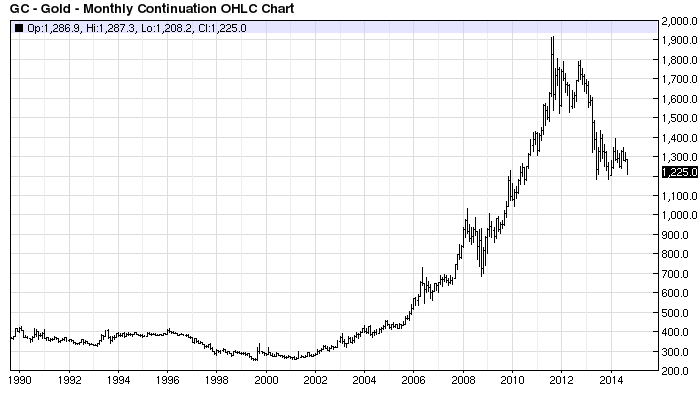
Evaluating the US Dollar, in a world where all the major fiat currencies are attempting to competitively devalue, is fraught with difficulty, however, the price of gold gives some indication of market perceptions. It seems to indicate a resurgence of faith in the US currency:-
(click to enlarge)
Source: Barchart.com
The substantial appreciation in the price of gold since 2001 is evident in the chart above, however, since the US economy began to recover from the Great Recession and financial markets perceived that QE3 might suffice to avert deflation, gold has lost some of its "safe-haven" shine. 10 yr US Treasuries yield 2.56%, the S&P 500 dividend yield is 1.87% - whilst these are historically low they look attractive compared to 10 yr German Bunds at 0.97% or 10 yr JGBs at 0.54%.
Leading Indicators
The Philadelphia Federal Reserve - Leading Indicators shows the breadth and depth of the prospects for the US economy, below is their latest heat map: -
(click to enlarge)
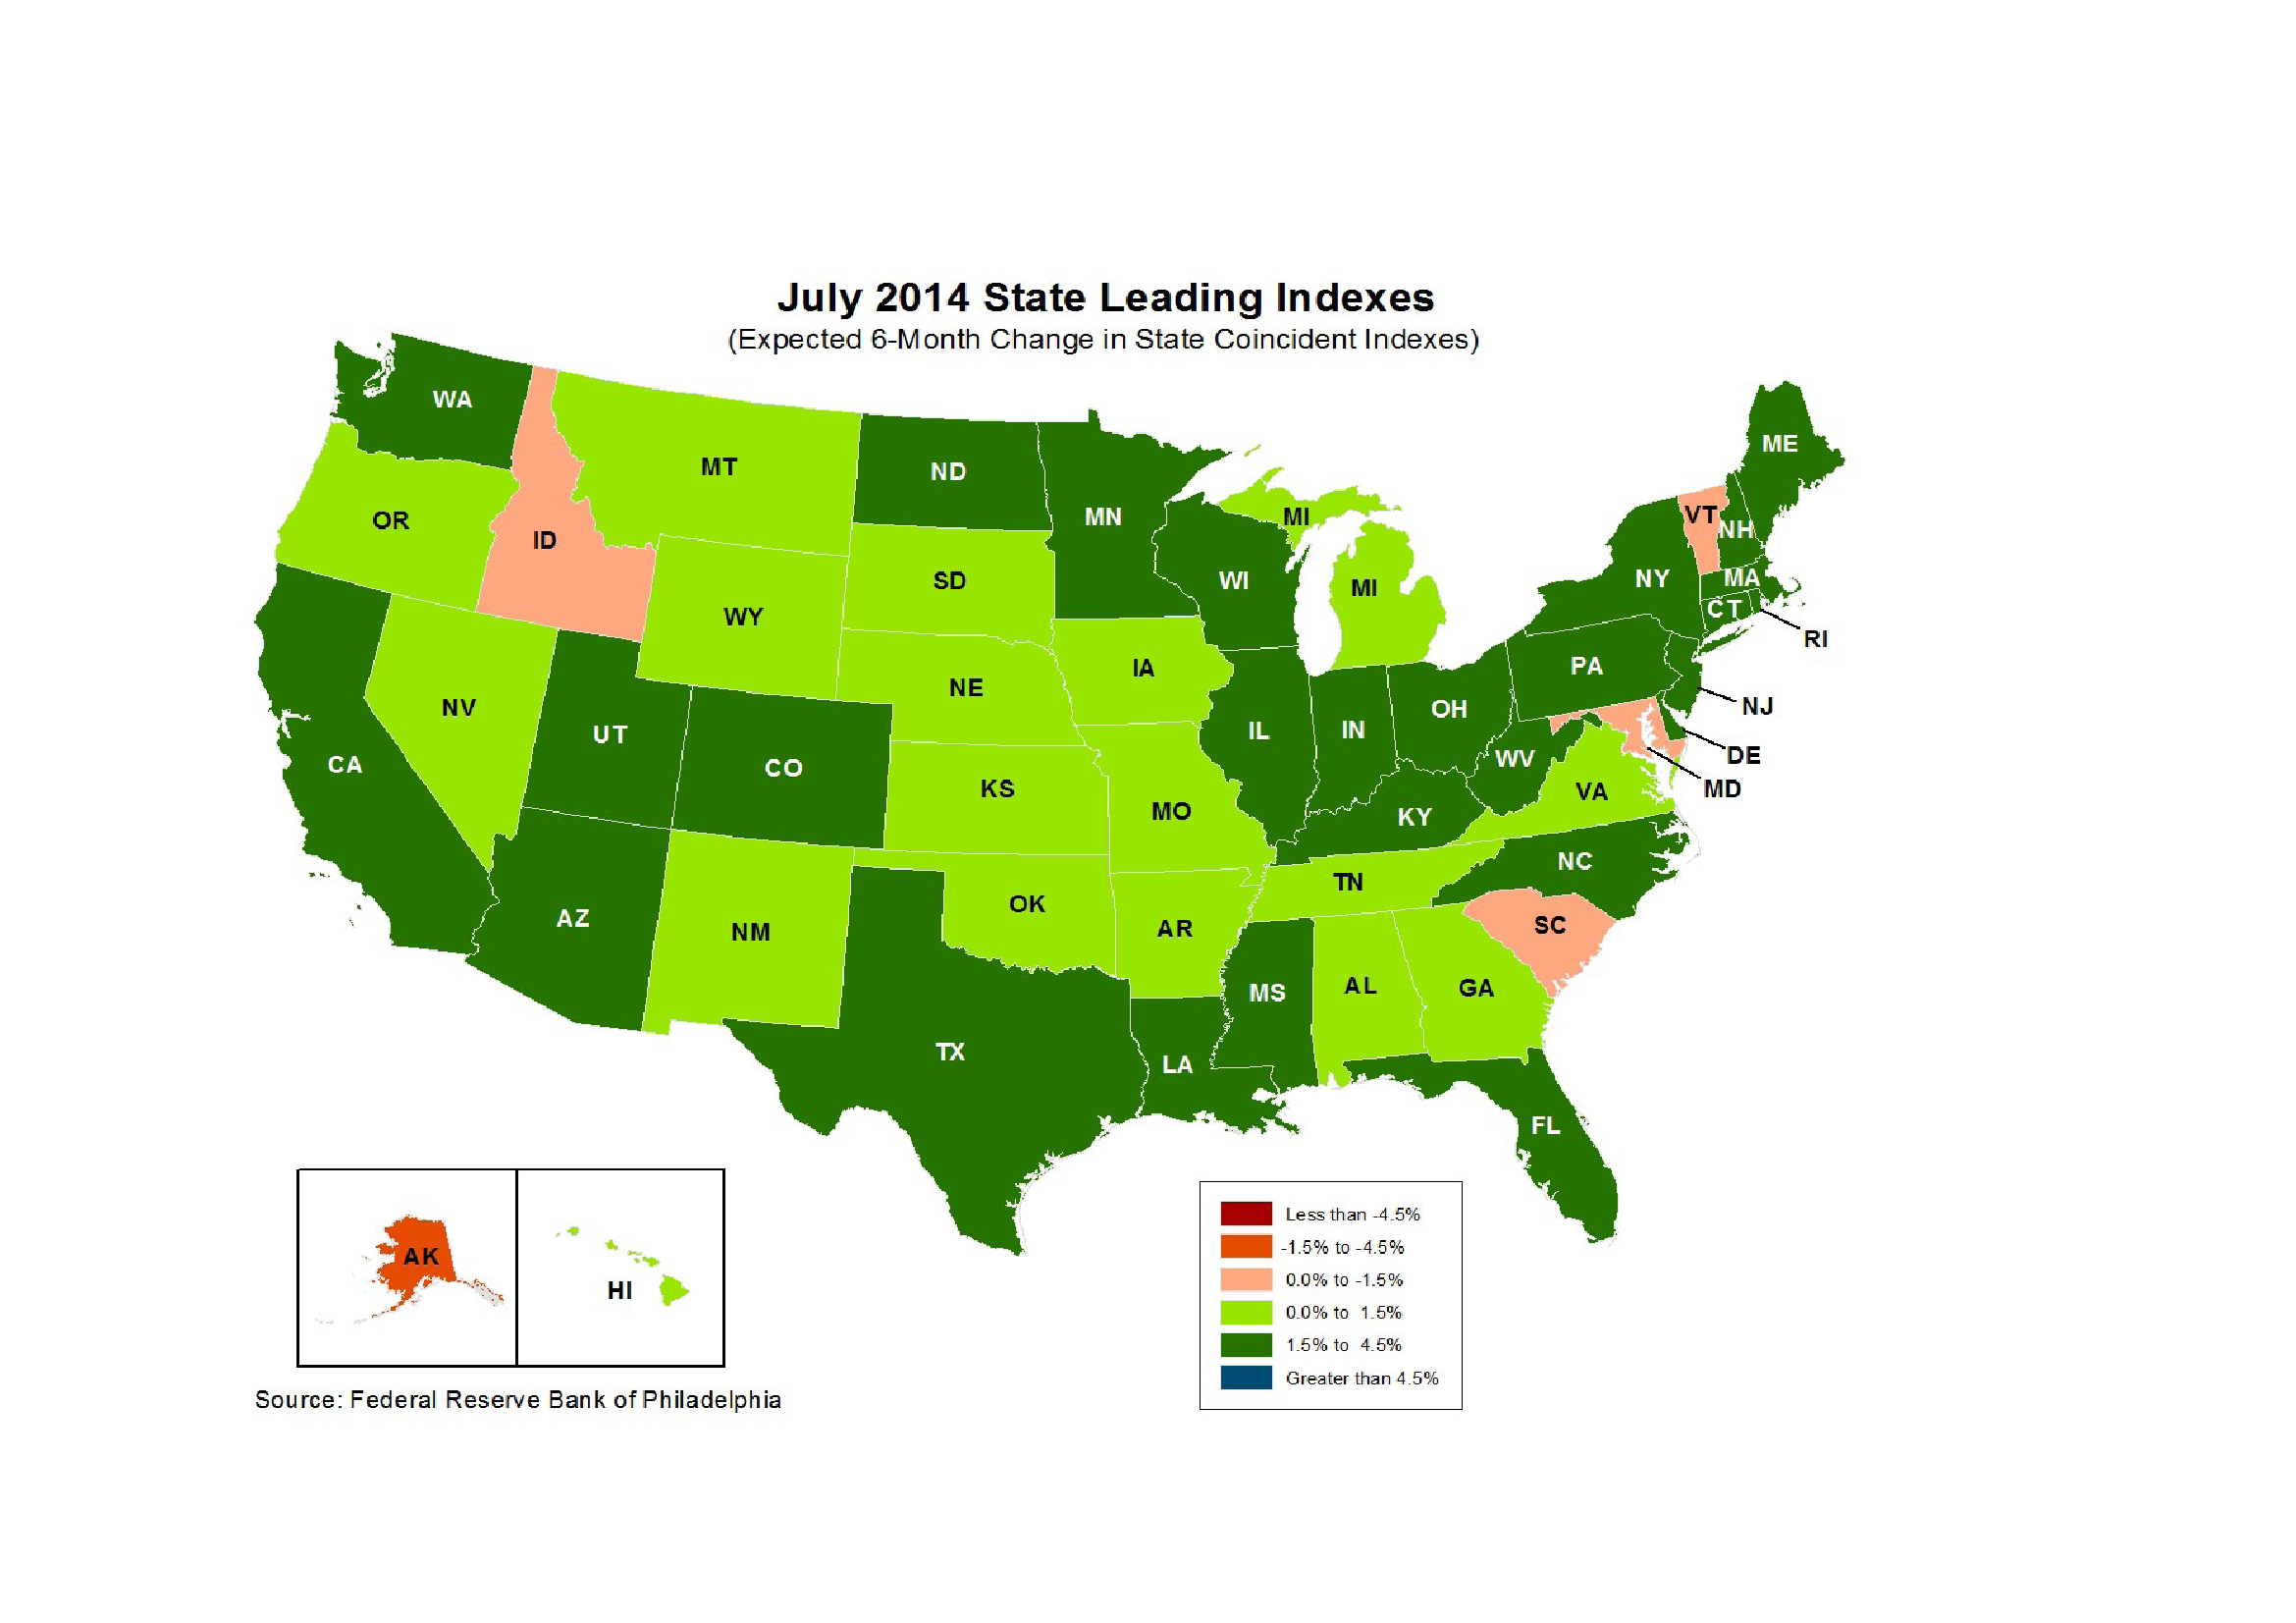
Source: Philadelphia Federal Reserve
Below is a chart of the evolution of US Leading Indicators since 1995:
(click to enlarge)
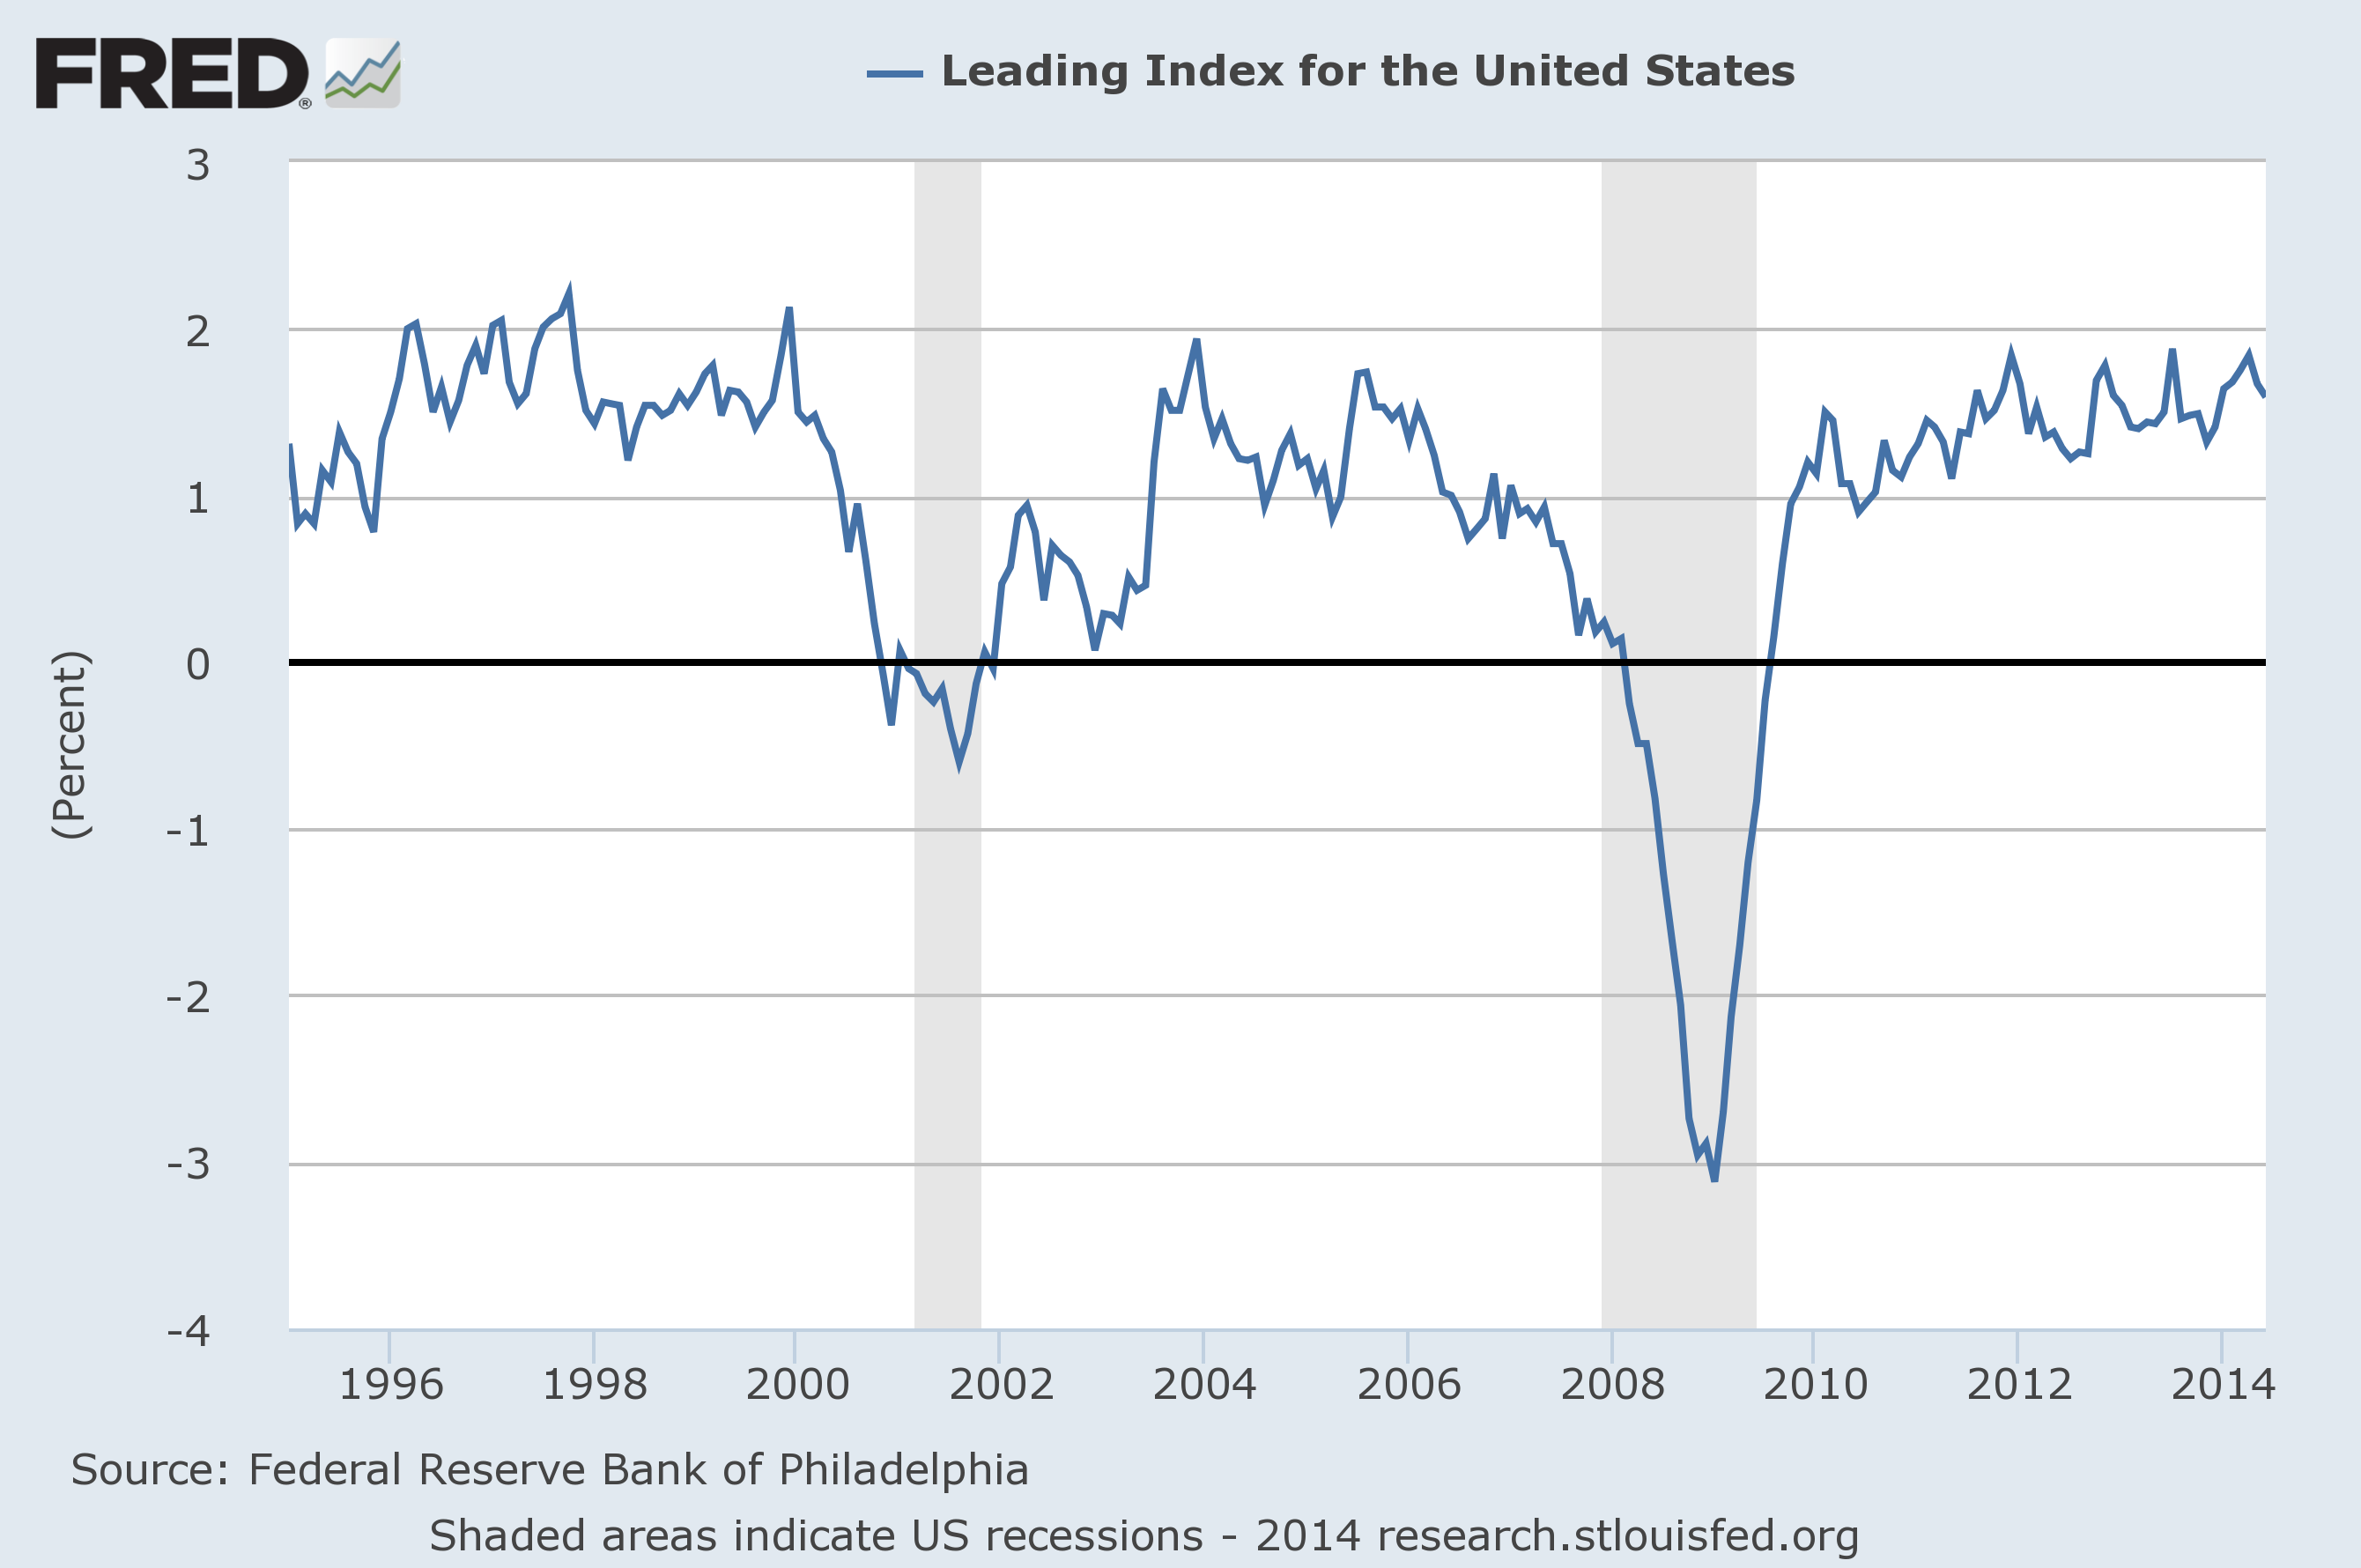
Source: St Louis Federal Reserve
The relative strength of the Leading Indicators has not been as evident in the GDP data. This supports arguments such as CEPR - Is US economic growth over? September 2012 by Robert Gordon in which he promulgates his theory of structurally lower productivity growth in the US over the coming decades.
Personally I am not convinced that we have seen the end of productivity growth. I believe the extraordinary improvements in energy technology and productivity will begin to show up in broader data over the next few years.
Which leads me back to pondering on Governor Yellen's recent comments after the FOMC Press Conference:-
...If we were only to shrink our balance sheet by ceasing reinvestments, it would probably take, to get back to levels of reserve balances that we had before the crisis. I'm not sure we will go that low but we've said that we will try to shrink our balance sheet to the lowest levels consistent with the efficient and effective implementation of policy. It could take to the end of the decade to achieve those levels.This suggests the Federal Reserve may never sell any of the assets they have purchased but simply hold them to maturity. In an oblique way this view is supported by a paper from the Chicago Federal Reserve - Measuring fiscal impetus: The Great Recession in historical context which was published this week. They examine the link between changes in fiscal policy in the immediate wake of the Great Recession and more recently the slow pace of this cyclical recovery. Looking forward they opine: -
Fiscal policy during the Great Recession was more expansionary than in the average post-1960 recession, with declines in taxes, increased in transfers, and higher purchases all contributing to higher than typical fiscal impetus. This pattern reversed itself following the cyclical trough, with declining purchases, particularly among subnational governments, accounting for most of the shortfall. By mid-2012, cumulative fiscal impetus was below the average level in other post-1960 recessions. Although fiscal restraint is expected to ease somewhat over the coming years, there is no indication that fiscal policy will be a meaningful source of economic growth in the near future.If fiscal policy is unlikely to be a meaningful source of economic stimulus in the near future then monetary policy will have to do the lion's share of the heavy lifting.
Where next for the US Dollar
The economic fundamentals of the US economy look solid. Regions like Texas might even be in danger of overheating as this report from the Dallas Federal Reserve - Regional Growth: Full Steam Ahead - makes clear:-
The regional economy is surging, with the Texas Business Outlook Survey (TBOS) production and revenue indexes at multiyear highs and annualized job growth of 3.6 percent year to date. Second-quarter job growth was 4.6 percent annualized, and July job growth was just as fast. Energy production continues to increase, and the rig count has risen since last August in spite of a decline in oil prices. Texas exports rebounded in July.
... All told, the regional economy is growing at an unsustainable pace. Texas employment has grown at more than twice its long-run average rate over the past four months. Declines in unemployment measures have slowed, suggesting Texas is near full employment and slack is being depleted. The rapid growth has led to labor shortages, which can cause bottlenecks in production and hurt productivity. Tight labor and housing markets are leading to mounting wage pressures and increasing prices.Dallas Federal Reserve President Richard Fisher has been a hawk for as long as I can remember, however, he plans to retire in April of next year. As does his fellow hawk Charles Plosser - President of the Philadelphia Fed, although Jeffrey Lacker - President of the Richmond Fed - will take up the hawkish cause in 2015. Nonetheless this weakens to case for any rapid tightening of policy beyond the tapering of QE.
Given the zero bound interest rate policies of all the major central banks, growth rather than expectations of widening interest rate differentials is more likely to determine the direction of currencies. Therefore, the slower the Federal Reserve act in tightening policy, the stronger the momentum of US GDP growth, the larger the capital inflows and the stronger the support for the US Dollar.
Elsewhere, the prospects for EU growth are much weaker. Further QE is imminent after last week's disappointing uptake of TLTRO funds - Bruegal - T.L.T.R.O. is Too Low To Resuscitate Optimism has more detail. The BoJ, meanwhile, continues with its policy of QQE yet, without the Third Arrow of the Abenomics - serious structural reform - Japan is unlikely to become an engine of economic growth. China continues its rebalancing but the momentum of growth is downward. In this environment the US looks like a land of opportunity to the optimist and the "least worst" safe-haven in an uncertain world for the pessimist. Either way, barring a substantial escalation in direct geopolitical risk, the US Dollar is unlikely to weaken.
Technically the currency is looks set to appreciate further; in so doing this may create a virtuous circle reducing import price inflation and delaying - or possibly mitigating the need for - tightening by the Federal Reserve.
0 comments:
Publicar un comentario