Gold: Quick Glance At Targets And Probabilities
August 16, 2012
by: Ypa Finance
.

Most investors and traders usually look at daily charts, but sometimes weekly
and even monthly charts have very interesting stories to tell. Yesterday I
hadn't looked at the weekly chart of gold (ETF: GLD) for 2 months, knowing that whatever it would be I had
no plan to sell my metal this year.
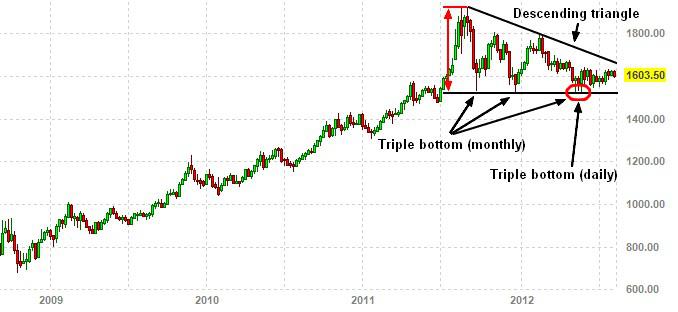
.Here is the weekly chart of gold futures with annotations about some patterns:
.
(click to enlarge)
(chart from finviz.com)
(chart from finviz.com)
.
The configuration "looks bullish," but what does it really mean in terms of
probabilities?According to Thomas Bulkowski's work on chart patterns, a descending
triangle has generally a 36% probability to break out upwards. But when it is a
continuation (price rises into the pattern, which is the case here) it breaks
out upward 73% of the time. A measured rule gives a target in the $1800-1950
area, depending on when the triangle will be broken.
Now let's look at the daily chart:
(click to enlarge)
(chart from finviz.com)

(chart from finviz.com)
According to Bulkowski an ascending triangle has a 70% probability to break
out upward, and here a measured rule gives a target above $1700.
Moreover, another fact is ignored by most investors: Gold price in EUR is
just 3% below its historical top.
.
.
 (chart
from goldprice.org)
(chart
from goldprice.org)
In EUR the triangle is almost symmetrical. According to Bulkowski a
symmetrical triangle breaks out upward 54% of the time.
Conclusion:
From a pattern point of view, the charts are bullish for gold price, both on
the daily and weekly timescales and both in dollar and euro. The configuration
suggests that the probability for the price in dollar to break out is about 70%.
It may reach $1700 in the next few months and rise between $1800 and $1950 next
year or even sooner.
.
Please don't forget that precious metals are subject to interventions and
expectations generated by central banks. Anything can still happen on the short
term. A quick dip below the lower side of the triangles would not necessarily
invalidate the patterns. The longer gold stays above its $1530 support, the
higher the probability that the next move will be upside and significant. The
major headwinds for precious metals are that the Fed might not deliver the
expectation of QE3 and that short sellers may continue to control
the gold and silver futures market.
.
My opinion is that investors should avoid buying GLD and prefer GTU, CEF
(gold+silver) or the gold funds of Zürcher Kantonal Bank. I have explained why
in this article and also in this one. To clarify my position, I'm bullish on gold, but
not a gold bug. I put much more energy and time in probabilistic strategies (my methodology here).
0 comments:
Publicar un comentario