Why Silver Backwardation Matters
February 14, 2011
By Laura Crigger
Last week, silver slipped into backwardation, and, as Monty Python would say, there was much rejoicing.
Backwardation in silver is a Big DealTM, as it's been over 10 years since we last saw near-term futures contracts trading higher than ones further out in the curve. In fact, not since Warren Buffett snatched up 130 million ounces back in 1997 have we seen the metal go backwardated. Even then, the condition was short-lived.
This time, however, backwardation may prove to be more persistent.
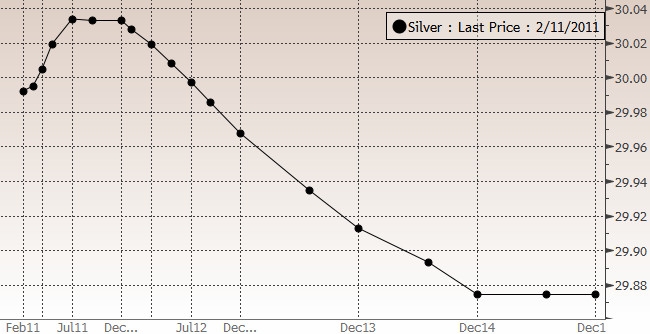
Compare the silver futures curve as of last Thursday's close, the chart that sent so many silver bugs into the streets ...
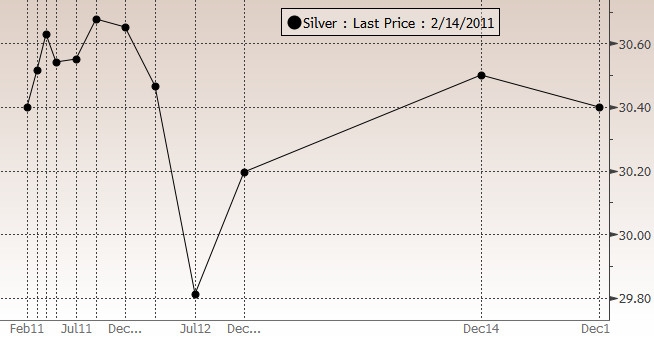
... with the silver futures curve as of today, Monday, Feb. 14 [current as of 11:30 a.m.]:
In last week's chart, we see that even though backwardation showed up in 2011, it remained slight, with merely the September 2011 contract trading a few cents lower than the July 2011 one. Backwardation intensified, however, as contracts stretched into 2012, with prices dropping steadily compared with the July 2011 contract.
On Monday, however, we see that backwardation across the curve has intensified significantly in 2011, with not only May's and July's contracts trading lower than April's, but also December's contract trading lower than September's. Also, it's kind of hard to ignore that steep decline into the July 2012 contract—something that didn't show up in last week's chart.
Granted, most investors don't think backwardation "counts" until the impending roll yield (in this case, the March-to-April roll) would net you a positive return—and as we can see, silver isn't quite there yet.
Still, backwardation—the textbook definition of it—has hit across silver's curve, and the change from last week to this week suggests to me that traders are getting downright spooked.
As with any commodity, backwardation usually implies some shortage of physical supply. And today's chart tells me not only are traders expecting more sustained shortages, but that they think those shortages will occur sooner rather than later.
From my perspective, it's not a bad guess.
What's Behind Backwardation In Silver?
Backwardation rarely occurs in precious metals markets; the opposite condition—contango—usually dominates the futures curve, as traders must factor in the cost of storage and insurance for deliverable stocks. So more than anything else, silver's current backwardation reflects just how much the supply/demand balance has tightened in recent months.
Evidence shows that silver supplies are indeed tight. Silver in Comex stockpiles—which, of course, is what U.S. futures are tied to—are at a four-year low, with Reuters reporting that they'd fallen to 102.5 million troy ounces (3,188 tonnes) as of Feb. 5.
That's about 30 percent down from their 2007 high of 141 million troy ounces (4,395 tonnes).
But it's not just an issue of available supply. Demand, too, is on the rise.
As the industrial sector continues to recover, its demand for high-grade physical metal also increases. We've covered silver's industrial demand drivers several times in the recent past, so I'll refrain from a detailed analysis here. Suffice to say that as companies involved in clean energy, cell phones and next-gen water purification thrive and expand, so too will their demand for the metal.
"The problem is that there is great industrial demand for a specific grade of silver, and there is not enough coming fresh from the mines," Miguel Perez-Santalla, vice president of Heraeus Precious Metals Management, told Reuters.
Speaking of miners, they've recently been ramping up their hedging programs, in order to lock in today's high prices for their future output. Generally, producers achieve this by selling their future production forward and borrowing metal from the market today.
Although it tends to increase overall market supply, producer hedging also tends to drive demand for nearby contracts higher—a trend we see reflected in the six-month silver lease rates, which have risen to their highest level in 18 months. Higher lease rates generally nudge up nearby delivery contracts as well.
Finally, retail investment remains robust. U.S. Mint American Eagle silver coins have hit nearly 6.5 million in sales—a record high figure since the coin's introduction back in 1986. This has more than offset the outflows from ETF holdings; globally silver ETF holdings decreased 3.2 percent month-over-month, although they still hold more than 466 million troy ounces of silver (Bloomberg, as of Feb. 10).
When you combine all these fundamentals, you get the simplest equation in the book: Lower supply + Higher demand = Persistent backwardation.
A Breakout Ahead?
Of course, the futures markets can rarely be boiled down to simple arithmetic. The factors may be in place for backwardation to stick around a little longer, but is this really setting up the silver breakout that David Morgan predicted last time we spoke with him?
Let's not get ahead of ourselves.
In a note to his subscribers over the weekend, Morgan pointed out that despite the market's current backwardation, volumes on silver contracts with further-out deliveries remain relatively thin. "Once any real volume comes into those back months, you will quickly see the prices rise," he wrote.
What's more, it pays to remember that silver is a much smaller market than gold, and far more volatile; thus, it has the tendency to swing with more oomph than we're used to seeing in the yellow metal. A lack of trading volume in an already volatile market is hardly compelling proof of a breakout-to-be.
Still, maybe there's room for some rejoicing. But just a little.
0 comments:
Publicar un comentario