Barron's Cover
The Great Fund Fee Divide
By Reshma Kapadia

The mutual fund industry has spent years trumpeting how costs have come down for investors.
That’s true, but misleading. Asset managers haven’t exactly slashed their fees. Instead, the credit goes largely to investors—but some of them are being left behind.
When given the option, investors have flocked to lower-cost funds: That’s actually the real trend behind the tired active/passive debate. Sure, actively managed funds on the whole saw $396 billion exit last year through November, while cheaper index and exchange-traded funds took in $694 billion. But low-cost actively managed funds actually did quite well, thank you very much, garnering almost $353 billion of new money in the same period. Some 78% of all mutual fund assets now sit in the cheapest two quintiles.
Yet $1.3 trillion, more than 8% of the industry’s assets, remains in the two priciest quintiles of annual fees, according to Morningstar Direct. So who are the investors in these funds? Are they unaware of how much they’re paying for their funds, or do they have no other choice? Barron’s wanted to know which portfolios those funds may be in—and why they are still there.
The answer is troubling, though perhaps not surprising: The little guy pays the most. But those little guys are bigger than you might think.
Granted, some asset classes or investing styles require more expertise, so those funds can be more expensive—think frontier market or unconstrained bond funds. But that’s not what we’re talking about. Beyond the funds that charge more for understandable reasons, there are many more where the fees are much harder to justify.
To find the most egregious examples, Barron’s culled data from Morningstar Direct; Broadridge Financial Solutions, a fintech and fund research firm; and BrightScope, a 401(k) data and analytics firm, and canvassed financial advisors, retirement consultants, and fund researchers.
For the most part, the industry’s priciest funds are in accounts that are too small to get much attention. Sometimes they’re in the 401(k) plans of small businesses. Sometimes they’re in target-date funds. Sometimes they’re simply in portfolios with less than the $1 million needed to command the attention of advisors. “No matter how you slice it, funds have gotten less expensive over time,” says Jeff Tjornehoj, director of fiduciary and compliance research at Broadridge. “That said, there are still some investors stuck in higher-cost products where reducing the fee just five or 10 basis points doesn’t move the needle. [One basis point is 1/100th of a percentage point.] So there is still some work to be done.”
There are two main problems: Some funds simply charge too much, while others are pricey because of how they’re sold, via a dizzying array of share classes. There are 8,066 mutual funds with distinct portfolios. But when you tally up the various iterations of each fund, there are more than 25,000. Share classes are essentially financial agreements between the fund company and the distributor of the fund (a broker, advisor, or retirement plan). As a result, investors can pay very different prices for the same fund depending on which share class they’re in.
Investors pay an annual fee called the expense ratio; it’s calculated as a percentage of their investment. The expense ratio includes a laundry list of shareholder fees that go to the administration and operation of the fund, including the fee charged for managing the portfolio, which must be the same across all share classes. But the expense ratio can also include another fee, known as the 12b-1 fee, which goes to costs related to distributing and marketing the fund.
That means each share class can charge investors differently.
This is where it gets tricky—and it’s worth noting that exchange-traded funds don’t have share classes and don’t charge a 12b-1 fee; their expense ratio is the same no matter how or where you buy them. Understanding share classes and the 12b-1 fee is key to determining if you are paying too much for your mutual fund investments.
JUST WHO IS PAYING the 12b-1 fee has been changing as the financial advice industry goes through a major transformation. In the past, advisors were primarily paid via the investments they put their clients into. Investors either paid an upfront sales commission, known as a load, for A shares, generally 4.5% to 5.75% of their initial investment, which is funneled back to the advisor. Or they paid for the advice through a higher 12b-1 fee on an annual basis, known as C shares. Both share classes typically have higher-than-average expense ratios, with C higher than A. (For more on share classes, see story, “Share Classes Explained.”)
This obviously creates the potential for abuse, with advisors essentially incentivized to choose products that pay them the most, and even to churn portfolios too frequently to keep their pay coming. That’s why investors have increasingly flocked to independent financial advisors who charge an annual fee based on assets, rather than a commission. These fee-based advisors choose funds that don’t carry sales charges, and often use cheaper share classes. Half of the fund industry’s assets are now in cheaper institutional shares, which don’t usually charge 12b-1 fees, and another third of assets are in no-load shares, which are not allowed to charge more than 0.25% for a 12b-1 fee. That’s a maximum of $25 on a $10,000 investment, though no-load funds often don’t charge any 12b-1 fee.
Granted, the expense ratio is just one part of the total cost of investing—investors working with advisors who can get them into cheap institutional share classes must still pay their advisor’s fee. But the expense ratio is the preferred proxy for mutual fund costs—and Morningstar’s research has found it to be one of the best predictors of a fund’s future performance.
“Just like seeing the calories displayed when ordering food doesn’t tell you the full story, it does make you pause and assess if the snack is really worth it,” says Manisha Thakor, director of wealth strategies for women at independent advisory firm Buckingham Strategic Wealth, which oversees $13 billion. “Expense ratios are the financial version of those calorie counts.”
Now, here’s where the fund industry trumpets how cheap investing has become. As more money has moved into these cheaper share classes, the dollar-weighted average expense ratio has declined, falling to 0.63% for stock funds in 2016 from 0.88% a decade earlier, according to the Investment Company Institute, an industry trade group.
But dollar-weighted averages just tell the story of where investors are putting their money—into the cheapest funds—and are not a reflection of the fund industry slashing prices.
Just because more people are shopping at Marshalls doesn’t mean the price of designer clothing has fallen. A study by Morningstar found that a simple average of expense ratios for the largest 2,000 funds did not change from 2014 to 2016.
What’s more, not everyone has access to the industry’s version of a bargain. And some funds are simply too expensive. Even after accounting for how their funds are sold, there is still $663 billion in assets in funds charging above-average or high expense ratios, according to Morningstar Direct.
Many of these funds are small; more than 2,800 have less than $250 million in assets. Expense ratios are supposed to drop as assets rise, but investors may face an uphill battle since a shrinking asset base means fewer people to bear the costs of operating the fund, which could nudge the expense ratio in the wrong direction.
SO WHERE ARE these pricey funds—and how do you ensure you’re not invested in them?
Since the way you buy your mutual fund affects the expense ratio you pay, bigger is better.
Working with a fee-only advisor generally gets you into cheaper share classes than on your own. Bigger employers are usually better able to negotiate for cheaper funds in their 401(k) plans than their small-business counterparts.
To root out the worst offenders, Barron’s focused on three areas: Funds sold through commissions, funds in small 401(k) plans, and target-date funds.
Load Funds
While investors are moving away from the commission-oriented way of paying for financial advice through their investments, 12% of the fund industry’s assets, or $2 trillion, still sit within this segment of the market. It is also where fee-only advisors say pricey funds turn up. “We often see these funds in portfolios of the young adult children of our clients when we do a courtesy check of their holdings,” Thakor says. “Their assets are so small, the only way a broker can monetize it is by using the highest-cost options.”
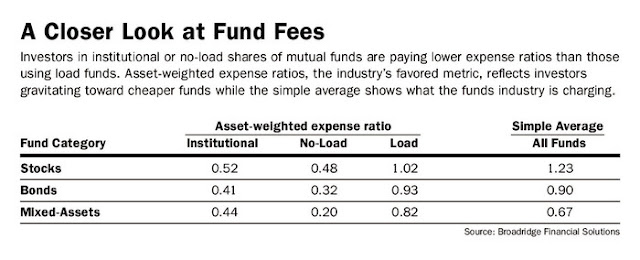
Load funds don’t have to carry higher annual expense ratios, but they often do. The asset-weighted average expense ratio for an institutional share class of a stock mutual fund is 0.52%.
For investors in load funds, the average was double—1.02%—according to Broadridge. That’s in part because commission-paid advisors are far less likely to use index funds, since they’d typically get paid less. That’s a significant gap—a difference of half a percentage point, or 50 basis points, can leave investors with 13% less after 30 years. So paying 0.75% annually versus 1.25% annually means you’ll end up with $23,400 more on a $50,000 investment that earns an average 5% a year over three decades.
“It is confusing. As an individual investor, you don’t necessarily know that there is a trade-off and an alternative share class. Investors need to ask what they own and why,” says Dawn Doebler, a Bethesda, Md.–based financial advisor for the Colony Group, which oversees $7.5 billion.
What to watch out for: a portfolio filled with an alphabet soup of share classes, or a portfolio of $250,000 or more that is stuffed with C share classes. C shares, which are beginning to dwindle as some brokers convert them to A shares, still account for $719 billion in assets. C shares can charge the maximum 1% 12b-1 fee, making them one of the most expensive options. For accounts of $250,000 or more, cheaper options should be available. Pricey funds also crop up in advisory relationships.
“If one or two of your funds are institutional share classes but not all of them are, it’s a red flag because [the advisor] could be picking and choosing how much to layer the costs in to you,” says Gary Ribe, chief investment officer at Macro Consulting Group. “If your advisory account is more than $100,000 and there are A shares there, ask why; practically every fund family has a version of their fund with no 12b-1 fee.”
Another tip: Check for subadvised funds, which can be more expensive. For example, the $4.5 billion Hartford Equity Income fund (ticker: HQIIX), which is subadvised by Wellington Management’s veteran manager W. Michael Reckmeyer, charges 0.77%—an average expense ratio, according to Morningstar. But Ribe says investors can get a similar portfolio through the $31 billion Vanguard Equity Income fund (VEIPX), two-thirds of which is also run by Reckmeyer but costs just 0.26%. Switching to the Vanguard fund would have meant an additional 0.75% in annualized returns over the past five years, Ribe says. Similarly, John Hancock Equity Income (JHEIX) charges 1.14% and is subadvised by T. Rowe Price manager John Linehan. But the T. Rowe Price Equity Income fund (PRFDX), which Linehan manages, costs nearly half as much, at 0.66%.
Small 401(k) Plans
The plight of the little investor is perhaps most sharply on display in the 401(k) market. Investors who work for smaller employers can find themselves at an even bigger disadvantage. “Self-directed investors have never had it better in terms of expense ratios, but that is not the case for smaller investors in the broker-dealer market,” says Micah Hauptman, financial-services counsel at the Consumer Federation of America. “And investors who have small 401(k) plans pay costs that are orders of magnitude higher than they could pay for similar products in the self-directed retail market.”
On average, 401(k) plan participants paid less for mutual funds than those investing outside of plans—an average expense ratio of 0.48% for a stock fund compared with the broader asset-weighted average of 0.63%, according to the latest joint analysis by 401(k) tracker BrightScope and ICI.
Large 401(k) plan sponsors enjoy some of the cheapest expense ratios, sometimes paying as little as $3 per $10,000 invested. But smaller 401(k) plans aren’t as fortunate. While plans with more than $1 billion paid an average 0.39% for their stock fund, plans with less than $10 million paid more than double that, 0.82%.
The data understate the problem, in part because small plans (defined as those with fewer than 100 participants) aren’t required to provide the same level of disclosures, Hauptman says. Though small, these plans are numerous, representing 90% of all 401(k) plans available and 8.6 million people—and holding about $680 billion, or 16% of 401(k) assets.
A few reasons for the fee disparities stand out. One is the fund lineup. When the company providing the documentation and administrative tasks, or record-keeping, for a plan is also the source of the investments, proprietary funds tend to dominate the choices. Larger plans have separated the roles, requiring the administrator of the plan to offer funds from other companies. That has not happened as much in smaller plans.
Perhaps even more notable is the presence of insurers, which tend to have higher-cost funds. Insurers are the record-keepers for just 14% of the largest plans but for more than half of small plans, according to BrightScope.
What’s more, besides having less heft to negotiate for lower expense ratios and plan costs, smaller plans’ expense ratios often include the higher costs related to servicing smaller businesses’ retirement plans, which are then spread across fewer assets. “It’s a bit like no-fee checking at Chase. If you have $1 million in the account, you get it free. You have to pay if you have less,” says Brooks Herman, BrightScope’s head of data and research.
Unfortunately, there’s not much that participants in a pricey 401(k) can do—and the long-term tax advantages of investing in a 401(k) versus a taxable account almost always outweigh even the priciest of funds. But Christopher Jones, chief investment officer at Financial Engines, which offers financial advice to retirement plans, says that investors in small 401(k) plans paying more than 1% in fund expenses should put pressure on their plan sponsors to ask why. Larger companies have been sued for not offering their participants lower-cost fund options, and consultants are turning their attention to this part of the market, which could turn up the pressure.
When changing jobs or beginning retirement, investors should evaluate whether they can get the same funds for less (or better funds) by rolling their 401(k) into an individual retirement account. Some plans allow for “in-service withdrawals,” allowing investors to roll their 401(k) assets into an IRA while still working.
Target-Date Funds
Target-date funds, the default option in many 401(k) plans and a one-stop shop for investors looking for simple diversification, epitomize the “set and forget” type of investment. These funds of funds offer an asset allocation that changes over time. “We encourage people saving for retirement to set and forget it because we don’t want them to churn investments. But that may have diluted the incentive to take a more active role in monitoring the fees,” says Sheila Bair, the former chair of the Federal Deposit Insurance Corp. and now advisor to Blooom, a robo-advisor that oversees $1.8 billion, focusing on individuals’ retirement accounts.
Like the precut vegetables at the store, these funds cost a bit more than if someone assembled the pieces themselves. That extra fee varies based on how an investor bought the fund, with those using A or C shares often paying more than going direct.
While most of these funds live inside 401(k) plans, some are sold through commission-oriented brokers. “If a small investor approaches a broker-dealer with $50,000 to $100,000 to invest, that’s a small amount for the brokers to get too involved, so they tend to put them into target-date funds or target-risk funds based on their risk appetite,” says Tjornehoj of Broadridge.
The underlying funds also play a role in the overall cost. Fund companies such as Vanguard Group and T. Rowe Price build their target-date funds entirely out of their own firm’s offerings. But other firms, including Voya Investment Management, Principal Global Investors, and Charles Schwab, have an open-architecture approach that allows them to include funds from any firm. That sounds like it would be advantageous for the investor, but that’s not always the case.
A recent paper co-authored by Martin Gruber, an emeritus professor of finance at New York University, found that target-date fund managers often picked funds that helped their firm’s own objectives at the expense of potentially lower returns. Sometimes that meant picking their own higher-cost fund over a cheaper alternative, or picking a younger, smaller fund from their own stable over one with a longer record—both of which led to underperformance. “For most people who don’t want to get too involved, target-date funds make sense, but they can’t just say it’s a good investment. They have to shop around,” Gruber told Barron’s.
It’s not easy to comparison-shop, though, in part because fund firms differ in their views about the right asset allocation and how it shifts over time. Some funds also invest in a more diverse array of assets, which can throw off price comparisons. And some target-date funds are index only, while others are all active, or a mix. All of this is reflected in the spectrum of median expense ratios for target-date series that range from as little as 0.08% to as high as 0.85%, according to Morningstar.
Take the Voya Solution series. About 80% of its underlying funds are active, contributing to its higher-than-average median expense ratio. But the fund series is also pricier than other rivals that use active funds, like the John Hancock Multimanager Lifetime series and T. Rowe Price’s Retirement Series. Voya uses both its own funds and subadvised funds, including a multimanager international fund that adds to its costs, says Morningstar analyst Jeff Holt.
But Susan Viston, Voya’s senior vice president on its multi-asset team, says the additional cost is “worth it” for providing diversification across asset managers. She adds that the company has introduced two cheaper iterations over the years: the Voya Target Retirement Fund series, which includes a mix of passive and active funds, and another all-passive Voya Index Solution series, which costs 0.18%.
Some funds are expensive even when they invest entirely in cheap exchange-traded funds. Of the 22 target-date funds Morningstar evaluates, State Farm LifePath series is the only one that gets a negative rating. The insurer has reduced fees in recent years by as much as 30 basis points and switched to an entirely passive approach. That has helped, but not enough. Though the fund invests in eight iShares ETFs, very similar to the BlackRock LifePath Index funds, the State Farm LifePath series charges 0.77%—about half a percentage point more than BlackRock’s series.
Corey Schieler, director of mutual funds at State Farm, admits that investors could buy the BlackRock fund directly for less but says State Farm’s agents offer small investors counsel, and the fees partly reflect the higher cost of servicing smaller investors; the average account size is $25,000. “Everyone can go to the gym on their own, but some people hire a trainer and pay for that motivation and keeping them on track with the goals,” he says. “We typically serve a more middle-market consumer, which doesn’t get addressed by the financial advisor and doesn’t have the wherewithal to do it in a self-directed way through Vanguard.”
Since most target-date funds are held within retirement plans, it’s harder for investors to push plan sponsors to change. But target-date funds have evolved, with newer and cheaper versions.
Saving a quarter or half a percentage point adds up, especially over several decades of retirement savings.
“THERE IS A LOT of inertia in this business. If a fund firm can get someone to pay an extra 1% and sit in that for 20 years, there is a lot of money at stake,” Jones of Financial Engines says. “Though we are seeing price compression, it is uneven. The extended bull market has made people complacent. When the market goes down, investors tend to turn more fee-conscious.”
Perhaps that will be a small ray of light in a bear market for investors who have not yet seen the benefits of the low-fee movement.
0 comments:
Publicar un comentario